Accepted Manuscript
Hydrolytic pre-treatment methods for enhanced biobutanol production from agro-industrial wastes
Sampa Maiti, Gorka Gallastegui, Gayatri Suresh, Saurabh Jyoti Sarma, Satinder Kaur Brar, Patrick Drogui, Yann LeBihan, Gerardo Buelna, Mausam Verma, Carlos Ricardo Soccol
PII: S0960-8524(17)31697-8
DOI: https://doi.org/10.1016/j.biortech.2017.09.132
Reference: BITE 18960
To appear in: Bioresource Technology Received Date: 20 June 2017
Revised Date: 18 September 2017 Accepted Date: 19 September 2017
Please cite this article as: Maiti, S., Gallastegui, G., Suresh, G., Sarma, S.J., Brar, S.K., Drogui, P., LeBihan, Y., Buelna, G., Verma, M., Soccol, C.R., Hydrolytic pre-treatment methods for enhanced biobutanol production from agro-industrial wastes, Bioresource Technology (2017), doi: https://doi.org/10.1016/j.biortech.2017.09.132
This is a PDF file of an unedited manuscript that has been accepted for publication. As a service to our customers we are providing this early version of the manuscript. The manuscript will undergo copyediting, typesetting, and review of the resulting proof before it is published in its final form. Please note that during the production process errors may be discovered which could affect the content, and all legal disclaimers that apply to the journal pertain.
1
Hydrolytic pre-treatment methods for enhanced biobutanol production from
agro-1
industrial wastes
2 3
Sampa Maitia, Gorka Gallasteguia,b, Gayatri Suresha, Saurabh Jyoti Sarmaa, Satinder Kaur 4
Brara,1, Patrick Droguia, Yann LeBihanc, Gerardo Buelnab, Mausam Vermad, Carlos 5 Ricardo Soccole 6 7 8 9 a
Institut national de la recherche scientifique, Centre - Eau Terre Environnement, 490, 10
Rue de la Couronne, Québec(QC), Canada G1K 9A9 11
12
b
University of the Basque Country (UPV/EHU). Department of Chemical and 13
Environmental Engineering. University College of Engineering of Vitoria/Gasteiz. Nieves 14
Cano 12. 01006 Vitoria/Gasteiz, Spain 15
16
c
Centre de recherche industrielle du Québec (CRIQ), Québec(QC), Canada 17
18
d
CO2 Solutions Inc., 2300, rue Jean-Perrin, Québec, Québec G2C 1T9, Canada
19 20
e
Bioprocess Engineering and Biotechnology Department, Federal University of Paraná, 21
Centro Politécnico, Usina Piloto B, CEP 81531-990 Curitiba, Paraná, Brazil 22 23 24 25 26 27 28 29 30 31 32 33 34 35 36 37 38 39 40 41 1
Corresponding author, Phone: 1 418 654 3116; Fax: 1 418 654 2600; E-mail: 42 satinder.brar@ete.inrs.ca 43 44 45 46
2
Abstract
1
Brewery industry liquid waste (BLW), brewery spent grain (BSG), apple pomace solid 2
wastes (APS), apple pomace ultrafiltration sludge (APUS) and starch industry wastewater 3
(SIW) have been considered as substrates to produce biobutanol. Efficiency of hydrolysis 4
techniques tested to produce fermentable sugars depended on nature of agro-industrial 5
wastes and process conditions. Acid-catalysed hydrolysis of BLW and BSG gave a total 6
reducing sugar yield of 0.433g/g and 0.468 g/g respectively. Reducing sugar yield from 7
microwave assisted hydrothermal method was 0.404 g/g from APS and 0.631 g/gfrom 8
APUS, and, 0.359 g/g from microwave assisted acid-catalysed SIW dry mass. Parameter 9
optimization (time, pH and substrate concentration) for acid-catalysed BLW hydrolysate 10
utilization using central composite model technique produced 307.9 g/kg glucose with 11
generation of inhibitors (5-hydroxymethyl furfural (20 g/kg), furfural (1.6 g/kg), levulinic 12
acid (9.3g/kg) and total phenolic compound (0.567 g/kg)). 10.62 g/L of acetone-butanol-13
ethanol was produced by subsequent clostridial fermentation of the substrate. 14
15
Keywords: Agro-industrial wastes; pre-treatment; microbial inhibitors; central composite
16
design; kinetic modelling; ABE fermentation. 17 18 19 20 21 22 23 24
3
1. Introduction
1
Increasing global energy demand, unstable and expensive petroleum resources, and 2
concern over global climate changes have boosted the development of renewable energy 3
sources, which, in turn, have driven scientific research towards the utilization of 4
lignocellulosic biomass resources as a renewable feedstock for the production of energy 5
and fuels. The demand for renewable resources to replace substantial amounts of non-6
renewable fossil fuels and minimize greenhouse gas (GHG) emissions largely rests on 7
most abundant renewable biomass (He & Zhang, 2011). However, fermentation substrate 8
has proven itself as one of the most important parameters influencing the final cost of 9
produced biofuels. In this context, liquid biofuel produced from lignocellulosic waste 10
biomasses could be a promising renewable energy source for a country with abundant 11
biomass resources, such as Canada. 12
Agro-based industries, especially apple processing industries, brewery industries, and 13
starch processing industries are experiencing a surge in their growth around the globe 14
(Dhillon et al., 2013). About 60–70 % of food and beverage processing industry residues 15
are discharged in the environment without any treatment and the reminder’s potential is 16
only tapped by means of anaerobic digestion (Maiti et al., 2016a). North America, one of 17
the largest agro-industrial waste producers (Canada is indeed the second overall supplier 18
of wood lignocellulosic biomass), retrieves only 20 % of the agro-industrial food wastes 19
for animal feed. The rest is used for landfilling, incineration or composting, which 20
contributes to about 10 % of the country’s greenhouse gas emissions (Nigam & Pandey, 21
2009). 22
4 The efficient reuse of the residues generated from such activities a major logistical, 1
financial and environmental issue. Due to their chemical properties, agro-industrial 2
biomass wastes have the potential to become an innovative carbon source, which could 3
be fermented to alcoholic compounds through environment friendly biochemical 4
methods. Amongst the possible biochemically produced alcohols, biobutanol has been 5
defined as a promising alternative due to its superior fuel properties as compared to 6
ethanol (Naik et al., 2010). 7
The conversion of complex biomass into biobutanol requires effective utilization of 8
C5 and C6 sugars present in hemicellulose, cellulose and starch, by processing these 9
fractions either together or individually after separation (Gürbüz et al., 2012). Most of the 10
naturally abundant clostridia are still not able to hydrolyse lignocellulosic based agro-11
industrial waste efficiently. The use of genetically modified strains has been suggested as 12
a possible alternative to the use of the clostridia, however, it would greatly increase the 13
final cost of biobutanol production, and has still not been implemented successfully in the 14
large scale production of biofuels. Since acetone-butanol-ethanol (ABE) fermentation is 15
naturally carried out by clostridial strains, an alternative solution to work with these 16
strains is based on the partial hydrolysis of recalcitrant lignocellulosic material present in 17
agro-industrial waste biomass to simple sugars in order to facilitate and increase the 18
efficiency of clostridial fermentation. 19
Hydrolysis can be achieved enzymatically or via physicochemical methods. 20
Enzymatic hydrolysis is considered an environmentally friendly process with broad 21
prospects in the conversion of lignocellulose to biofuel. However, information on the 22
optimal conditions of enzymatic hydrolysis in literature is limited. Commonly, product 23
5 inhibition, estimated running time etc. lead to addition of large amounts of expensive 1
commercial enzymes, which increases the biobutanol production cost and hinders its 2
commercialization (Wang & Chen, 2011). It has been reported that a highly selective and 3
efficient enzymatic hydrolysis can contribute up to 16-20 % of the total production cost 4
of butanol from lignocellulosic biomass (Montano, 2009). Additionally, enzymatic 5
hydrolysis at high total solids concentrations (an unavoidable prerequisite for many 6
feedstocks to achieve a large-scale production of biofuels, such as ethanol or butanol) 7
could lead to a decrease in substrate conversion, referred to as the “solids effect” (Puri et 8
al., 2013). 9
Physicochemical pre-treatment methods are less selective, and microbial inhibitors, 10
such as furan derivatives, weak acids, and phenolic compounds are also produced in 11
addition to the desired monosaccharaides (Maiti et al., 2016a). It has been reported that 12
these inhibitory compounds could have a significant detrimental effect on microbial 13
performance even at very low concentrations due to the synergistic inhibition effects 14
(Baral & Shah, 2014). 15
Since substrate cost has the highest influence on butanol price (Qureshi & Blaschek, 16
2000), this work focused on the use of inexpensive, renewable agro-industrial wastes for 17
the fermentative production of butanol using Clostridium beijerinckii. The potential use 18
of apple processing industry wastes, brewery industry wastes and starch industry 19
wastewater as the substrates for growth and butanol production by C. beijerinckii was 20
systematically investigated. Hence, the objectives of these studies were: (1) to investigate 21
the efficiency of different hydrolysis methods (namely chemical treatment, microwave 22
assisted treatment, nano spray-dryer particles catalysed treatment, mechanical treatment 23
6 and hydrothermolysis) to enhance fermentable sugar production; (2) to identify inhibitors 1
of butanol fermentation produced in agro-industrial wastes hydrolysates upon each 2
hydrolysis method; (3) to optimize different process parameters of acid hydrolysis for 3
using brewery industry liquid waste (BLW) as feedstock in order to increase the RSC 4
(reducing sugar compound) concentration minimizing the presence of any microbial 5
inhibitor; (4) to determine a kinetic model for the hydrolysis process; and (5) to ascertain 6
the ability of C. beijerinckii NRRL B-466 to utilize BLW hydrolysate as substrate for 7
ABE fermentation. 8
2. Materials and methods
9
2.1. Substrate selection and characterization
10
Brewery industry wastes (BLW and brewery spent grain (BSG)) used in the present
11
investigation were obtained from La Barberie (Quebec, Canada). Starch industry 12
wastewater (SIW) was obtained from ADM Ogilvic (Candiac, Quebec, Canada) and the 13
apple industry wastes (apple pomace sludge (APS), and apple pomace ultrafiltration 14
sludge (APUS)) were obtained from Lassonde Inc. (Rougemont, Montreal, Canada). 15
2.1.1. Brewery industry wastes 16
BSG is the waste resulting after the lautering process (separation of wort or mash 17
filtration). BLW mainly consist of residual substances from production (a complex 18
mixture of surplus yeast and plant residues, remaining fine spent grains and hops, etc.) 19
and leachates from the cleaning of fermentation and storage tanks, as well as vat and 20
bottle rinsing (Olajire, 2012). BLW has a high concentration of free RSCs, 21
polysaccharide plant residues and yeast proteins. 22
2.1.2. Apple industry wastes 23
7 Both APS and APUS are rich sources of carbohydrates, minerals, vitamins and dietary 1
fibres. Unlike the wastes from the brewery industry, apple pomace wastes had a higher 2
concentration of fructose. Cellulose was the main polysaccharide in APS, which implied 3
a higher concentration of aldohexoses in comparison with aldopentoses. No 4
hemicellulose was found in APUS sample. The pH of the waste suspension before 5
hydrolysis was lower (pH < 3.5) in comparison with other samples due to presence of 6
organic acids (Kosseva & Webb, 2013). 7
2.1.3. Starch processing wastes 8
The extraction of starch is accompanied many liquid and solid carbon-rich wastes. 9
Starch, an α 1-4 glycosidic linkage polysaccharide, is the energy reserve in plants, and it 10
is widely present in waste residues produced from the processing of plant raw materials. 11
Unlike cellulose (a β 1-4 glycosidic linkage polysaccharide), starch has been reported to 12
be more susceptible to partial and total hydrolysis (Martin, 2012). 13
Three of the feedstock (BLW, SIW and APUS) were received as suspension in water, 14
while BSG and APS were in solid state. The dry weight of all biomass has been 15
considered to compare the efficiency of the hydrolysis techniques under study. The 16
biomass was dried at 65 ± 1 °C for 72 h. 17
The presence of residual ethanol, which is reported as a microbial inhibitor (at a 18
concentration above 40 g/L) (Lee et al., 2008), is an additional challenge in concentrated 19
BLW samples for biobutanol production. The heating process carried out to dry the 20
samples allowed the reduction of original ethanol content below the inhibitory level. 21
Following this step, the dried BSG and APS was ground to particles of a smaller size (< 22
20 mm). The physicochemical characterization of the five agro-industrial wastes was 23
8 performed as given in Table 1. The measured values agree with values typically found in 1
literature (Dhillon et al., 2011; Olajire, 2012; Verma et al., 2007). The initial 2
concentration of free reducing sugars in APUS, APS and BLW was higher than that of 3
BSG and SIW. 4
2.2. Pre-treatment of waste biomass
5
The choice of hydrolysis treatment for pre-treatment of biomass and its severity 6
differed based on the heterogeneity and complexity of the substrate. In this study, the 7
following hydrolysis techniques were applied to carry out the required pre-treatment of 8
selected dried waste biomasses: 9
Chemical treatment 10
I. Brønsted acid catalysed hydrolysis (0.1 M H2SO4, pH~1.2 ± 0.2) at 121 ± 1°C for 40 11
min in autoclave (16 ± 0.2 psi). 12
II. H2O2 (30 v/v, 0.05 mL) catalysed acid hydrolysis (pH~3) at 121 ± 1°C for 40 min in 13
autoclave (16 ± 0.2 psi). 14
III. Alkali catalysed hydrolysis (1M NaOH, pH~10) at 121 ± 1ºC for 40 min in autoclave 15
(16 ± 0.2 psi). 16
Microwave assisted treatment 17
IV. Microwave-assisted (1000 W) Brønsted acid catalysed hydrolysis (0.1 M H2SO4, 18
pH~1.2 ± 0.2) at 121 ± 1°C for 25 min. 19
V. Microwave-assisted (1000 W) alkali catalysed hydrolysis (1 M NaOH, pH~10) at 121 20
± 1°C for 25 min. 21
Nano- spray dryer particle (NSPs) catalysed treatment 22
9 Ca and Fe NPs (Nanoparticles) were prepared by using a nanospray dryer B-90 (Buchi, 1
Switzerland). Solutions of 10 g/L CaCO3 and 100 g/L Fe(OAc)2 were prepared using 2
distilled water and fed to the nanospray dryer at the liquid flow level of 3 (nearly 20 3
mL/h) with a constant air flow rate of 120 L/min at 120 °C (Sarma et al., 2014). The 4
mesh hole size of the operating spray cap was about 4.0 mm. Nanoparticles were 5
collected from the internal surface of the collecting electrode using the manual particle 6
scraper and preserved in airtight glass container. 7
For the NPs catalyzed hydrolysis, the liquid was composed of water and (15±2.5) % of 8
NPs per gram of dry biomass sample was used (Zhang et al., 2011) under the following 9
conditions: 10
VI. Fe NPs catalysed hydrolysis (pH~3) at 121 ± 1 ºC for 40 min in autoclave (16 ± 0.2 11
psi). 12
VII. Ca NPs catalysed hydrolysis (pH~10) at 121 ± 1 ºC for 40 min in autoclave (16 ± 0.2 13
psi). 14
VIII. Both Ca and Fe NPs catalysed hydrolysis at 121±1ºC for 40 min in autoclave (16 ± 15
0.2 psi). 16
Before fermentation, Fe NPs were removed by magnetic filtration and Ca NPs were 17
removed by Ca3(PO4)2 precipitation (Zhang et al., 2011; Lee et al. 2014). 18
Mechanical treatment 19
IX. Ultra-sound assisted hydrolysis was carried out using an ultrasonication bath (Elma 20
Hans Schmidhauer GmbH & Co. KG, Singen, Germany) for 24 h (20–400 kHz) without 21
any pH adjustment. 22
Hydrothermolysis 23
10 X. H2O (pH~7) in autoclave (16 ± 0.2 psi).
1
XI. Microwave-assisted (1000 W) hydrolysis (H2O, pH~7) in autoclave (16 ± 0.2 psi). 2
H2SO4 was selected as Brønsted acid as it is less volatile, less corrosive to the 3
equipment and is economically more feasible (García Martín et al., 2013). The 4
combination of the substrate and pre-treatment method achieving the most promising 5
results during the pre-screening process was subsequently optimized by means of 6
response surface methodology (RSM) for hyper-production of reducing sugar compounds 7
(RSCs) and minimisation of inhibitory compounds (section 2.3). RSCs encompass total 8
reducing sugar (TRS), glucose, fructose, galactose and xylose, while inhibitors group 9
comprises furfural, 5-HMF (5-hydroxymethyl furfural), levulinic acid and total phenolic 10
compounds (TPCs). All these chemicals (vanillin, vanillic acid, feluric acid, furfural, 5-11
HMF, acetic acid, levulinic acid, syringaldehyde, glucose, xylose, galactose and fructose 12
were purchased from Sigma Aldrich (USA). All standards were of analytical grade. 13
2.2.3. Experimental design and RSCs production optimization through RSM
14
Central composite design was applied to optimize the production of RSCs and 15
minimize the release of inhibitory compounds (dependent variable) for a BLW sample 16
hydrolysed via Brønsted acid catalysis (selected combination), as a function of three 17
independent variables: reaction time, pH and feedstock concentration. Experimental 18
design construction made with the aid of Design-Expert®-7 software (Stat-Ease Inc., 19
Minneapolis, USA) resulted in a set of 20 experiments, comprising 3 central points and 20
three different code levels (low (-1), middle (0) and high (+1)) (Table 2). 21
11 A quadratic polynomial equation (Eq. 1) was proposed to interlink the effects of the 1
three independent variables on reducing sugars as well as different inhibitors production 2 as follows: 3
n i j j i ij n i n i i ii n i i i production X X Y X Y X YY Inhibitor sugar educing R 1 1 1 1 2 1 0 ) / ( (Eq.1) 4where (Reducing sugar/Inhibitor) production is the dependent variable; Yi and Yj are the 5
independent variables (n = 3 (time, pH and feedstock concentration)); X0 is the intercept 6
constant and Xi, Xii and Xij correspond to the regression coefficients. The same software 7
(Design-Expert®-7) employed for test-matrix design was used to check the experimental 8
responses obtained. An analysis of variance (ANOVA report) was performed to fit the 9
quadratic polynomial equations for the selected LA hyper-producing substrate(s). Final 10
values of code factors (time, pH, feedstock concentration, time∙pH, time∙feedstock 11
concentration, pH∙feedstock concentration, time2
, pH2, feedstock concentration2) were 12
considered to be statistically significant at p < 0.05. The quality of the model fit was 13
evaluated by the coefficient of determination (R2) and the adjusted coefficient of 14
determination (R2Adj). 15
2.3. Biobutanol production
16
2.3.1. Detoxification of agro-industrial waste hydrolysate
17
Detoxification of previously selected agro-industrial waste hydrolysate (BLW) was 18
carried out using a modified over-liming method (Martinez et al., 2001). The pH of the 19
hydrolysate was adjusted to 10 with Ca(OH)2 and kept at 30 °C for overnight. The 20
hydrolysate was mixed with 1 g/L Na2SO3 and the mixture was heated at 90 ± 1°C for 1 21
h. Subsequently, the precipitate of metal hydroxides was separated by centrifugation at 22
7650 x g (30 ± 1°C) for 30 min. Precipitate formed was discarded. The supernatant was 23
12 neutralized to pH 6.7 ± 0.1 with 1 M H2SO4 and centrifuged at 30 ± 1°C for 30 min at 1
7650 x g in order to separate the precipitate. The clear supernatant was used as a carbon 2
source to carry out the fermentation studies. 3
2.3.2. Microorganism and culture media
4
C. beijerinckii NRRL B-466, the microorganism selected for biobutanol production 5
purposes, was obtained from the Agricultural Research Station, USDA (USA). The 6
microorganism was grown and maintained in peptone-yeast extract-glucose (PYG) media 7
under anaerobic condition for 17 h at 35 ± 1°C and 150 rpm (Maiti et al., 2016b). The 8
medium (g/L) comprised: glucose (10); yeast extract (10); peptone (5); tryptone (5); 9
cysteine-HCl (0.5); K2HPO4 (2.04); KH2PO4 (0.04); FeSO4∙7H2O (1.1∙10-3
); CaCl2 10
(8×10⁻³); MgSO4∙7H2O (0.0192); NaCl (0.08); and NaHCO3 (0.4). Serum bottles of 125 11
mL with working volume of 50 mL were used as anaerobic batch reactors for both the 12
inoculum development and the butanol production (Maiti et al., 2016b). Anaerobic 13
conditions were maintained by sparging N2 for 10 minutes and the bottles were 14
immediately sealed by aluminium crimp seal containing silicone septum (Fisher scientific 15
Canada) by using a hand-operated crimping tool (E-Z CrimperTM, VWR, Ontario, 16
Canada). Prior to culture development, the medium was sterilized for 20 min at 121 ± 1 17
°C. About 10 % (v/v) (dry cell weight 35 mg/mL) of microbial culture in its exponential 18
phase of growth (OD600nm = 1.3-1.5) was used as inoculum for all the experiments 19
conducted in this investigation. 20
Chemicals such as glucose, urea, MgSO4∙7H2O, NaOH, FeSO4∙7H2O, CaCl2, cysteine-21
HCl, NaCl, NaHCO3, Ca(OH)2, Na2SO3, H2SO4HCl, n-butanol, acetone, acetic acid, 22
butyric acid, ethanol were purchased from Fisher Scientific (Ontario, Canada). Casein 23
13 peptone, tryptone, K2HPO4 and KH2PO4 were purchased from VWR (Ontario, Canada) 1
and the yeast extract was a kind gift from Lallemand, Canada. 2
2.3.3 Batch fermentation
3
Batch fermentation was performed in 125 mL serum vials (working volume 50 mL) at 4
pH 6.7 ± 0.1. As already described for inoculum development, the medium was sterilized 5
and anaerobic conditions were established. The fermentation was started by inoculating 6
C. beijerinckii 10% (v/v) (17 h in vegetative growth). All experiments were performed at 7
37 ± 1°C with shaking at 150 rpm for 72 h in triplicates (Maiti et al., 2015). 8
Fermentation experiments were carried out separately using modified P2 medium taking 9
following solutions: (1) 52 g/L of glucose as control sample; (2) Brønsted acid pre-10
treated BLW hydrolysate to check the simultaneous effect of total reducing sugars and 11
inhibitory compounds in butanol production; and (3) detoxified BLW hydrolysate to 12
attain the highest conversion efficiency of the BLW biomass to biobutanol. 13
Modified P2 media used in the present investigation was composed of different 14
ingredients (buffer: KH2PO4 50 g/L, K2HPO4 50 g/L, NH4CH3CO2 220 g/L; minerals: 15
MgSO4·7H2O 20 g/L, MnSO4·H2O 1 g/L, FeSO4·7H2O 1 g/L, NaCl 1 g/L; vitamins: 16
thiamin 0.1 g/L, biotin 0.001 g/L). Since brewery industry liquid wastes are already 17
enriched with yeast protein, neither peptone nor yeast protein were added to P2 media. 18
From each batch of fermentation, 1 mL of culture broth was harvested at definite 19
intervals (12h) and used for metabolite analysis. Data presented herein are average value 20
from duplicate runs for triplicate samples. 21
2.4. Analytical procedure
22
2.4.1 Reducing sugars and inhibitors analysis by LC/MS-MS method
14 Along with several reducing sugars (i.e., glucose, fructose, galactose and xylose), a 1
complex mixture of microbial inhibitors (i.e., furfural, 5-HMF, acetic acid, levulinic acid, 2
vanillin, vanillic acid, feluric acid and syringaldehyde) were also produced as a result of 3
the pre-treatment step carried out in section 2.1.2 to break down hemicellulose, cellulose 4
and starch present in agro-industrial wastes. To analyse different reducing sugars, 5
hydrolysate samples were collected at 10-15-minute intervals and analysed using Liquid 6
Chromatography-Mass Spectrometry (LC-MS) equipped with a 5µm, 150 mm ID, 4.6 7
mm df column where D6 glucose was used as internal standard. Likewise, previously 8
mentioned inhibitors produced during hydrolysis were analysed by Liquid-9
Chromatography-Tandem Mass Spectrometry (LC-TMS) (ZORBAX Carbohydrate, 10
Agilent Technologies, USA) equipped with a biobasic-18 column (5µm, 250 mm ID, 4.6 11
mm df) of Agilent Technologies (USA). Phenylethanol-D5 was used as internal standard 12
using samples collected in each 10-15 min interval. 13
Before injection for product analysis, samples were centrifuged for 5 minutes at 7650 14
x g and the supernatant was filtered by 0.45 µm syringe filter. Methanol:water (8:2, v/v) 15
and acetonitrile:water (8.5:1.5, v/v) were used to dilute the samples before analysing 16
inhibitors and carbohydrate (Maiti et al., 2016b). All data presented are average values 17
from duplicate runs for duplicate samples. Standard deviation for each data has been 18
calculated with respect to the average (mean) value from duplicate runs for duplicate 19
samples. 20
2.4.2 Carbohydrate analysis by standard DNSA (dinitrosalicylic acid) method
21
TRS concentration during the fermentation was determined by DNSA method using 22
glucose as the standard (Miller, 1959). The amount of TRS extracted from hydrolysed 23
15 samples was determined by UV-visible spectrophotometer (Cary-50, Varian) using 3,5-1
dinitrosalicylic acid as the reagent (DNS method) at 540 nm. 2
2.4.3 Metabolite measurements
3
ABE and additional metabolites (e.g., butyric acid, acetic acid) produced during 4
fermentation process were monitored by means of gas chromatography (GC7890B, 5
Agilent Technologies, USA) equipped with FID detector, along with a HP-INNOWax 6
column (30m, 0.25mm ID and 0.25µm df). The GC conditions comprised: helium carrier 7
gas at a flow rate of 1 mL/min with a temperature cycle (initial temperature 50 °C; 10 8
°C/min increase up to 150 °C; 20 °C/min increase up to 250 °C) for a total method run 9
time of 16 min. Before injection, the liquid samples were centrifuged for 5 min at 7650 x 10
g and the supernatant was filtered by 0.45 μm syringe filter. Isobutanol was used as the 11
internal standard (Maiti et al., 2015). Reducing sugar yield based on the dry weight of 12
raw material was calculated as (Eq. 2): 13 ) ( ) ( 100 (%) g substrate of Amount g produced sugar educing R x sugar reducing of Yield (Eq. 2) 14
3. Results and Discussion
15
3.1 Comparison of different hydrolysis techniques to produce fermentable sugar
16
compounds from agro-industrial wastes
17
3.1.1 Brewery industry wastes
18
Due to the lignocellulosic composition of the wastes, (in which outer lignin entirely 19
covers and bounds the inner polysaccharide content), Brønsted acid catalysed hydrolysis 20
was expected to be more promising over other employed techniques to significantly 21
reduce recalcitrant nature of brewery industry wastes. Solubilisation of hemicellulose is 22
favoured under low pH, as acidic conditions facilitate the breakdown of glycosidic bonds. 23
16 To enhance fermentable sugars, different hydrolysis techniques, such as chemical,
1
hydrothermal, mechanical and nanoparticle application have been employed. In the 2
current study, acid (0.1 M H2SO4) catalysed hydrolysis of BSG and BLW achieved a 3
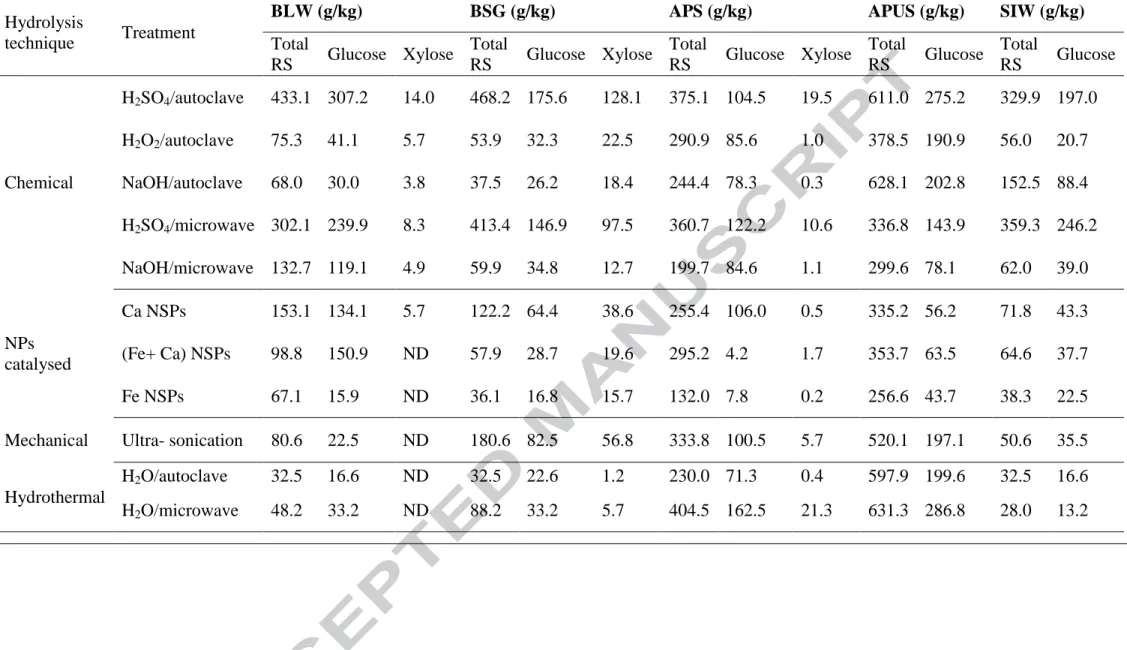
conversion of 0.468 g TRS/g and 0.433 g TRS /g of dry substrate, respectively (Table 4, 4
Figure 1). Moreover, higher abundance of aldohexoses in BLW hydrolysate (i.e., glucose 5
content), made it more promising for biofuel production compared to BSG. Other 6
hydrolysis treatments tested showed poor performance (Table 4, Figure 1). In comparison 7
to acid catalysed hydrolysis using autoclave, the microwave assisted acid hydrolysis 8
promoted the emergence of undesired side products (Figure 1). 9
Physical or chemical pre-treatment methods in combination with enzymatic hydrolysis 10
have been reported in literature. For example, Ravindran et al. reported a TRS yield of 11
0.228 g/g for BSG treated with microwave assisted alkali treatment followed by 12
enzymatic hydrolysis (Ravindran et al., 2017), and White et al. reported glucose yield of 13
0.278 g/g from BSG treated with dilute acid and enzyme (White et al., 2008). Though the 14
yield in these cases is more than that obtained in the current work (0.176 g/g), albeit the 15
use of enzymes would increase the cost of the pre-treatment process. As already 16
mentioned, authors preferred the utilization of acidic conditions rather than alkali 17
utilization. 18
3.1.2 Apple industry wastes
19
The degradation of cellulose (main polysaccharide in apple pomace wastes) is 20
described as an acid-catalysed and thermally accelerated chain scission mechanism. The 21
process consists of two steps, an initial fast hydrolysis of the more solvent accessible 22
amorphous region of cellulose, and a later, much slower hydrolytic attack on the 23
17 crystalline portion of cellulose (Hu & Ragauskas, 2012). The susceptibility of cellulose 1
over different pH ranges has been reported to be dissimilar and more efficient at lower 2
pH, when sugar monomer release from biomass is more effective over further conversion 3
of different side products (Hu & Ragauskas, 2012). Bearing this in mind, dilute acid 4
catalysed hydrolysis was expected to be more promising over other methods. 5
However, microwave assisted hydrothermal method proved to be more efficient, and 6
0.404 g TRS/g and 0.631 g TRS/g of dry substrate were obtained from APS and APUS 7
samples respectively, which resulted in a slight improvement of 3–7 % over acid 8
catalysed hydrolysis in autoclave (Table 4, Figure 1). Hydrothermolysis results reported 9
in the literature have been lower than those obtained with dilute acid or alkali catalysed 10
hydrolysis (Liu et al., 2015), but its use has been recommended based on the absence of a 11
catalyst (acid or base) and easier reactor maintenance due to low corrosion potential 12
(Alvira et al., 2010). NSPs catalysed hydrolysis, which was previously reported to be 13
successful in crystalline cellulose hydrolysis (Feng & Fang, 2013), was not effective in 14
this case (Table 4, Figure 1). Alkaline hydrolysis, a pre-treatment method typically used 15
in delignification processes to enhance the accessibility of cellulose to hydrolytic 16
enzymes (enzymatic hydrolysis) (Arreola-Vargas et al., 2015) also rendered good results 17
in APS and APUS (the samples with highest lignin content), resulting in 0.244 g TRS/g 18
and 0.628 g TRS/g, respectively. 19
3.1.3 Starch industry wastes
20
The assistance of microwave radiation improved the performance of Brønsted acid 21
catalysed hydrolysis by 9–24 % (0.359 g TRS/g and 0.246 g glucose/g vs 0.330 g TRS/g and 22
0.197 g glucose/g). The results obtained were more satisfying in comparison with previous 23
18 works. Srinorakutara et al. (2006) reported that acid (0.6 M H2SO4) catalysed hydrolysis 1
of starch industry waste (cassava waste) only produced about 0.122 g TRS/g (Srinorakutara 2
et al., 2006), while the TRS yield by acid hydrolysis was 0.122g/g for Sarchamo and 3
Rehmann, and 0. g g for Hernou - illi re et al ( archami & ehmann, 0 5 4
Hernou - illi re et al., 2013). 5
The production of fermentable sugars, and more specifically glucose, was observed to be 6
higher in starch and brewery industry wastes (Table 4). 7
3.2 Comparison of different hydrolysis techniques to produce microbial inhibitors
8
from five different agro-industrial wastes
9 10
prior to fermentation, a thorough 11
investigation on the capacity of the hydrolysis techniques under study to produce these 12
inhibitors is compulsory as its influence was reported to be very significant (Baral & 13
Shah, 2014). Inhibitors production pathway is based on cellulose and hemicellulose 14
hydrolysis to carbohydrates and subsequent 15 16 17 18 19 20 21 22 23 24
19 1 2 3 4 5 6 ~ 7 8 9 10 11 12 13 14 15
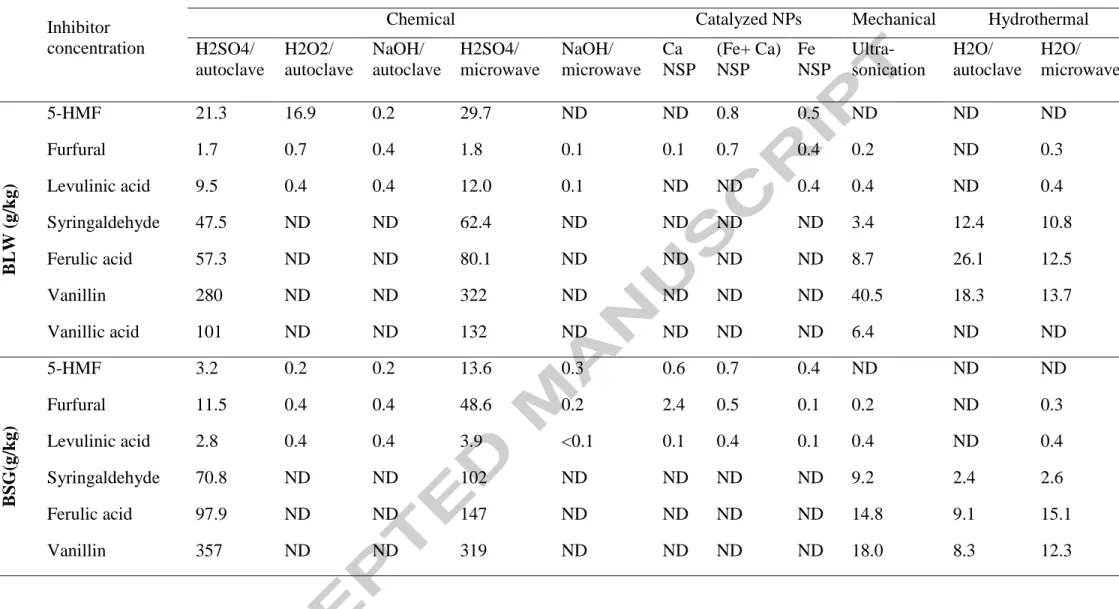
Presence of organic acids (e.g., acetic acid, formic acid and levulinic acid) in the 16
hydrolysate reduces the pH of the medium, causing plasma disruption, cell rupture and 17
termination of ABE fermentation (Wang & Chen, 2011). In the case of levulinic acid, the 18
inhibitory effects on microbial glucose consumption, cell growth and biofuel production 19
were not observed in the presence of less than 5 g/L (Lee et al., 2015). 20
Further transformation of furan derivatives and, to a lesser extent, reducing sugars led 21
to the formation of organic acids in acid catalysed hydrolysis. Therefore, the methods 22
producing higher amounts of 5-HMF and its sister chemical furfural, were also the main 23
generators of levulinic acid. Dilute acid catalysed thermal hydrolysis (with or without 24
20 assistance of microwave radiation) method was the main responsible of levulinic acid 1
production (76–92 % of the total inhibitor concentration) in all cases. 2
3.2.3 Phenolic compounds
3
In contrast to furan derivatives and organic acids, very low concentrations of phenolic 4
compounds have been associated with disruption of ABE fermentation. Mechanism of 5
inhibition of phenolic compounds has been based on their partitioning into biological 6
membranes with the subsequent loss of membrane integrity (Maiti et al., 2016a). 7
Hydrolysis of lignin can produce phenolic compounds. Since lignin is more susceptible to 8
low pH values, alkaline treatments were discarded as they could be a source of phenolic 9
compounds (Table 5). Again, dilute acid catalysed thermal hydrolysis produced the 10
highest concentrations of inhibitors, vanillin being the most abundant compound in all 11
feedstocks. Vanillin has been considered the strongest inhibitor amongst typical phenolic 12
compounds, such as syringaldehyde or hydroxybenzoic acid (Li et al., 2014), so its 13
elimination or detoxification for efficient fermentation was compulsory, as it is 14
demonstrated in section 3.5. Unlike other wastes, phenolic inhibitors were not detected in 15
SIW, due to its structural composition (Table 5). 16
Therefore, even if achieving the maximum production of easily fermentable sugars is 17
the goal, in fermentative butanol synthesis, the formation of unintended by-products 18
(microbial inhibitors) in an unavoidable outcome during these pre-treatments that must 19
not be neglected. Efficiency of each pre-treatment is marked by both factors. A brief 20
summary of efficiencies of different pre-treatment process has been illustrated in Figure 1 21
(TRS vs By-products). It has been observed that the best process condition for the release 22
of higher concentration of easily fermentable sugars and lower by-products were different 23
21 for each industrial waste biomass. Thus, release of easily fermentable sugars as well as 1
by-products typically depended on both nature of the substrate and pre-treatment process. 2
Based on the initial characterization of the for agro-industrial wastes, BLW was 3
selected as an optimal substrate due to its high initial concentration of RSCs. This, 4
coupled with the greater availability of BLW over other feedstocks, converted this waste 5
in the most promising substrate for biobutanol production purposes. In addition, BLW 6
was already enriched with yeast protein and other essential micronutrients, and presented 7
higher total solids concentration in comparison with other valid options, such as SIW 8
(Table 1). In this case, dilute acid hydrolysis gave the highest conversion of TRS/g dry 9
substrate as compared to the other methods. However, acid hydrolysis pre-treatment was 10
also shown to produce higher concentrations of microbial inhibitors (such as phenolics), 11
and therefore, RSM was used to optimize parameters to enhance TRS concentration and 12
reduce inhibitor concentration for acid hydrolysis of BLW. 13
3.3 Optimization of process parameters to enhance fermentable sugar production
14
from BLW using RSM
15
The ranges of the variables investigated and responses of the previously selected 16
substrate samples in terms of TRS and inhibitors production are given in Table 3. Results 17
of central composite design which consists of experimental data for studying the effect of 18
three independent variables (reaction time, pH, feedstock concentration) on fermentable 19
sugar production and inhibitory compounds generation when dilute acid hydrolysis was 20
applied to a BLW sample have been presented. The data was fitted in a quadratic 21
polynomial equation for all the desired and undesired compounds and the analysis of 22
variance described in Table 6 indicated that the model was significant (p < 0.005) in all 23
22 cases. Corresponding equations to predict fermentable sugars production and inhibitors 1
production using BLW (Eq. 3-10) in terms of code factors were as follows: 2 Fermentable sugars: 3 ) 05 . 312 07 . 0 08 . 0 04 . 0 35 . 0 3 10 73 . 9 24 . 306 95 . 5 81 . 7 74 . 89 ( 2 2 2 pH Time Con pH Time pH Con Time Con pH Time Con TSR 4 (Eq. 3) 5 ) 92 . 197 08 . 0 11 . 0 27 . 0 63 . 0 02 . 0 33 . 230 88 . 6 28 . 9 98 . 85 ( cos 2 2 2 pH Time Con pH Time pH Con Time Con pH Time Con e Glu 6 (Eq. 4) 7 ) 05 . 20 3 10 54 . 5 3 10 11 . 9 03 . 0 06 . 0 4 10 49 . 2 22 . 21 49 . 0 69 . 0 84 . 4 ( 2 2 2 pH Time Con pH Time pH Con Time Con pH Time Con Galactose 8 (Eq. 5) 9 ) 88 . 24 01 . 0 011 . 0 01 . 0 20 . 0 3 10 02 . 1 18 . 20 10 . 1 75 . 0 55 . 13 ( 2 2 2 pH Time Con pH Time pH Con Time Con pH Time Con Xylose 10 (Eq. 6) 11 Inhibitors: 12 13 ) 90 . 8 3 10 90 . 1 3 10 19 . 1 25 . 0 41 . 0 3 10 09 . 6 69 . 24 38 . 0 86 . 0 82 . 64 ( 5 2 2 2 pH Time Con pH Time pH Con Time Con pH Time Con HMF 14 (Eq. 7) 15 ) 54 . 1 4 10 03 . 6 5 10 14 . 5 01 . 0 03 . 0 4 10 19 . 1 11 . 5 29 . 0 05 . 0 20 . 3 ( 2 2 2 pH Time Con pH Time pH Con Time Con pH Time Con Furfural 16 (Eq. 8) 17 ) 25 . 10 5 10 58 . 9 3 10 98 . 5 15 . 0 06 . 0 3 10 26 . 1 86 . 4 25 . 0 57 . 0 13 . 20 ( 2 2 2 pH Time Con pH Time pH Con Time Con pH Time Con acid Levulinic 18 (Eq. 9) 19 ) 68 . 117 08 . 0 75 . 0 56 . 4 93 . 34 15 . 0 98 . 2112 99 . 22 66 . 106 05 . 3822 ( 2 2 2 pH Time Con pH Time pH Con Time Con pH Time Con TPC 20 (Eq.10) 21 22
The goodness of the model adjusted for the range of variables posed was checked by 23
the determination coefficient (R2). In both models, R2 values higher than 0.85 indicated 24
23 that 85% variations in fermentable sugars production can be well explained by the model 1
(Table 6). 2
BLW hydrolysis using 40 g substrate/L, pH of 0.76 and 40 min produced the maximum 3
amount of reducing sugar compounds (TRS, glucose, galactose and xylose), a parameter-4
combination quite interesting compared to literature reports, since an elevated substrate 5
concentration has been linked to a decreasing reaction rate due to inhibition processes by 6
other compounds, such as sugar-derived inhibitors, insufficient mixing (mass transfer 7
limitations) or other effects related to the increased content of insoluble solids 8
(Kristensen et al., 2009). Even if maintaining high substrate concentrations throughout 9
the hydrolysis and subsequent conversion process from biomass to biobutanol is 10
important for the energy balance and economic viability of biobutanol production, most 11
of the hydrolysis processes of different feedstocks utilize comparatively lower substrate 12
concentrations as shown in Table 5. In this case, a lower substrate concentration favoured 13
the conversion of reducing sugar compounds into inhibitors. This effect could be 14
reinforced by the accumulation of free reducing sugar compounds already present in the 15
untreated (not hydrolysed) biomass (Table 1). Glucose represented the 84% of the total 16
BLW-derived carbohydrates - a promising result considering that glucose is the preferred 17
carbon source for clostridia cultures (Sarchami & Rehmann, 2015). 18
Besides, an increase in time from 40 to 60 min or more led to lowering of RSC 19
concentration as the hydrolysis process had enough time to reach the activation energy to 20
produce further unwanted by-products, especially TPC and levulinic acid. The synthesis 21
of latter inhibitor also benefited from precursors, such as 5-HMF and furfural (Morone et 22
24 al., 2015), which suffered a drop in their concentration above 20 and 40 min,
1
respectively. 2
3.4 Kinetic modelling of acid catalysed hydrolysis of BLW
3
The models proposed in literature to explain dilute acid hydrolysis are generally based 4
on pseudo homogeneous irreversible first-order reactions, such as eaman’s model and 5
two-fraction model (Aguilar et al., 2002). These models can be generalized as in Eq. 11: 6
Substrate (S) k1 Product (P) k2 Decomposition byproducts (Eq. 11) 7
where k1 is the rate of the generation reaction and k2 is the rate of the decomposition 8
reaction (min-1). Solving the differential equations, TRS concentration can be predicted 9 through Eq. 12: 10 2 ( 1 2 ) 1 2 1 0 0 t k t k t k e e k k k S e x P P
( eaman’s model) (Eq. 12)
11
where S and P are concentrations of substrate (BLW) and product (TRS) expressed in 12
g/L, t is time (min) and subscript 0 indicates initial conditions. It can be inferred that 13
larger the value of k1, the higher the rate of TRS formed and the lower the process time 14
required for maximizing production yield. On the contrary, the higher the value of k2, the 15
greater the rate of inhibitor production. Two-fraction model goes forward one more step 16
and distinguishes between readily reacting lignocellulosic biomass fraction and not 17
reaction susceptible fraction. The ratio between them is the parameter α (g g) and Eq. 18
is modified as follows (Eq. 13): 19 2 ( 1 2 ) 1 2 1 0 0 t k t k t k e e k k k S e x P P
(Two-fraction model) (Eq. 13)
20
Once optimal conditions have been established in this study to obtain the maximum 21
amount of RSC with the lowest concentration of inhibitors, it is interesting to compare 22
25 the results obtained with commonly applied kinetic methods useful for economical
1
estimations in order to check the validity of the results (Lenihan et al., 2011). In our case, 2
Eq. 13 was used to fit the data by means of non-linear regression analyses and values of 3
0.031 min-1, 0.014 min-1 and 0.60 g/g were achieved for k1, k2 and α, respectively. The 4
most desirable operating conditions will result in a high value of k1 and a low value of k2. 5
Comparing the values of k1 and k2, it can be observed that the kinetic coefficient of the 6
TRS formation is 2.2-fold higher than that of the degradation reaction. The value of k1 is 7
in accordance with the previously reported values (Aguilar et al., 2002; Jiang et al., 2012; 8
Sarkar & Aikat, 2012). Nevertheless, the relatively high k2 value confirms the significant 9
influence of the time factor, which confirms that beyond the optimized value (40 min), 10
accumulation of degradation by-products could happen. About 60% of the substrate was 11
susceptible to dilute acid hydrolysis, which is in the common range for lignocellulosic 12
feedstock (Aguilar et al., 2002). 13
3.5 Biobutanol and ABE production using BLW as substrate
14
Once operational variables of pre-treatment stage were evaluated and optimized by 15
means of RSM, this section focused on the production of biobutanol by C. beijerinckii 16
NRRL B-466 using BLW as raw material. Butanol fermentation by clostridia is 17
characterized by synthesis of butanol along with by-products acetone and ethanol in the 18
ratio 6:3:1. In control batch fermentation, using modified P2 medium containing 52 g/L 19
glucose solution, C. beijerinckii NRRL B-466 produced 14.46 g/L of ABE in 72 h 20
(Figure 2A). In this run, ABE yield reached 0.41 g ABE/g glucose (74% of the glucose was 21
efficiently utilized) and productivity was 0.15 g/L. 22
26 In the second batch experiment, the efficacy of the strain to exploit the nutrient and 1
free RSC content (52 g/L) present in the raw BLW hydrolysate was studied. Batch 2
fermentation of undetoxified BLW performed in P2 media resulted in no ABE 3
production. Although the residual sugar concentration was high enough for solventogenic 4
phase development, the presence of different microbial inhibitors within the hydrolysate 5
solution (furfural 0.64 g/L, 5-HMF 1.12 g/L, levulinic acid 0.24 g/L, acetic acid 1.56 g/L 6
and total phenolic compounds 0.31 g/L) prevented the transformation of intermediate 7
products in butanol. 8
Clostridial strains have the ability to metabolize low concentration of inhibitors, such 9
as furfural or 5-HMF, improving ABE fermentation in terms of cell concentration and 10
solvents production (Gao & Rehmann, 2016). However, synergistic detrimental effect of 11
weak acids, furan derivatives and phenolic compounds have been reported to either halt 12
or slow down reaction rates of the fermentation (Jönsson et al., 2013). Thus, an extra 13
detoxification step was required to achieve successful fermentation. 14
Detoxification by the modified over-liming method gave a sugar reduction of less than 15
10%. Using detoxified BLW hydrolysate for ABE fermentation (Figure 2B), an ABE 16
yield of 0.30 g ABE/g glucose was produced by C. beijerinckii NRRL B-466, resulting in a 17
total ABE concentration of 10.6 g/L, which means that the culture performed much better 18
than it did in the previous test. The TRS concentration reduced from 52.9 ± 0.8 g/kg to 19
15.4 ± 0.1 g/kg. The results obtained are consistent with those reported by other authors. 20
Zhang et al. (2012) observed that sugar utilization ratio increased by 27 % when whether 21
corncob residue hydrolysate was detoxified with Ca(OH)2 (Zhang et al., 2012a). 22
Similarly, Liu et al. (2015) increased butanol formation from 0.4 g/L to 5.5 g/L when the 23
27 pH of switchgrass hydrolysate was adjusted to 6 and 4 g/L of CaCO3 were added prior to 1
fermentation stage (Liu et al., 2015). 2
4. Conclusion
3
This study demonstrated that hydrolytic pre-treatment enhanced production of 4
fermentable sugars from complex biomass. However, increased production of microbial 5
inhibitors counter balanced biobutanol production potential. Hydrolysis pre-treatment 6
step makes detoxification process another unavoidable necessity to enhance biobutanol 7
production, increasing biofuel production cost. In any case, the ability to produce high 8
value industrial solvents, such as ABE, from the inexpensive agro-industrial wastes could 9
have positive effects on bioenergy production as well as on waste management, uplifting 10
the agribusiness and employment in agro-industrial sector. 11
E-supplementary data of this work can be found in online version of the paper 12
Acknowledgements
13
This work was supported by the Natural Sciences and Engineering Research Council of 14
Canada (NSERC, Discovery Grant), MAPAQ (No. 809051), Ministère des Relations 15
Internationales du Québec (coopération Paraná-Québec 2010–2012; Quebec-Vietnam 16
2012-2015) and the Centre de Recherche Industrielle du Québec (CRIQ). 17 18 19 References 20 21
1. Aguilar, R., Ramırez, J., Garrote, G., Vázquez, M. 2002. Kinetic study of the acid 22
hydrolysis of sugar cane bagasse. Journal of Food Engineering, 55(4), 309-318. 23
2. Alvira, P., Tomás-Pejó, E., Ballesteros, M., Negro, M. 2010. Pretreatment technologies 24
for an efficient bioethanol production process based on enzymatic hydrolysis: a review. 25
Bioresource technology, 101(13), 4851-4861. 26
3. Arreola-Vargas, J., Razo-Flores, E., Celis, L.B., Alatriste-Mondragón, F. 2015. Sequential 27
hydrolysis of oat straw and hydrogen production from hydrolysates: role of hydrolysates 28
constituents. International Journal of Hydrogen Energy, 40(34), 10756-10765. 29
28 4. Assary, R.S., Kim, T., Low, J.J., Greeley, J., Curtiss, L.A. 2012. Glucose and fructose to 1
platform chemicals: understanding the thermodynamic landscapes of acid-catalysed 2
reactions using high-level ab initio methods. Physical Chemistry Chemical Physics, 3
14(48), 16603-16611.
4
5. Baral, N.R., Shah, A. 2014. Microbial inhibitors: formation and effects on acetone-5
butanol-ethanol fermentation of lignocellulosic biomass. Applied microbiology and 6
biotechnology, 98(22), 9151-9172. 7
6. Dhillon, G.S., Brar, S.K., Verma, M., Tyagi, R.D. 2011. Utilization of different agro-8
industrial wastes for sustainable bioproduction of citric acid by Aspergillus niger. 9
Biochemical Engineering Journal, 54(2), 83-92. 10
7. Dhillon, G.S., Kaur, S., Brar, S.K. 2013. Perspective of apple processing wastes as low-11
cost substrates for bioproduction of high value products: A review. Renewable and 12
Sustainable Energy Reviews, 27, 789-805. 13
8. Enslow, K.R., Bell, A.T. 2012. The kinetics of Brønsted acid-catalyzed hydrolysis of 14
hemicellulose dissolved in 1-ethyl-3-methylimidazolium chloride. RSC Advances, 2(26), 15
10028-10036. 16
9. Ezeji, T., Qureshi, N., Blaschek, H.P. 2007. Butanol production from agricultural 17
residues: impact of degradation products on Clostridium beijerinckii growth and butanol 18
fermentation. Biotechnology and bioengineering, 97(6), 1460-1469. 19
10. Feng, G., Fang, Z. 2013. Solid-and nano-catalysts pretreatment and hydrolysis 20
techniques. in: Pretreatment Techniques for Biofuels and Biorefineries, Springer, pp. 21
339-366. 22
11. Gao, K., Rehmann, L. 2016. Combined Detoxification and In-situ Product Removal by 23
a Single Resin During Lignocellulosic Butanol Production. Scientific Reports, 6. 24
12. García Martín, J.F., Sánchez, S., Cuevas, M. 2013. Evaluation of the effect of the 25
dilute acid hydrolysis on sugars release from olive prunings. Renewable Energy, 51, 382-26
387. 27
13. Gürbüz, E.I., Wettstein, S.G., Dumesic, J.A. 2012. Conversion of hemicellulose to 28
furfural and levulinic acid using biphasic reactors with alkylphenol solvents. 29
ChemSusChem, 5(2), 383-387. 30
14. He, J., Zhang, W. 2011. Techno-economic evaluation of thermo-chemical biomass-to-31
ethanol. Applied Energy, 88(4), 1224-1232. 32
15. ernou -Villi re, A., assi, ., u, ., aquet, A., Rinaldi, ., ra o o, G., Molina-33
oisseau, ., Marais, M.- ., que, J.-M. 2013. Simultaneous microwave/ultrasound-34
assisted hydrolysis of starch-based industrial waste into reducing sugars. ACS 35
Sustainable Chemistry & Engineering, 1(8), 995-1002. 36
16. Hu, F., Ragauskas, A. 2012. Pretreatment and lignocellulosic chemistry. Bioenergy 37
Research, 5(4), 1043-1066. 38
17. Jiang, C.W., Bai, C.C., Xiao, H. 2012. Hydrolysis Kinetics of Straw Biomass Catalyzed 39
by Diluted Sulphuric Acid in the Present of Fe2+. Advanced Materials Research. Trans 40
Tech Publ. pp. 484-487. 41
18. Jönsson, L.J., Alriksson, B., Nilvebrant, N.-O. 2013. Bioconversion of lignocellulose: 42
inhibitors and detoxification. Biotechnology for Biofuels, 6(1), 1. 43
29 19. Kosseva, M., Webb, C. 2013. Food industry wastes: assessment and recuperation of 1
commodities. Academic Press. 2
20. Kristensen, J.B., Felby, C., Jørgensen, H. 2009. Yield-determining factors in high-3
solids enzymatic hydrolysis of lignocellulose. Biotechnology for Biofuels, 2(1), 1. 4
21. Lee, H., Hamid, S., Zain, S. 2014. Conversion of lignocellulosic biomass to 5
nanocellulose: structure and chemical process. The Scientific World Journal, 2014. 6
22. Lee, S.J., Lee, J.H., Yang, X., Kim, S.B., Lee, J.H., Yoo, H.Y., Park, C., Kim, S.W. 2015. 7
Phenolic compounds: Strong inhibitors derived from lignocellulosic hydrolysate for 2, 8
3‐butanediol production by Enterobacter aerogenes. Biotechnology journal, 10(12), 9
1920-1928. 10
23. Lee, S.Y., Park, J.H., Jang, S.H., Nielsen, L.K., Kim, J., Jung, K.S. 2008. Fermentative 11
butanol production by Clostridia. Biotechnology and bioengineering, 101(2), 209-228. 12
24. Lenihan, P., Orozco, A., Mangwandi, C., Rooney, D., O'Neill, E., Walker, G., Ahmad, 13
M. 2011. Kinetic modelling of dilute acid hydrolysis of lignocellulosic biomass. INTECH 14
Open Access Publisher. 15
25. Li, Y., Qi, B., Wan, Y. 2014. Inhibitory effect of vanillin on cellulase activity in 16
hydrolysis of cellulosic biomass. Bioresource technology, 167, 324-330. 17
26. Liu, K., Atiyeh, H.K., Pardo-Planas, O., Ezeji, T.C., Ujor, V., Overton, J.C., Berning, K., 18
Wilkins, M.R., Tanner, R.S. 2015. Butanol production from hydrothermolysis-pretreated 19
switchgrass: Quantification of inhibitors and detoxification of hydrolyzate. Bioresource 20
technology, 189, 292-301. 21
27. Maiti, S., Gallastegui, G., Sarma, S.J., Brar, S.K., Le Bihan, Y., Drogui, P., Buelna, G., 22
Verma, M. 2016a. A re-look at the biochemical strategies to enhance butanol 23
production. Biomass and Bioenergy, 94, 187-200. 24
28. Maiti, S., Sarma, S.J., Brar, S.K., Le Bihan, Y., Drogui, P., Buelna, G., Verma, M. 2016b. 25
Agro-industrial wastes as feedstock for sustainable bio-production of butanol by 26
Clostridium beijerinckii. Food and Bioproducts Processing, 98, 217-226. 27
29. Maiti, S., Sarma, S.J., Brar, S.K., Le Bihan, Y., Drogui, P., Buelna, G., Verma, M., 28
Soccol, C.R. 2015. Novel spectrophotometric method for detection and estimation of 29
butanol in acetone–butanol–ethanol fermenter. Talanta, 141, 116-121. 30
30. Martin, A.M. 2012. Bioconversion of waste materials to industrial products. Springer 31
Science & Business Media. 32
31. Martinez, A., Rodriguez, M.E., Wells, M.L., York, S.W., Preston, J.F., Ingram, L.O. 33
2001. Detoxification of dilute acid hydrolysates of lignocellulose with lime. 34
Biotechnology progress, 17(2), 287-293. 35
32. Miller, G.L. 1959. Use of dinitrosalicylic acid reagent for determination of reducing 36
sugar. Analytical chemistry, 31(3), 426-428. 37
33. Montano, D. 2009. Process design and evaluation of butanol production from 38
lignocellulosic biomass. Energy research Centre of the Netherlands ECN. 39
34. Morone, A., Apte, M., Pandey, R. 2015. Levulinic acid production from renewable 40
waste resources: Bottlenecks, potential remedies, advancements and applications. 41
Renewable and Sustainable Energy Reviews, 51, 548-565. 42
30 35. Naik, S.N., Goud, V.V., Rout, P.K., Dalai, A.K. 2010. Production of first and second 1
generation biofuels: a comprehensive review. Renewable and Sustainable Energy 2
Reviews, 14(2), 578-597. 3
36. Nigam, P.S.-N., Pandey, A. 2009. Biotechnology for agro-industrial residues 4
utilisation: utilisation of agro-residues. Springer Science & Business Media. 5
37. Olajire, A.A. 2012. The brewing industry and environmental challenges. Journal of 6
cleaner production. 7
38. Palmqvist, E., Hahn-Hägerdal, B. 2000. Fermentation of lignocellulosic hydrolysates. 8
II: inhibitors and mechanisms of inhibition. Bioresource Technology, 74(1), 25-33. 9
39. Puri, D.J., Heaven, S., Banks, C.J. 2013. Improving the performance of enzymes in 10
hydrolysis of high solids paper pulp derived from MSW. Biotechnology for biofuels, 6(1), 11
1. 12
40. Qureshi, N., Blaschek, H. 2000. Economics of butanol fermentation using hyper-13
butanol producing Clostridium beijerinckii BA101. Food and bioproducts processing, 14
78(3), 139-144.
15
41. Ravindran, R., Jaiswal, S., Abu-Ghannam, N., Jaiswal, A.K. 2017. A comparative 16
analysis of pretreatment strategies on the properties and hydrolysis of brewers’ spent 17
grain. Bioresource Technology. 18
42. Rosa, R., Ponzoni, C., Leonelli, C. 2014. Direct energy supply to the reaction mixture 19
during microwave-assisted hydrothermal and combustion synthesis of inorganic 20
materials. Inorganics, 2(2), 191-210. 21
43. Sarchami, T., Rehmann, L. 2015. Optimizing Acid Hydrolysis of Jerusalem Artichoke-22
Derived Inulin for Fermentative Butanol Production. BioEnergy Research, 8(3), 1148-23
1157. 24
44. Sarkar, N., Aikat, K. 2012. Kinetic study of acid hydrolysis of rice straw. ISRN 25
biotechnology, 2013. 26
45. Sarma, S.J., Das, R.K., Brar, S.K., Le Bihan, Y., Buelna, G., Verma, M., Soccol, C.R. 27
2014. Application of magnesium sulfate and its nanoparticles for enhanced lipid 28
production by mixotrophic cultivation of algae using biodiesel waste. Energy, 78, 16-22. 29
46. Srinorakutara, T., Kaewvimol, L., Saengow, L.-a. 2006. Approach of cassava waste 30
pretreatments for fuel ethanol production in Thailand. J. Sci. Res. Chula. Univ, 31(1), 77-31
84. 32
47. Verma, M., Brar, S.K., Tyagi, R., Surampalli, R., Valéro, J. 2007. Starch industry 33
wastewater as a substrate for antagonist, Trichoderma viride production. Bioresource 34
technology, 98(11), 2154-2162. 35
48. Wang, L., Chen, H. 2011. Increased fermentability of enzymatically hydrolyzed 36
steam-exploded corn stover for butanol production by removal of fermentation 37
inhibitors. Process biochemistry, 46(2), 604-607. 38
49. White, J.S., Yohannan, B.K., Walker, G.M. 2008. Bioconversion of brewer's spent 39
grains to bioethanol. FEMS Yeast Research, 8(7), 1175-1184. 40
50. Zhang, F., Deng, X., Fang, Z., Zeng, H., Tian, X., Kozinski, J. 2011. Hydrolysis of 41
microcrystalline cellulose over Zn-Ca-Fe oxide catalyst. Petrochemical Technology, 40(1), 42
43-48. 43
31 51. Zhang, W., Liu, Z., Liu, Z., Li, F. 2012a. Butanol production from corncob residue 1
using Clostridium beijerinckii NCIMB 8052. Letters in applied microbiology, 55(3), 240-2
246. 3
52. Zhang, Y., Han, B., Ezeji, T.C. 2012b. Biotransformation of furfural and 5-4
hydroxymethyl furfural (HMF) by Clostridium acetobutylicum ATCC 824 during butanol 5
fermentation. New biotechnology, 29(3), 345-351. 6 7 8 9 10 11 12 13 14 15 16 17 18 19 20 21 22 23 24 25 26 27 28 29 30 31 32 33 34 35 Figure captions 36 37
Figure 1. Effect of different pre-treatments on total reducing sugars (TRS) and
by-38
products formation from different agro industrial wastes such as BLW: brewery industry 39
liquid waste, BSG: brewery spent grain, APS: apple pomace solid waste, APUS: apple 40
pomace ultrafiltration sludge, SIW: starch industry wastewater where I : 41
H2SO4/autoclave, II : H2O2/autoclave, III : NaOH/autoclave, IV: H2SO4/microwave, V : 42
NaOH/ microwave, VI : Ca NSPs, VII : (Fe+ Ca) NSPs, VIII : Fe NSPs, IX : Ultra- 43
sonication, X : H2O/autoclave, XI : H2O/microwave. 44
32 1
Figure 2 ABE production in P2 media with 52 g/L of glucose (control sample) (A), and a
2
detoxified BLW hydrolysate sample (B) by means of C. beijerinckii NRRL B-466. No 3
ABE production was observed in the raw (undetoxified) BLW hydrolysate sample. 4 5 6 7 8 9 10 11 12 13 14 15 16 17 18 19 20 21 22 23 24 25 26 27 28 29 30 31 32 Tables 33
Table 1. Physicochemical characterization of agro-industrial wastes.
Components
Brewery Industry waste Apple Industry waste
BSG Surplus yeast Spent hops APS APUS SIW
pH 5.2 ± 0.1 5.4 ± 0.1 5.1 ± 0.1 3.2 ± 0.1 3.4 ± 0.1 3.3 ± 0.2
33 1 2 3 4 5
Table 2. Central composite design ranges of the three variables considered for present
6
investigation. 7
Serial number
Variable Coded levels
-α Low Middle High +α
1 Concentration (g/L) 6.36 20 40 60 73.64
Ash content (%) 7.79 ± 0.65 8.9 ± 1.3 - 4.71 ± 0.53 2.55 ± 0.78 3.55 ± 0.94
Extractive (%) 3.53 ± 0.42 5.7 ± 0.6 - 3.12 ± 0.78 2.85 ± 0.23 1.24 ± 0.74
Carbohydrates (dry weight) (%) - 36.4 ± 1.5 40.0 ± 0.5 66.0 ± 1.7 56.2 ± 1.3 -
Crude fiber (%) - 3.0 ± 1.5 26.5 ± 2.4 33.45 ± 3.4 - -
Cellulose (dry weight) (%) 17.1 ± 1.0 - 13.2 ± 1.3 11.8 ± 1.8 -
Hemicellulose (dry weight) (%) 32.5 ± 1.5 - 0.8 ± 0.1 - -
Lignin (dry weight) (%) 13.4 ± 1.9 - 23.5 ± 2.1 20.6 ± 2.6 -
Free reducing sugar (g/kg) 22.7 ± 5.3 102.8 ± 4.7 - 155.1 ± 2.1 175.4 ± 5.9 21.6 ± 1.0
Glucose (g/kg) 1.6 ± 0.1 55.8 ± 1.3 - 35.5 ± 1.0 40.4 ± 1.8 1.25 ± 0.1
Fructose (g/kg) - - - 32.7 ± 1.7 30.7 ± 2.7 -
Galactose (g/kg) - 5.9 ± 0.9 - 3.9 ± 0.7 - -
34 2 Time (min) 16.3 20 40 60 73.64 3 pH 0.02 0.32 0.76 1.20 1.80 1 2 3 4 5 6 7 8 9 10 11 12
35 1
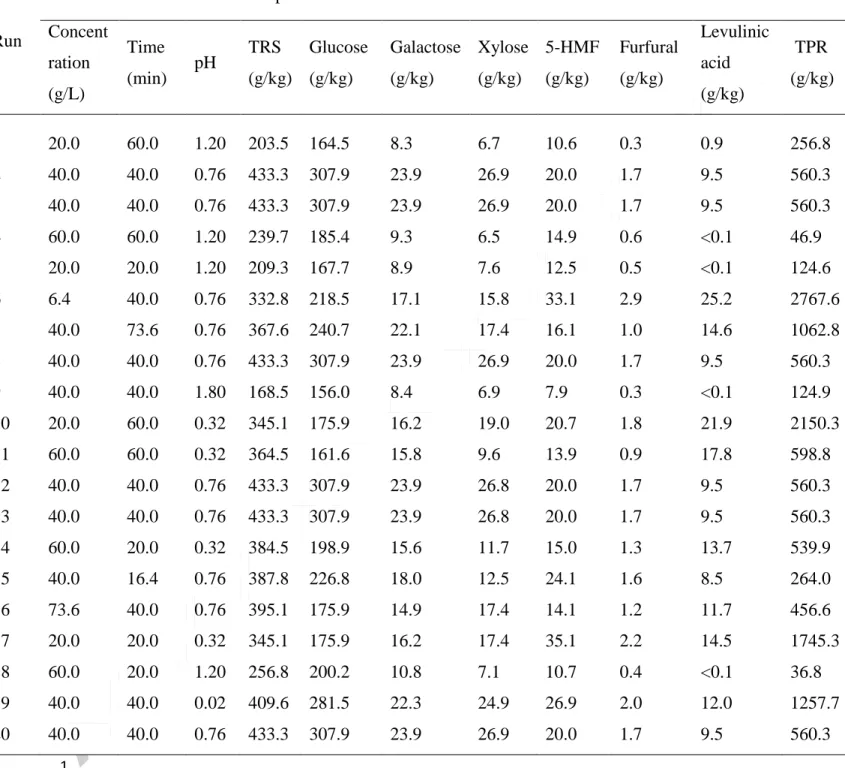
Table 3. Experimental design and the responses obtained for parameter optimisation for dilute acid hydrolysis for
BLW substrate Run Variables Response Concent ration (g/L) Time (min) pH TRS (g/kg) Glucose (g/kg) Galactose (g/kg) Xylose (g/kg) 5-HMF (g/kg) Furfural (g/kg) Levulinic acid (g/kg) TPR (g/kg) 1 20.0 60.0 1.20 203.5 164.5 8.3 6.7 10.6 0.3 0.9 256.8 2 40.0 40.0 0.76 433.3 307.9 23.9 26.9 20.0 1.7 9.5 560.3 3 40.0 40.0 0.76 433.3 307.9 23.9 26.9 20.0 1.7 9.5 560.3 4 60.0 60.0 1.20 239.7 185.4 9.3 6.5 14.9 0.6 <0.1 46.9 5 20.0 20.0 1.20 209.3 167.7 8.9 7.6 12.5 0.5 <0.1 124.6 6 6.4 40.0 0.76 332.8 218.5 17.1 15.8 33.1 2.9 25.2 2767.6 7 40.0 73.6 0.76 367.6 240.7 22.1 17.4 16.1 1.0 14.6 1062.8 8 40.0 40.0 0.76 433.3 307.9 23.9 26.9 20.0 1.7 9.5 560.3 9 40.0 40.0 1.80 168.5 156.0 8.4 6.9 7.9 0.3 <0.1 124.9 10 20.0 60.0 0.32 345.1 175.9 16.2 19.0 20.7 1.8 21.9 2150.3 11 60.0 60.0 0.32 364.5 161.6 15.8 9.6 13.9 0.9 17.8 598.8 12 40.0 40.0 0.76 433.3 307.9 23.9 26.8 20.0 1.7 9.5 560.3 13 40.0 40.0 0.76 433.3 307.9 23.9 26.8 20.0 1.7 9.5 560.3 14 60.0 20.0 0.32 384.5 198.9 15.6 11.7 15.0 1.3 13.7 539.9 15 40.0 16.4 0.76 387.8 226.8 18.0 12.5 24.1 1.6 8.5 264.0 16 73.6 40.0 0.76 395.1 175.9 14.9 17.4 14.1 1.2 11.7 456.6 17 20.0 20.0 0.32 345.1 175.9 16.2 17.4 35.1 2.2 14.5 1745.3 18 60.0 20.0 1.20 256.8 200.2 10.8 7.1 10.7 0.4 <0.1 36.8 19 40.0 40.0 0.02 409.6 281.5 22.3 24.9 26.9 2.0 12.0 1257.7 20 40.0 40.0 0.76 433.3 307.9 23.9 26.9 20.0 1.7 9.5 560.3
36
Table 4. Influence of hydrolysis technique on fermentable RS production from agro-industrial wastes
Hydrolysis
technique Treatment
BLW (g/kg) BSG (g/kg) APS (g/kg) APUS (g/kg) SIW (g/kg)
Total RS Glucose Xylose Total RS Glucose Xylose Total RS Glucose Xylose Total RS Glucose Total RS Glucose Chemical H2SO4/autoclave 433.1 307.2 14.0 468.2 175.6 128.1 375.1 104.5 19.5 611.0 275.2 329.9 197.0 H2O2/autoclave 75.3 41.1 5.7 53.9 32.3 22.5 290.9 85.6 1.0 378.5 190.9 56.0 20.7 NaOH/autoclave 68.0 30.0 3.8 37.5 26.2 18.4 244.4 78.3 0.3 628.1 202.8 152.5 88.4 H2SO4/microwave 302.1 239.9 8.3 413.4 146.9 97.5 360.7 122.2 10.6 336.8 143.9 359.3 246.2 NaOH/microwave 132.7 119.1 4.9 59.9 34.8 12.7 199.7 84.6 1.1 299.6 78.1 62.0 39.0 NPs catalysed Ca NSPs 153.1 134.1 5.7 122.2 64.4 38.6 255.4 106.0 0.5 335.2 56.2 71.8 43.3 (Fe+ Ca) NSPs 98.8 150.9 ND 57.9 28.7 19.6 295.2 4.2 1.7 353.7 63.5 64.6 37.7 Fe NSPs 67.1 15.9 ND 36.1 16.8 15.7 132.0 7.8 0.2 256.6 43.7 38.3 22.5 Mechanical Ultra- sonication 80.6 22.5 ND 180.6 82.5 56.8 333.8 100.5 5.7 520.1 197.1 50.6 35.5
Hydrothermal
H2O/autoclave 32.5 16.6 ND 32.5 22.6 1.2 230.0 71.3 0.4 597.9 199.6 32.5 16.6 H2O/microwave 48.2 33.2 ND 88.2 33.2 5.7 404.5 162.5 21.3 631.3 286.8 28.0 13.2