HAL Id: tel-01342179
https://tel.archives-ouvertes.fr/tel-01342179
Submitted on 5 Jul 2016HAL is a multi-disciplinary open access
archive for the deposit and dissemination of sci-entific research documents, whether they are pub-lished or not. The documents may come from teaching and research institutions in France or abroad, or from public or private research centers.
L’archive ouverte pluridisciplinaire HAL, est destinée au dépôt et à la diffusion de documents scientifiques de niveau recherche, publiés ou non, émanant des établissements d’enseignement et de recherche français ou étrangers, des laboratoires publics ou privés.
applications en information quantique
Karmel de Oliveira Lima
To cite this version:
Karmel de Oliveira Lima. Nanocristaux dopés par des ions terres rares pour des applications en information quantique. Materials Science [condmat.mtrlsci]. Université Pierre et Marie Curie -Paris VI, 2015. English. �NNT : 2015PA066611�. �tel-01342179�
Université Pierre et Marie Curie
Ecole doctorale Physique et Chimie des Matériaux
Spécialité : Sciences des Matériaux
Nanocristaux dopés par des ions terres rares pour des
applications en information quantique
Par Karmel de Oliveira Lima
Thèse de doctorat
Dirigée par Philippe Goldner
Présentée et soutenue publiquement le 17 décembre 2015
Devant un jury composé de :
M. Philippe Goldner, Directeur de Recherche, Directeur de thèse
M. Thierry Gacoin, Directeur de Recherche, Rapporteur
M. Gilles Ledoux, Chargé de Recherche, Rapporteur
M. Stefan Kröll, Professeur, Examinateur
Mme. Agnès Maître, Professeur, Examinateur
Mme. Signe Seidelin, Maître de Conférences, Examinateur
M. Alban Ferrier, Maître de Conférences, Membre invité
1 Introduction 1
1.1 Quantum information processing (QIP) . . . 1
1.2 Main requirements for QIP . . . 4
Dynamical interactions . . . 6
1.3 Motivation to work at the nanoscale . . . 6
1.4 Thesis goals . . . 7
2 High resolution and coherent spectroscopy of Eu3+:Y2O3 materials 9 2.1 Rare earth doped materials . . . 9
2.1.1 Rare earth ions . . . 10
2.1.2 The free-ion Hamiltonian . . . 12
2.1.3 The crystal field . . . 13
2.1.4 Intensities of rare-earth optical transitions . . . 16
2.2 The host studied in this work: yttrium oxide (Y2O3 ) . . . . 17
2.3 Eu3+:Y2O3 materials . . . 19
2.4 State of the art of Eu3+:Y 2O3 bulk and nanocrystals . . . 21
2.5 Conclusions . . . 23
3 Synthesis and Structural Characterization 25 3.1 Synthesis of Eu3+:Y 2O3 particles . . . 27
3.2 Characterization techniques . . . 28
3.3 Structural characterization: Eu3+:Y(OH)CO 3 . . . 28
3.3.1 Mechanism of particle formation . . . 28
3.3.1.1 E↵ect of aging time . . . 30
3.3.1.2 E↵ect of reactional temperature . . . 33
3.3.1.3 E↵ect of metal concentration . . . 34
3.3.1.4 E↵ect of urea concentration . . . 35
3.3.1.5 E↵ect of Eu3+ concentration . . . 37
3.4 Structural characterization: Eu3+:Y 2O3 . . . 39
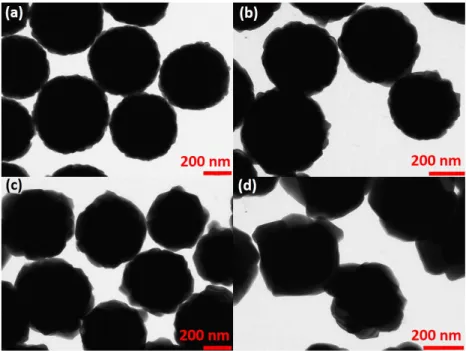
3.4.1 E↵ect of annealing time . . . 43
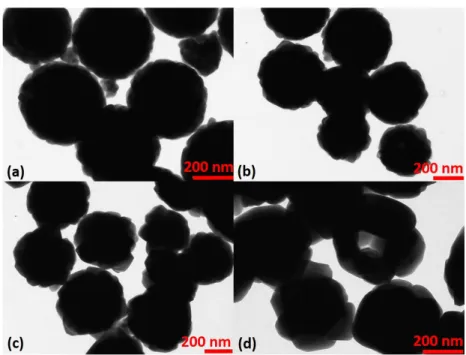
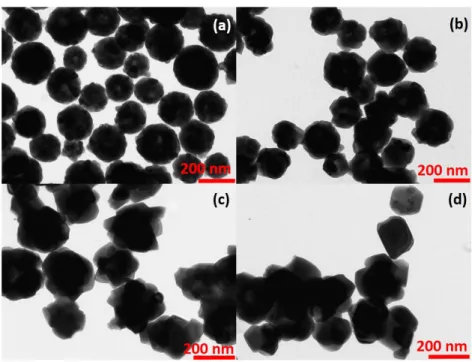
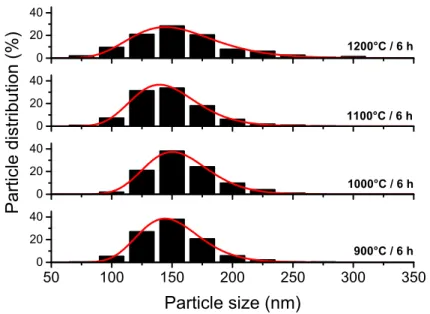
3.4.2 E↵ect of annealing temperature . . . 45
3.4.3 E↵ect of Eu3+ concentration . . . 51 i
3.4.4 Crystallite size estimation of Eu3+:Y2O3 particles . . 53
3.4.4.1 Crystallite size estimation as a function of [Eu3+] . . . 58
3.5 Conclusion . . . 60
4 Inhomogeneous linewidths and Raman spectroscopy 63 4.1 Characterization Techniques . . . 65
4.1.1 Optical inhomogeneous linewidth measurements . . . 66
4.1.2 Raman spectroscopy measurements . . . 67
4.1.3 Electron paramagnetic resonance (EPR) . . . 68
4.2 Optical inhomogeneous linewidths . . . 68
4.2.1 E↵ect of particle and grain sizes . . . 68
4.2.2 E↵ect of annealing time for thermal treatments at 1200 C . . . 75
4.2.3 E↵ect of Eu3+ concentration . . . 77
4.3 Raman spectroscopy . . . 80
4.3.1 E↵ect of particle and grain sizes . . . 82
4.3.2 E↵ect of Eu3+ concentration . . . 86
4.4 Electron Paramagnetic Resonance (EPR) . . . 90
4.5 Conclusion . . . 93
5 Emission spectroscopy 95 5.1 Characterization Techniques . . . 96
5.2 Fluorescence spectroscopy . . . 96
5.2.1 Emission spectra under excitation of the 7F0!5D2 transition . . . 97
5.2.2 Emission spectra under excitation of the 7F 0!5D0 transition . . . 101
5.2.3 Emission spectra of Eu3+:Y2O3 single particle under excitation at 7F 0 ! 5D1 . . . 102
5.2.4 Emission spectra under excitation in the ultraviolet . 105 5.3 Excited state lifetimes . . . 107
5.3.1 Decay lifetimes of the 5D 0 excited level . . . 107
5.3.2 Decay lifetimes of the 5D 2 excited level . . . 117
5.3.3 Nd3+:Y 2O3 particles . . . 118
5.4 Conclusions . . . 123
6 Homogeneous linewidths and spectral hole lifetimes 125 6.1 Experimental setup . . . 130
6.1.1 Photon echo sequences . . . 132
6.1.2 Two-pulse photon echoes (2PPE) . . . 132
6.1.3 Three-pulse photon echo (3PPE) . . . 134
6.1.4.1 Measurements on Eu3+:Y2O3particle
ensem-ble . . . 136
6.1.4.2 Measurements on small aggregates of Eu3+:Y 2O3 particles . . . 136
6.2 Spectroscopy of 0.5 % Eu3+:Y2O3 sample . . . 138
6.2.1 0.5 % Eu3+:Y 2O3 sample . . . 138
6.2.2 Two-pulse photon echo . . . 139
6.2.3 Temperature dependence . . . 142
6.2.4 Three-pulse photon echo . . . 143
6.2.5 Holeburning . . . 146
6.2.6 Hole burning on small Eu3+:Y2O3 aggregates . . . 149
6.3 E↵ect of material parameters . . . 151
6.3.1 Particle size . . . 151
6.3.2 Calcination temperature . . . 153
6.3.3 Time of annealing . . . 153
6.4 Conclusion . . . 155
Introduction
Contents
1.1 Quantum information processing (QIP) . . . 1
1.2 Main requirements for QIP . . . 4
1.3 Motivation to work at the nanoscale . . . 6
1.4 Thesis goals . . . 7
1.1
Quantum information processing (QIP)
Technology has made extraordinary progresses concerning communication speed and capacity, data storage, or processing power, and most of the fun-damental concepts of information science were established in the beginning of the twentieth century [1]. In the 80s new kinds of algorithms based on quantum theory appeared [2, 3], which started the quantum information processing (QIP) field. In this same period Feynman proposed quantum simulators for the efficient simulation of quantum systems [4].
Quantum information is a new paradigm, where the classical bits, which can take only discrete values, are substituted by quantum bits, called qubits, which can assume any superposition state [1].
Figure 1.1: Schematic representation of a classical bit which can either be a ”0” or a ”1” (left), and a qubit (right). A qubit in a superposition state| i is represented by
an ellipsoid between states|0i and |1i, and the position of the vector corresponding
to | i is represented by a 3D sphere, called the ”Bloch Sphere”. Figure adapted
from [1].
This new resource enables data processing, storage and communication in ways impossible to achieve with classical systems [5, 6]. Important ap-plications of QIP are quantum computing and simulations [7–9], which aim at out-performing classical computers for some specific calculations. This is based on the application of quantum logical gates to an ensemble of qubits. Another important application of QIP is quantum communication, which mainly uses photons to transmit qubits between remote places. This can be used to connect quantum computers and build a quantum network [5], or to achieve unprecedented security with quantum cryptography [10].
QIP uses superposition states, which exist for a significant duration time only in isolated systems. Interactions with a fluctuating environment, with many degrees of freedom, destroy them. Quantum systems which are useful in QIP are for example photons, which can have very low interactions with surrounded electromagnetic fields and atoms [11, 12].
Several other systems have also been investigated for QIP such as trapped ions, superconductors, electronic and nuclear spins in insulators and ultra-cold atoms [13–17].
As light is an excellent carrier of quantum information there is also a need to interface it to material systems to store and process information [18]. Among several promising materials in QIP, rare-earth (RE) doped crystals have attracted interest because of the specific spectroscopic properties of their non bonding 4f electrons [19]. The 4-f orbitals are shielded by closed shells that isolate them from environment fluctuations. As a result, at cryo-genic temperatures RE doped crystals can o↵er narrow optical transitions, which is equivalent to long-lived superposition states [20].
As an example, Er3+:Y2SiO5 crystal presents an ultra narrow optical line
down to 50 Hz under magnetic field [19], which is the narrowest optical transition reported for any solid. Several other RE doped crystals show
linewidths in the range of a few kHz [20]. In this work, we will study Eu3+:Y2O3 which can also show very narrow lines of about 600 Hz [21–24].
In addition, several RE ions, including Eu3+, have isotopes with non-zero
nuclear spins which can show even longer superposition state lifetimes. In this case, the qubit can be defined as a nuclear spin transition. Quantum states can be transferred between optical and hyperfine transitions using three level ⇤-systems (see Figure 1.2). Here two hyperfine ground states are coupled to the same excited state. The hyperfine transitions can be then controlled by optical pulses. Another possibility is to map an optical quan-tum state onto nuclear spins state to obtain a quanquan-tum memory.
Figure 1.2: Schematic representation of a ⇤-system. The information to store is carried by the !ab field while the control field is applied between|bi and |ci levels.
The excitation of the system via the two optical fields permit to transfer the optical coherence to the ground-state atomic system.
The ⇤-system presented in Figure 1.2 exhibit 3 energy levels: two ground-state hyperfine levels|ai and |ci, connected to the excited state |bi through optical excitations !1 and !2. The signal to store is absorbed on the
opti-cal transition |ai!|bi creating an optical coherence between the two levels. A second optical field !2 is then applied and this transfer the population
from the state |bi to state |ci and transforms the optical coherence in spin coherence. The stored photon can be re-emitted by applying a control field which is able to give an optical signal exactly identical to the initial one. Since RE can o↵er optical transitions with optical and nuclear spin coher-ence lifetimes in the 0.1-1 ms and 1-10 ms ranges respectively [1], they are particularly suited for such quantum light-matter interfaces. Finally, several RE optical transitions exhibit large ratios of inhomogeneous to homogeneous optical linewidths, which allow for example selective addressing of ions [25]
and large bandwidth quantum storage [26].
These outstanding properties have lead to many results in the field of QIP. Quantum memories, for example, have been investigated in several bulk crystals such as Eu3+:Y2SiO5 [27, 28], Pr:Y2SiO5 [29–32] or Pr:La2(WO4)3
[33]. In Nd3+:Y2SiO5 single crystals, entanglement storage and quantum
state teleportation have also been obtained [34, 35], while coherent storage of microwave excitation in nuclear spins has been demonstrated in the same material [36]. Moreover, techniques to further extend spin T2 have been
studied [37–40], enabling quantum states to be preserved up to 6 hours [41]. Taking advantage of electric dipole-dipole interactions to implement condi-tional gates [25], Longdell et al. have demonstrated a quantum phase gate in a Eu3+:Y
2SiO5 crystal [42]. Arbitrary qubit state rotations were also
carried out in Pr:Y2SiO5 crystals [43].
Recently, rare-earth doped transparent polycrystalline ceramics of Eu3+:Y2O3
[44, 45], as well as Eu3+:Y
2O3 nanocrystals [46] have also been proposed for
QIP applications, and quantum storage has been obtained in Er doped fibers [47].
1.2
Main requirements for QIP
The most important requirements to develop materials for quantum infor-mation applications is to obtain long lived superposition states. This lifetime is called the coherence lifetime (T2) and is inversely proportional to the
ho-mogeneous linewidth h: h= 1/ ⇡T2. When several centers are considered,
an inhomogeneous broadening may also be significant [48]. In the study of linewidths in solids is also a crucial tool to obtain informations about static and dynamic interactions between the environment and the active absorbing ion. Figure 1.3 shows both homogeneous and inhomogeneous linewidth in absorption lines.
Figure 1.3: Inhomogeneous and homogeneous linewidths in an absorption line.
In general, we can refer to homogeneously broadened lines each time that all the centers responsible for the resonance line give the same contribution in terms of the peak frequency and width. On the other side, it is possible to identify a line as inhomogeneously broadened if the resonant centers have a distribution in the peak frequency and their widths are usually similar but appreciably less that the width of the distribution of peak frequencies. In crystals, this is often observed for RE transitions which have small coupling to phonons and at low temperature. To better understand the di↵erence in the nature of these absorption lines, we can refer to atoms in their gas phase. Each isolated atom experiences an optical transition involving a change in the electronic state when excited: at the right frequency, the atom will ab-sorb the energy and passes in an excited state. In principle, no broadening in the transition line should be observed, but since the states involved in the transition have a finite lifetime the line will be broadened. Since the tran-sition frequency is anyway always the same for each ion, this is referred to as homogeneous broadening. If we consider atoms moving randomly, their transition frequencies (homogeneously broadened) will be measured in the laboratory as shifted because of the Doppler e↵ect. The resulting lineshape of the ensemble of ions will now be broadened, or better saying inhomo-geneously broadened, because of the di↵erent contributions to the line at di↵erent frequencies. The distinction is based on the assumption that the di↵erence between homogeneous or inhomogeneous broadenings can be re-lated to the experiment timescale in a way that if the feature that originates the broadening is dynamical (during the measurement) its contribution will be homogeneous; in the other case, if the feature is seen as static during the measurement timescale then it will contribute to the inhomogeneous
linewidth. In rare-earth doped crystals, the distinction between the broad-ening processes can also be related to the static or the dynamical interactions between the optically active ion and its environment. The RE ions have spe-cific positions, however the frequency distribution arise from variations in the environment. Depending on the timescale of the experiment relative to the timescale of the interaction process, the line is identified as inhomoge-neous or homogeinhomoge-neous [49, 50].
The investigation of inhomogeneous linewidth in RE nanostructured parti-cles as a function of several experimental parameters, is performed by high resolution spectroscopy and is described in Chapter 4. For evaluation of ho-mogeneous linewidths of RE materials, techniques which use the coherence properties (time domain) and those taking advantage of the long spin lattice relaxation times (frequency domain) can be used [51]. Then, homogeneous linewidths were performed by photon echo (time domain) and hole burning (frequency domain) experiments and the discussion is presented in Chapter 6.
Dynamical interactions
As discussed previously, homogeneous linewidth is an important parameter for quantum information processing because this linewidth is related to sev-eral dynamical contributions. For RE ion in a crystalline bulk matrix, it is possible to explicit the di↵erent dynamical contributions for the homoge-neous broadening as follows
h = pop+ ion ion+ ion spin+ ion lattice+ phonon (1.1)
which pop is the contribution from the excited-state population lifetime
(T1), ion ion is the instantaneous spectral di↵usion (ISD) contribution
from modifications in the local environment due to the optical excitation or population relaxation of other ions, ion spin is the contribution due to
nuclear- and electron-spin fluctuations of the host lattice. ion latticeis the
contribution due to dynamic fluctuations in nearly equivalent local lattice configurations, and phonon includes contributions from phonon scattering.
These dynamical interactions which contributes to the homogeneous broad-ening of absorption lines are described in details in Chapter 6.
1.3
Motivation to work at the nanoscale
Nanotechnology has a wide academic and industrial interest as it involves the creation and development of materials with structural features in between
those of atoms and bulk [52]. Several studies have shown that materials with nanoscale grain sizes exhibit di↵erent optical, electrical, catalytic, mechan-ical and vibrational properties compared to conventional microcrystalline systems [53, 54]. The ability to enhance properties may lead to potentially useful technological applications of nanocrystalline oxides such as batteries, gas sensors, fuel cells, biosensors, etc [53, 55–57].
Promising results have been reported in quantum information processing for nitrogen-vacancy (NV) centers in diamond nanocrystals. These NV centers in diamond can show long room temperature spin dephasing times using single electron spins [58], form hybrid systems coupling to a nanomechani-cal oscillator [59] and also be applied as sensor for nanosnanomechani-cale imaging [60]. In addition quantum dot coupled to a photonic crystal nanocavity systems have presented interesting results for QIP due to the strong coupling regime of cavity quantum electrodynamics [61].
Although bulk RE single crystals are very promising materials in the QIP field, as already mentioned above, important limitations are present in the context of hybrid systems, as it is difficult to obtain strong interactions at the macroscopic scale. As an alternative, RE nano- micro- structured mate-rials could be used. A first possibility is the top down method, which designs nanostructured materials from the break of bulk material into smaller pieces using mechanical, chemical or other form of energy. The most common way is by milling, which however can introduce some defects in the material and in turn a↵ect the optical properties of RE materials. For example, Utikal and coauthors have found a homogeneous linewidth around 3 MHz for sin-gle Pr3+ in YSO nanocrystals, whereas the Pr3+:YSO bulk crystal exhibits
3 kHz linewidth [62]. The authors attributed this significant homogeneous broadening to the large amount of defects from grinding of single crystals. The second option to get materials at the nanoscale is the bottom-up routes, which synthesize materials from atomic or molecular species via chemical re-actions, allowing for the precursor particles to grow in size.
Nanostructured RE crystals with long coherence lifetimes could be used to build efficient quantum light-matter interfaces, using optical micro-cavities [63]. Another potential application is the design of hybrid quantum systems, in which RE ions are coupled to other centers [64, 65].
1.4
Thesis goals
The, first goal of this work is the synthesis and optimization of Eu3+:Y2O3
nanostructured particles in order to obtain dispersed particles with high crystalline quality and long optical coherence lifetime.
In this field, mainly bulk crystals have been considered so far, in applica-tions where a long T2 time is needed. Due to the large interest on RE bulk
the investigations of coherence properties of RE nanoscale materials. Pioneer work, reported by Meltzer and coauthors, on small RE nanocrys-tals have indicated that the homogeneous linewidths, of few nanometer nanocrystals, are several order of magnitude larger than optical linewidth of RE bulk crystals [66, 67]. Recently our group has demonstrated that RE doped nanocrystals of intermediate size present homogeneous linewidth in the range of sub MHz [46].
Then, the second goal is focused on the study of several nanostructured particles prepared under di↵erent reactional and post-reactional conditions aiming to understand which are the main static and dynamical contributions which limit coherence properties at the nanoscale.
This work is organized as follows. Chapter 2 presents the general prop-erties of rare-earth-doped materials exploring the features of Eu3+ and Y2O3 host. Eu3+:Y2O3 crystals and particles are also described.
Synthe-sis and structural characterization of Eu3+:Y
2O3 particles are detailed in
Chapter 3 where conditions to obtain optimal quality samples are also dis-cussed. Chapter 4 is devoted to the study of the inhomogeneous linewidth by high resolution spectroscopy in samples prepared varying reactional and post-reactional parameters. Raman spectroscopy and electron paramag-netic resonance (EPR) results are also reported. Emission spectroscopy for Eu3+:Y
2O3 and Nd3+:Y2O3 particles is presented in Chapter 5.
Ho-mogeneous linewidths and spectral hole lifetimes obtained using di↵erent techniques are discussed in Chapter 6.
High resolution and coherent
spectroscopy of Eu
3+
:Y
2
O
3
materials
Contents
2.1 Rare earth doped materials . . . 9
2.1.1 Rare earth ions . . . 10
2.1.2 The free-ion Hamiltonian . . . 12
2.1.3 The crystal field . . . 13
2.1.4 Intensities of rare-earth optical transitions . . . 16
2.2 The host studied in this work: yttrium oxide (Y2O3 ) . . . 17
2.3 Eu3+:Y2O3 materials . . . 19
2.4 State of the art of Eu3+:Y 2O3bulk and nanocrys-tals . . . 21
2.5 Conclusions . . . 23
2.1
Rare earth doped materials
The wide range of transition energies exhibited by rare-earth ions makes them very attractive in several fields. From first applications in laser de-velopments during the 1960s (Nd3+:Y3Al5O12mostly), their use in research
or in everyday life is wide and various today. From medical applications (Ce3+:Lu2SiO5scintillators) to luminophors (Eu3+:Y2O3, Cex:Tby:La1 x y
(PO4)3 or Eu2+:Ba1 xMgAl10O17) for LCD screens, they are used for their
intense emissions going from the UV to the IR. More recently, erbium-doped materials have been widely used as fiber amplifiers for developing optical
communication networks. The main characteristic which makes rare-earth ions so attractive for quantum information is related to their spectroscopic features: they can exhibit at low temperature narrow homogeneous opti-cal transitions with high absorption coefficients and long coherence times [50, 68]. Moreover, their hyperfine transitions can also show long coherence lifetimes [30, 37].
2.1.1 Rare earth ions
The lanthanide series is formed by 15 di↵erent atomic elements going from lanthanum (Z=57) to lutetium (Z=71) in the periodic table. Often, yttrium and scandium are added to the series to form the general family of the ”rare-earth” ions1 (see Figure 2.1).
Figure 2.1: Periodic table of elements with the lanthanide series (in color) as well as yttrium and scandium to form the rare-earth ions.
The electronic structure of triply-ionized lanthanide ions is the same than that of xenon plus n 4f electrons. Hence, the
1s2 2s2 2p6 3s2 3p6 4s2 3d10 4p6 5s2 4d10 5p6 6s2 4fn
The electronic structure then di↵ers only for the number of 4f electrons (with n going from 1 to 14): the external structure given by 5p and 6s configurations is the same for all the elements.
1The name of rare-earths is historical but not so true in reality. In the eighteen century,
these ”earthy” elements were found just in Sweden. Actually, except for promethium, their abundance is comparable, or even larger than other elements that are not considered rares (ten times more than lead, for example).
Figure 2.2: Calculated (Hartree-Fock) radial distribution functions of 4f, 5s, 5p,
6s orbitals in Gd3+ as a function of the distance from the nucleus [69]. From the
figure, 4f electrons are shielded by higher orbital electrons because of their weak spatial extension.
Looking at Figure 2.2, which shows the radial distribution of external orbitals in gadolinium ions, one can notice that 4f orbitals have a limited radial extension and 5s, 5p and 6s orbitals act like a shield, preventing 4f electrons from feeling the environment. In this way, all the RE ions possess almost the same physical and chemical characteristics and this is the reason for their special classification in the periodic table. Because of this low inter-action with the environment surrounding the ion, the physical description of rare-earths is closer to that of free atoms in a gas than to atoms interacting in a solid [70].
A distinction need to be made between intra- and inter-configuration tran-sitions. In the first case, spectral lines for 4f!4f transitions are narrow and their position as a function of the wavelength is nearly independent on the ion environment (the influence of the crystal field is small on the 4f elec-trons). In the second case, 4f!5d transitions are much broader and the host strongly influences their energy (5d electrons are much more sensitive to the external environment).
The most common oxidation degree shown by rare-earth elements is triva-lent, which usually corresponds to the loss of the most external electrons, leaving ions just with filled shells and 4f ions. Nevertheless, certain ions may exist in their divalent state (Eu2+, Yb2+) or even tetravalent state (Ce4+
proper-ties, this work will focus on trivalent ions and in particular on Eu3+. In the following, before passing to the choice and the description of the candidate material for quantum applications, it is worthy to briefly remind the dif-ferent interactions present in rare-earth ions and their particular properties which make these elements so interesting.
The f-electrons and nuclei of the rare-earth ions in a crystal are described by the following approximated Hamiltonian:
H = [H0+ HC+ HSO+ H ] + [HHF + HZ+ HQ+ Hz] (2.1)
All the terms in the expression 2.1 take into account the di↵erent interac-tions of the rare-earth ion in a crystal and completely describe their energy level structure. In particular, the first group of terms in the brackets, that is much bigger than the second group, is composed by the free-ion Hamilto-nian (H0+HC+HSO) and the crystal-field Hamiltonian (H ). We will discuss
these terms in next sections; for a given [Xe]4fn configuration they
deter-mine the electronic energy levels. The second group of Hamiltonians in the brackets consists respectively of the hyperfine interaction (HHF), the
electronic Zeeman interaction (HZ), the quadrupole coupling (HQ) and the
nuclear Zeeman interaction (Hz). All together, they lift the degeneracy of
the electron- and nuclear-spin states and determine for example the elec-tronic levels’ hyperfine structure.
2.1.2 The free-ion Hamiltonian
Three main contributions describe the Hamiltonian for the free ion:
H = H0+ HC + HSO (2.2)
The first term, H0, describes the movement of outer electrons in the central
field U’(r) of the nucleus and of the inner closed shell electrons: H0 = ⌃i(~
2
2m5
2
i +U0(ri)) (2.3)
We can consider these terms as possessing a purely radial symmetry and their e↵ect is just to shift homogeneously the ensemble of 4f energy levels without a↵ecting their structure.
The second term, HC, is the Coulomb interaction between pairs of outer
electrons:
HC = ⌃i>j
e2
rij
(2.4) This term splits the energy level of the electronic configuration and its pres-ence in the Hamiltonian prevents analytical calculations.
The last term, HSO= ⌃i⇠(ri)~li~si represents the spin-orbit coupling and
to-gether with the Coulomb interaction they can be considered as a pertur-bation of the hydrogen-like Hamiltonian H0. It is noteworthy to proceed
with some considerations about the order of magnitude of these terms. If HC ⌧ HSO, the spin-orbit coupling drives the system toward the
Russell-Saunders description. In this model, the electronic orbital and spin moments l and s are coupled to give total orbital and spin moments L and S. More-over, these moments are also coupled to form the total moment J, whose projection on chosen quantization axes is MJ. Hence, the atomic wave
func-tions are characterized by the 4 quantum numbers L, S, J, MJ which lead to
the spectral terms2S+1LJ. In rare-earth ions, HC and HSO are of the same
order of magnitude (this is known as the intermediate coupling). In this case L and S can still be considered good numbers as long as we are dealing with very low excited states with the consequence that their selection rules may not hold in some cases. We make the choice to go on by using the Russell Saunders description and we can write eigenstates as linearly decomposed over the LS coupling states:
|4fn [LS]Ji = ⌃ 0,L0,S0C( 0, L0, S0)|4fn 0, L0, S0Ji (2.5)
Here, is a quantum number that allows the di↵erentiation of the terms having the same L and S, whose notation between brackets indicates that they are not anymore in general good quantum numbers. The coefficients C( ’,L’,S’) are calculated from the diagonalization of the total Hamiltonian adjusted on the energy levels measured for ions in solution or in a crystalline host.
2.1.3 The crystal field
When the free ion is inserted in a matrix it is necessary to take into account the interactions between the ion and the host usually referred to as the crystal field interaction (H in equation 2.1). If V (r, #, ) is the crystal field potential, a new term, which takes into account the crystal field contribution, can be introduced in the Hamiltonian:
Vc = e2⌃iV (ri, #i, i) (2.6)
E↵ectively, the host creates an electrostatic field around the ion which splits, by Stark e↵ect, the degenerated levels. Since it obeys the Laplace equation ( V=0) it can be decomposed as sum of spherical harmonics:
Vc = ⌃(k,q,i)Bqk
p 4⇡ 2k + 1Y
(k)
q (#i, i) (2.7)
The Bkq terms are the crystal field parameters that convey the influence of the crystal on the2S+1LJ states. They could be calculated from the structural
parameters of the material but they are usually obtained as phenomeno-logical parameters from the experience. As already mentioned, because of the localized radial extension of 4f orbitals and the screening from higher orbitals, 4f electrons weakly participate to the chemical bonding and they are nearly not influenced by the crystal field. It is possible, then, to treat this new term as a perturbation (weak field approximation). In Figure 2.3 we summarize all the di↵erent Hamiltonian contributions with their e↵ect on the energy level structure.
Figure 2.3: Level splittings due to di↵erent contributions of the Hamiltonian. In red the nuclear degeneracy removal.
The Coulomb interaction, HC, is responsible for the degeneracy lift of 4f
levels into 2S+1L states. The spin-orbit contribution HSO further removes
the degeneracy of the 2S+1L term by introducing the J=L+S, the total angular momentum. It splits the terms into2S+1L
J manifolds or multiplets.
Each manifold is, nevertheless, 2J+1 fold degenerated. The main action of the crystal field H is to break the spherical symmetry of the free ion. This is then replaced by the local symmetry of the crystallographic site occupied by the rare-earth ion. The interaction with the H removes the 2J + 1 degeneracy to split the states to a maximum of: J+1/2 doublets for ions with an odd number of electrons; 2J+1 levels for ions with an even number of electrons. Indeed for high symmetry site the degeneracy lift is not total. This symmetry lowering implies that degenerated Stark sub-levels split in a maximum of 2J+1 states, where the number depends on the rare-earth nature and the local symmetry of the site, as shown in Figure 2.4.
Figure 2.4: Number of Stark levels for a given J and a given punctual symmetry [70]. In bold, is highlighted the category to which the ions used in this work belong in the crystal structure used.
The action of the crystal field on the degeneracy lifting is not the same as the number of electrons in the 4f orbital is even or odd. This is due to the fact that the electronic wavefunctions behave di↵erently according to the parity. For ions with an odd number of electrons, Hamiltonian eigenvalues are at least doubly degenerated. Eventually, still referring to Figure 2.3, the red part represents the degeneracy lifting due to spin interactions. Figure 2.5 shows the Dieke diagram with the energy levels for triply ionized rare-earth ions in LaCl3 crystal. As already mentioned, the Russell-Saunders 2S+1LJ
notation is conserved in order to distinguish the di↵erent multiplets. For the absorption studies we performed, the optically active ions used was eu-ropium for which we highlight (in red) the investigated transition7F0!5D0
Figure 2.5: Dieke diagram representing the electronic energy levels for rare-earth ions in LaCl3[70]. The width of the lines shows the total splitting due to the crystal
field. The red arrow shows the investigated7F
0!5D0 transition for Eu3+ (at ca.
580 nm) in Eu3+:Y
2O3 particles.
2.1.4 Intensities of rare-earth optical transitions
The oscillator strength P of a component of an electric dipole transition from a ground state|Ai to an excited state |Bi is given by the expression:
P = 8⇡
2mc
h |hA|D
(1)
where m is the electron mass, h the Plank’s constant, c the velocity of light, the energy of the transition in cm 1, the Lorentz field correction for the local field of the medium and D(1)q the components of a rank 1 tensor
oper-ator (q=0,±1). Indeed, the lanthanide ion in a dielectric medium not only feels the radiation field of the incident light, but also the field created by dipoles in the medium. The matrix elements of the electric dipole operator vanish between states of the same parity and then between states arising from the same configuration. Nevertheless, in practice the 4f-4f transitions are observed and this is due to the mixing of the empty higher states of opposite parity (4f)n 15d with the 4fn states by the crystal field. In other words, the parity is broken if the ion is inserted in a crystalline medium which can break the symmetry and allow the transition. Hence, the site symmetry becomes an important factor to take into account in order to develop absorbing materials. For example, sites characterized by an inver-sion symmetry prevent the mixing of states with opposite parity, leading to low oscillator strengths. For the forced electric dipole transitions between
2S+1L
J and 2S0+1LJ0, the following selection rules need to be satisfied:
L = 0,| S| = 0, (2.9)
| J| 6, unless J or J0 = 0 then | J| = 2, 4, 6 (2.10) As mentioned, the electronic transition excited in the case of europium ions is that from the ground state7F0 to the excited state5D0 which occurs
at around 580 nm. It is worthy to highlight that this transition, widely used for high-resolution spectroscopy measurements, should be strictly forbidden in the framework of the the Judd-Ofelt theory [71]. However the selection rule is bypassed in many materials due to additional mechanisms such as the breakdown of the closure approximation used in Judd-Ofelt theory, the Wybourne-Downer mechanism that leads to a relaxation of the spin selection rule within excited configurations [72] and the J-mixing of the wave functions of J6=0 states with that of the J=0 state by even parity terms of the crystal field [73, 74]. These e↵ects are rather weak and lead to quite small oscillator strengths (10 8 in Eu3+:Y2SiO5) in comparison to other rare-earth
transi-tions (e.g. 8.10 6 for Nd3+:YAG). It’s worthy to notice that in Eu3+:YSO,
some variations of oscillator strength have been observed [75] as a function of the growth process.
2.2
The host studied in this work: yttrium oxide
(Y
2O
3)
Metal oxides have a large field of applications in several fields, such as catal-ysis, coating, electrochemistry, optical fibers, sensors, batteries etc. [76–78].
In particular, yttrium oxide materials are interesting for several applica-tions such as infrared windows, high-power lasers, radiation detection and in particular phosphors [79, 80]. Recently, it was shown in our group that Eu3+:Y2O3 could also have applications in quantum information
applica-tions [46]. In addition, particles of this host can easily be synthesized by several bottom-up routes. This last point is very important because some systems, such as Eu3+:YSO, do not easily form dispersed crystalline parti-cles from chemical routes.
As the majority of RE sesquioxides, Y2O3 can crystallize as cubic phase,
with Ia-3 space group. Cubic Y2O3 has a high dielectric constant from 14
to 18, a large bandgap of 5.8 eV and also optical isotropy, with a refractive index of 1.91 in the visible range. In addition, this system shows high chem-istry and thermal stabilities because of the high melting point, about 2400
oC. The dominant phonon energy is 380 cm 1 with a cuto↵ value of 600
cm 1, which is one of the lowest phonon energies among oxides materials
[80]. The cubic Y2O3 phase has two cationic sites in which the lanthanides
preferentially enter. This Y2O3 unit cell consists of 32 octahedrally
coor-dinated cation sites, that is 24 sites with C2-symmetry and 8 sites with
C3i-symmetry (or S6) (Figure 2.6).
Figure 2.6: The two di↵erent cation sites for Y2O3cubic lattice.
This cubic Y2O3 phase is related to the fluorite structure, with each
yttrium ion located at the center of a cube from which two of the eight nearest neighbor oxygens of the fluorite structure have been removed. Oxy-gens present in the structure are slightly displaced from the cube corners. There are two arrangements for oxygen ions, in the first, the two oxygen ions are removed from a face diagonal and the yttrium ion is displaced from the center of the cube. This is the site with C2 symmetry. In the second
C3isymmetry site (or S6) [81, 82].
The elementary cell contains 16 formula units (RE)2O3. As mentioned
above, the 32 octahedrally coordinated cations are distributed among two di↵erent sites: 24 ions occupy sites with C2 symmetry and 8 ions having C3i
symmetry site [83]. The Y-O distances in a C3i site are 2.26, 2.28, and 2.34
˚
A, and for the C2 site the distances are 2.23, 2.24, 2.27 ˚A. In this structure
each yttrium ion occupies a distorted octahedral site (Y O6), and these 32
Y O6 are linked by corners and edges [81]. The Figure 2.7 shows the packing
diagram of Eu3+:Y
2O3 after Rietveld refinement from Krishna et al., which
can give a general idea about how these octahedra are placed [84].
Figure 2.7: Packing diagram of Eu3+:Y
2O3 cubic structure [84].
2.3
Eu
3+:Y
2O
3materials
Lanthanide-activated rare earth oxides remain promising materials for next-generation display technology because of several important properties, such as luminescent characteristics, stability in vacuum, and corrosion-free gas emission under electron bombardment compared with traditional cathode ray tube red phosphors used in current field emission displays [85–88]. In particular, Eu3+:Y2O3 is a commercial available phosphor with extremely
high quantum efficiency. The combination of an efficient red emission and long-term stability have wide commercial application in high resolution and
projection TV, projection devices, plasma display panels and field emission displays [89, 90].
In general, Ln3+ ions have been found to be randomly distributed in both
C2 and C3i sites in Y2O3 single crystals [91], although a preferential
occu-pation of the C2 site was suggested in the case of Gd3+ and Eu3+ [92, 93].
According to the Judd-Ofelt theory, the electric dipole transitions are not allowed for the Eu3+ ions occupying the C3i sites since it is the odd parity
crystal field components that mix the 4fn configuration to opposite parity ones. In centrosymmetric Ln3+complexes, only the vibronic coupling
mech-anism can induce f-f electric-dipole intensity. Therefore, it can be assumed that the major contribution to the intensity of the observed transitions orig-inates from the Eu3+ ion is the C
2 sites in which electric dipole transitions
are allowed.
Eu3+:Y2O3 bulk crystals show low nuclear moment density, low
inhomo-geneous broadening and long coherent optical T2, which are fundamental
features for QIP applications [22, 24]. The main characteristics of Eu3+ are summarized in Table 2.1.
Table 2.1: Main characteristics of europium ions (CN = coordinator number).
Europium3+
Electronic configuration [Xe]4f6
Ground/excited states 7F0/5D0
Ionic radius (CN=6) 0.0947 nm Nuclear spin (I) 5/2
Isotopes 151Eu 153Eu
Natural abundance 47.8 % 52.2 %
Mag. moment (bare nucleus) 3.465µN/1.056kHz/G 1.531 µN/0.4668 kHz/G
Quadrupole moment +0.95 . 10 24 cm2 +2.42 . 10 24 cm2
Its electronic configuration is [Xe]4f6 and it exists with two stable iso-topes in nature: 151Eu and 153Eu, with nearly equal natural abundance.
The lifetime T1 for the optical excited state 5D0 is in the ms range [51].
This state has low non radiative relaxation rates thanks to the large energy gap (around 10000 cm 1) which separates it from the highest ground state
level (7F6), as shown in Figure 2.5. The nuclear spin for the two isotopes is
I=5/2 and thus it exhibits a three level hyperfine structure in the ground and excited states due to quadrupole interactions with the electric field gradients.
2.4
State of the art of Eu
3+:Y
2O
3bulk and
nanocrys-tals
As introduced previously, RE atoms doped into various hosts are known to exhibit very sharp optical lines, especially at low temperatures. Among sev-eral materials, Eu3+:Y
2O3 bulk crystals stand out because of its
kilohertz-scale homogeneous linewidth for liquid helium temperatures [22]. Macfar-lane and Shelby probed T2 lifetimes by photon echo technique at low
tem-perature for Eu3+:Y
2O3 single crystal prepared by Verneuil method. These
authors found 510 µs for the optical coherence lifetime of the7F0-5D0
tran-sition, which is the longest coherence lifetime seen for Eu3+:Y2O3 ,
corre-sponding to 600 Hz of homogeneous linewidth [22]. Babbit and coauthors have reported at liquid-helium temperatures 10 GHz inhomogeneous ab-sorption widths for 7F0 !5 D0 transition in 2.0 at.% Eu3+:Y2O3 and an
homogeneous linewidth around 2.5 kHz [23]. Flinn and coauthors have done two-pulse photon echo measurements on Eu3+:Y2O3samples prepared under
di↵erent crystal-growth techniques, founding additional sample-dependent contribution to the homogeneous broadening in comparison with a crystal growth by the flame fusion technique. The broadening found is not cor-related with Eu3+ concentration in the matrix, suggesting the presence of disorder in samples with large homogeneous linewidths [94]. The homoge-neous linewidth values found in Flinn’s work are showed in Table 2.2.
Table 2.2: Homogeneous linewidth values reported by Flinn and coauthors for Eu3+:Y
2O3 fibers and flame-fusion samples at 1.4 K [94].
Sample Eu3+ concentration (at. %)
h (kHz) Fiber F6 0.55 4.0 Fiber F1 0.3 18 Fiber F5 0.13 42 Fiber F2 0.1 26 Fiber F3 0.05 38 Fiber F4 0.004 9.4 Flame fusion 0.3 2.5
Sellars and collaborators have studied the same Eu3+:Y
2O3 bulk
crys-tal which gave 510 µs and several others by spectral hole burning. They reported a hole width of 3.5 kHz, which is among the narrowest spectral feature observed directly in the frequency domain for a solid [24]. In this publication, several Eu3+:Y2O3 crystals made by di↵erent techniques and
doped with di↵erent Eu3+concentrations were studied, resulting in the same conclusion as Flinn et al., that the wider holes found for some of these sam-ples can not be attributed to Eu3+ doping level, suggesting that additional
broadenings are associated with some disorder modes in ordered crystalline solids.
Studies on coherence lifetimes in RE doped nanoparticles were pioneered by Feofilov and Meltzer more than one decade ago [66, 95, 96]. The in-vestigated materials were Eu3+:Y2O3 in monoclinic and cubic phases [67],
Eu2O3 (monoclinic phase), Eu3+: -Al2O3 [96], Eu3+:LaF3 and Pr3+:LaF3
[67]. These materials cited above exhibited crystal sizes ranging from 4 to 23 nm, determined by X-ray di↵raction (XRD). These studies investigated the temperature and crystal size dependences of optical coherence lifetimes (T2) showing di↵erent behavior of nanoparticles compared to bulk crystals.
Temperature dependence of the homogeneous linewidth of high quality bulk crystals usually shows a nearly temperature-independent rate until the on-set above 7 K of the two-phonon Raman process which is proportional to T7 [21]. The temperature dependences of the linewidth of spectral holes burned in7F
0!5D0 Eu3+ transition shown in Figure 2.8 show an approximate T3
temperature dependence for isolated Eu3+:Y2O3nanoparticles, in sharp
con-trast with the bulk crystals [67, 97, 98]. When the particles were embedded in a polymer or a glass, a nearly linear temperature dependence was observed [66, 67]. This was attributed to an interaction with the low frequency vibra-tion modes of the polymer, the so-called two-level systems. This is typical of disordered systems, and was actually observed in Eu3+:Y
2O3 bulk fibers
crystals, presumably containing a high defect concentration [21].
Figure 2.8: Temperature dependence of the hole width for 0.1 at.% Eu3+:Y
2O3
nanocrystals. Solid lines: linear fit for nanocrystals embedded in polymer and T3
These studies made on nanocrystals used mainly spectral hole burning to determine homogeneous linewidths. At low temperature, they were found to range from about 5 to 50 MHz, although due to laser stability, this technique could anyway not measure values lower than a few MHz. The corresponding coherence lifetimes, in the range of tens of ns, were much too short for quantum information processing. In particular, this does not allow efficient coherent interactions between Eu3+ and usual laser sources.
To overcome the limitations of spectral hole burning, our group started to investigate the coherence lifetimes of Eu3+:Y2O3 nanocrystals by photon
echo measurements . This allows determining optical coherence lifetimes at short time scales and do not need a well stabilized laser. These experiments on powders were made possible by the development of photon echo mea-surements in highly scattering media, also pioneered in our group [99]. This technique will be described in details in Chapter 6. It was found for 0.86 at.% Eu3+:Y2O3 nanocrystals T2 times as long as 3.7 µs at 1.3 K, or 86
kHz [46]. This is nearly two orders of magnitude lower than the values pre-viously reported, and is the narrowest homogeneous linewidth reported for any nanocrystals. These results suggest that nanostructured RE doped crys-tals could o↵er new functionalities in quantum information processing, like coupling to other quantum systems or optical control of single ions [62, 100]. However, these nanocrystals show T2 still about two orders of magnitude
lower than in the best bulk crystals [24] and were agglomerated in particles of several microns. They were therefore not suitable for further develop-ments at the nanoscale. The main goal of this PhD project was therefore to bring long coherence lifetimes to smaller particles that could be dispersed, enabling for example individual adressing.
2.5
Conclusions
At the beginning of this chapter we have introduced the theoretical de-scription of rare-earth ions energy level structure in a crystal lattice. The specificity of lanthanides has been reviewed, emphasizing their relatively low sensitivity to the ion environment, which has made rare-earth-doped materi-als particularly suitable for laser applications or, more recently, for quantum information processing. Finally, we have presented the main characteristics of the Eu3+:Y2O3 material, and the state of art of RE bulk crystals and
Synthesis and Structural
Characterization
Contents 3.1 Synthesis of Eu3+:Y 2O3 particles . . . 27 3.2 Characterization techniques . . . 283.3 Structural characterization: Eu3+:Y(OH)CO
3 . 28
3.3.1 Mechanism of particle formation . . . 28
3.4 Structural characterization: Eu3+:Y
2O3 . . . 39
3.4.1 E↵ect of annealing time . . . 43
3.4.2 E↵ect of annealing temperature . . . 45
3.4.3 E↵ect of Eu3+ concentration . . . 51
3.4.4 Crystallite size estimation of Eu3+:Y
2O3 particles 53
3.5 Conclusion . . . 60
As previously discussed in the Introduction chapter, materials for quan-tum information applications must present long optical coherence lifetimes, in other words, narrow homogeneous linewidths.
Several requirements are necessary to control static and dynamical pertur-bations which cause linewidth broadenings in RE materials. These require-ments consist in high crystalline quality, low level of magnetic impurities and low magnetic moments. However, the use of RE nanostructured materials demands additional control in order to have optimized properties, such as ideal morphology of particles, sharp size distribution, absence of agglomer-ation, less defects due to the higher surface to volume ratio [101].
Many synthetic methods have been reported in the literature for preparation of Eu3+:Y2O3 particles. The classical procedure to obtain oxide materials
is the solid-state method, which requires temperatures higher than 1000oC
and an e↵ective reactant mixture. Furthermore, high-temperature heating 25
usually results in unfavorable coarsening of particles with irregular shapes and considerable aggregation [102]. Post milling can alleviate aggregation and bring down particle sizes, however, this operation can introduce many defects which can a↵ect dramatically the optical properties.
Several methods to synthesize Y2O3 particles directly in sub-micron regime
have been reported, including the sol-gel technique [103, 104], spray py-rolysis method [105–107], polymeric precursor [108], combustion synthesis [109, 110], solvothermal process [111], homogeneous precipitation [112, 113] and so on.
Some of them, such as the sol-gel route can result in high homogeneity of products, low cost and, low processing temperature, however this technique forms large particle aggregates. In contrast, spray pyrolysis is a straight-forward way to prepare dispersed spherical particles, with hollow structures and a wide size distribution in nano- micro- range [114]. Solvothermal tech-niques, can induces a rapid crystallization, phase purity and high yield, with relevant particle aggregation [105].
Few methods have been reported in the literature which lead directly to single crystalline materials without an annealing step, such as polyol and molten salt processes [90, 115–118]. Polyol method is able to prepare a large variety of materials, including oxides, in a high-boiling alcohol reac-tion with metal chlorides or nitrates, forming small nanoparticles or bigger agglomerated particles, depending of metal precursors [115, 116]. In ad-dition, the molten salt synthesis is another method which uses a mixing salt medium at elevated temperatures in order to form single-crystalline nanoparticles without additional annealing step, forming irregular particles with large size distribution [117].
The main challenge in the development of crystalline particles is to find a technique which simultaneously brings controlled shape, narrow size distri-bution, expected crystalline phase and stable particle dispersion. Thus, in order to have spherical particles, well dispersed with controlled size distribu-tion, we have chosen the homogeneous precipitation (HP) method with ap-propriate thermal treatments to obtain sub-micron spherical monodispersed Eu3+:Y2O3 particles. Among several bottom up routes, this homogeneous
precipitation (HP) route stands out due to low required temperature of syn-thesis, simple procedure, cost-e↵ectiveness and, formation of particles with regular shapes and narrow size distribution [119]. This HP route is based on the slow introduction of ligands (e. g. OH , CO23 , or SO24 ) into the system until the solubility limit is exceeded, forming homogeneous-doped amorphous materials with well controlled sizes and shapes [120].
This chapter will describe the synthesis based on the homogeneous precip-itation method and structural characterization of the products in order to understand the formation mechanism and particle modifications as a func-tion of reacfunc-tional and post-reacfunc-tional parameters.
3.1
Synthesis of Eu
3+:Y
2O
3particles
Y(NO3)3.6 H2O (99.9% pure, Alfa Aesar) and Eu(NO3)3.6 H2O (99.99%
pure, Reacton) were used as yttrium and europium sources, respectively. The Eu3+ concentrations used were varied between 0.3 and 5.0 at. %. In a typical synthesis, an appropriate amount of urea (CO(NH2)2, 99% pure,
Sigma) was dissolved in a mixed Eu/Y aqueous nitrate solutions to make a total solution volume of 800 mL. The concentrations varied as 0.3, 0.5, 2.0 and 3.0 mol.L 1 for urea and 7.5 mmol.L 1 for metals (Eu3+ and Y3+). The mixed solutions were heated at 85oC for 24 h in a Teflon reactor. After
this reaction time, the final suspensions were cooled to ambient conditions and the colloidal particles collected via centrifugation. The wet precipi-tates were washed with distilled water once to remove the byproducts, then rinsed twice with absolute ethanol, and dried at 80oC for 24 h to yield a Eu3+: Y(OH)CO3 powder. The Eu3+:Y2O3 samples were obtained by
cal-cination of these original powders [Eu3+:Y(OH)CO
3 . n H2O] under air
during di↵erent times at temperatures ranging from 900 to 1200 oC, which were reached using a heating rate of 3oC min 1. A simple summary of this experimental procedure is presented in the Figure 3.1.
Figure 3.1: Summary of experimental procedure to obtain Eu3+:Y
3.2
Characterization techniques
TG-DTA measurements were performed in order to analyze the decomposi-tion reacdecomposi-tions and formadecomposi-tion of Eu3+:Y
2O3from the Eu3+: Y(OH)CO3
com-pound. Then the dried Eu3+: Y(OH)CO3 products were measured with a
NETZSCH STA409 PC/PG thermal analyzer by heating samples to 1200oC in air at a rate of 5oC/min. Composition of products from TG-DTA
mea-surements was probed by mass spectrometer coupled to NETZSCH STA409 PC/PG thermal analyzer. The Fourier transform infrared (FTIR) stud-ies have been performed on a Bruker Tensor 27 spectrometer in the range 4000-375 cm 1 at room temperature, using the conventional KBr pellet technique. The morphology, size and dispersion of the original and calcined particles were visualized by transmission electron microscopy (TEM) using a JEOL JEM-100CXII apparatus at an accelerating voltage of 100 kV. Elec-tron di↵raction (ED) patterns were recorded in order to distinguish phases from Eu3+: Y(OH)CO3 to Eu3+:Y2O3 powders for analyses of Eu3+:Y2O3
and core shell systems. For TEM measurements, a small amount of powder was ultrasonically dispersed into anhydrous ethanol and a drop placed over a carbon coated microscope copper grid. Particle size distributions were determined by using the free software ”ImageJ” on TEM images. To get statistically relevant results, analyses were performed on more than 100 par-ticles.
The crystalline phase of the annealed systems was determined by x-ray di↵raction (XRD) analysis with a PANALYTICAL X‘PERT PRO di↵rac-tometer using monochromatic CuK ↵1 radiation (wavelength at 154.060 pm)
in the 2✓ range between 12 and 150 o, with 0.0065 o as step size at room
temperature. The crystallite sizes were determined by Rietveld refinement [121] using FullProf software [122]. The integral breadth of all di↵ractogram peaks between 12 and 150 o (2✓) were taken into account. To assess the
instrumental line broadening, the XRD pattern of an standard microcrys-talline LaB6powder was recorded under the same conditions for all samples.
3.3
Structural characterization: Eu
3+:Y(OH)CO
33.3.1 Mechanism of particle formation
Monodispersed spherical particles with a chemical composition of Eu3+ doped yttrium basic carbonate [Eu3+:Y(OH)CO
3 . n H2O] were
synthe-sized by the homogeneous precipitation method. In this synthesis urea is added to RE salts (nitrate and chloride) and the solution is aged at tem-peratures between 70 and 90 oC. The molar ratio between urea and RE
parame-ters like reaction time, type of precursor anions and initial pH solution, can also a↵ect the size, morphology and kinetics of Eu3+:Y(OH)CO3 particle
formation. Here, metal nitrates were used instead of chlorides in order to avoid any Cl contamination in the final product, since NO3 species are eliminated with thermal treatments at high temperatures. RE cations pre-cipitate with anions such as CO23 and OH produced by the dissolution of urea and forming an amorphous [Eu3+:Y(OH)CO3 . n H2O] compound.
The precipitation is done homogeneously due to slow decomposition of urea. Reactions involved in this synthesis route, initially proposed by Aiken and Matijevi´c, are shown below [123]:
Urea decomposition (N H2)2CO⌦ NH4++ OCN (3.1) OCN + 2H++ H2O ⌦ CO2+ N H4+ (3.2) Metal hydrolysis M3++ H2O ⌦ [M(OH)]2++ H+ (3.3) Precipitation [M (OH)]2++ CO2+ 2H2O ⌦ M(OH)CO3.H2O + 2H+ (3.4) Overall M3++ (N H2)2CO + 4H2O⌦ M(OH)CO3.H2O + 2N H4++ H+ (3.5)
The reactions (3.1)-(3.2), (3.3), (3.4) and (3.5) represent the decomposition of urea, hydrolysis of yttrium ions, precipitation and overall reactions, re-spectively.
The evolution of pH as a function of time of reaction was observed in the present work for all synthesis under di↵erent conditions. All of them showed an increase of 3 pH units, checked in the beginning (after precursors disso-lution) and the end of reaction (after 24 h at 85oC).
Sohn and collaborators have observed the pH increasing between the ini-tial and final reactional time. These authors observed that the solution pH during the particle precipitation remains constant (tested under di↵erent reaction conditions) increasing the pH when the precipitation reaction has finished. They also noted that the equilibrium constant, K, of the metal hy-drolysis reaction (Equation 3.3) is very small to supply the hydroxyl groups present in the overall reaction (Equation 3.5). In agreement with several
observations, these authors have proposed a new chemical mechanism for this route [112]. Urea decomposition (N H2)2CO⌦ NH4++ OCN (3.6) OCN + 2H2O⌦ CO23 + N H4+ (3.7) CO32 + H2O ⌦ HCO3 + OH (3.8) HCO3 + H2O⌦ H2CO3+ OH (3.9) H2CO3 ⌦ CO2+ H2O (3.10) Precipitation M3++ OH + CO32 +3 2H2O ⌦ M(OH)CO3. 3 2H2O (3.11) Overall M3++3 2(N H2)2CO+5H2O⌦ M(OH)CO3. 3 2H2O+N H + 4 + 1 2CO2 (3.12) This new proposed chemical route of homogeneous precipitation in the presence of urea shows in a better way the pH evolution close to the end of the precipitation steps. In the end of the metal basic carbonate forma-tion, the decomposition of excess urea generates a large number of OH ions which change this medium from acid to basic, such as observed in our work for synthesis with 24 h aging time and 0.5 M urea, from pH 5.8 to 8.6.
3.3.1.1 E↵ect of aging time
For a better understanding of the growth mechanism, the influence of aging time on particle sizes was observed by looking at TEM images1 from parti-cles obtained using 4 h 30, 8 h and 24 h as reaction times, keeping the same reaction parameters (see Figure 3.2).
1Measurements of transmission electronic microscopy were done thanks to Patricia
Beaunier at Laboratoire de R´eactivit´e de Surface - UPMC and Patrick Le Griel at Coll`ege de France in Paris.
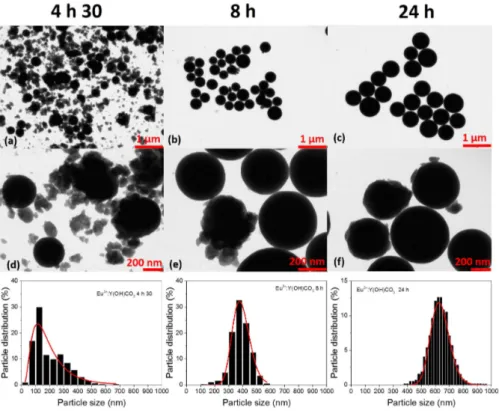
Figure 3.2: TEM images and histograms of 0.3 at.% Eu3+:Y(OH)CO
3 particles
prepared using 0.5 M of urea, 7.5 mM of metals with reaction time (a,d) 4h 30 min and (b,e) 8 h and (c, f) 24 h. Solid line in histogram graphs represents log normal fit.
Micrographs in the Figure 3.2 show the evolution of particle size as a function of aging time, as reported in previous papers [101, 120]. The in-crease in aging time promotes the enlagerment of particles showing average particle size from 167 nm (t= 4 h 30), 388 nm (t= 8 h) and 633 nm (t= 24 h), with standard deviations of particle sizes around ± 139, ± 63 and ± 67, respectively, according to a log normal fit (see Figure 3.2). For the sample obtained using the shortest aging time, many small and irregular nu-clei were observed together with spherical particles. Increasing the reaction time, particles become larger and more regular. The spherical morphology is an evidence about the amorphous nature of the YOC precursors.
For a long time uniform particle formation has widely been explained by the LaMer model [124, 125], based on short nucleation burst followed by uniform growth, showing two well defined and separated stages. This model describes well particles up to several tens of nanometers, however for parti-cles with diameters higher than 100 nm, the explanation based in separated nucleation burst/growth stages is inadequate [126]. Many studies consider
particle formation via aggregation of much smaller subunits rather than growth by di↵usion of species from the solution [126, 127].
These studies consider a two-stage growth process, for which a supersatu-rated solution generates nuclei from di↵usive mechanism, forming primary particles formed by the burst-nucleation process and further growth by dif-fusive capture of solute species. These primary particles aggregate forming secondary particles with narrower size distribution and larger sizes [126]. However, the majority of particles after aging time of 24 hours do not exhibit the profile of particles resulted from aggregation of smaller nuclei, according to the particle formation model proposed by Ocana and coauthors. Figure 3.3 shows the smooth surfaces of 0.3 at.% Eu3+:Y(OH)CO3 particles aged
during 24 h.
Figure 3.3: TEM image of 0.3 at.% Eu3+:Y(OH)CO
3 particles prepared using 2.0
M of urea, 7.5 mM of metals with reaction time 24 h.
Figure 3.3 shows that the majority of objects exhibits smooth surfaces and few rough particles. This smooth surface profile for particles aged under longer values indicates that particles grown by a two-stage growth process have an additional growth mechanism as a function of time. This last mecha-nism based on the formation of larger particles as a function of reaction time can be explained by the Ostwald ripening or coarsening process [128, 129]. All the discussed LaMer, Ocana and Ostwald mechanisms of particle forma-tions in soluforma-tions are depicted in Figure 3.4.
Figure 3.4: Scheme of models of particle formation in solution. Di↵erent curves show LaMer (A), Ocana (B) and Ostwald ripening (C) discussed mechanisms. Adapted from [130].
The Ostwald process based on the vanishing of small particles (and/or species on the particle surface) can be explained considering that, the total energy of the two-phase system can be reduced by the volume increase of one phase, decreasing the interfacial area. The main force for this process is the curvature dependence of the chemical potential µ which, considering isotropic surface energy, is
µ = µ0+ Vm (3.13)
where is the mean interfacial curvature, µ0 is the chemical potential of an
atom at a flat interface, Vm is the molar volume and is the surface energy.
From this equation it is clear that atoms will move from regions of high to low curvature, promoting the disappearance of small objects and growth of bigger objects.
Then, the evolution of particle sizes and regularity with aging time observed in the 0.3 at.% Eu3+:Y(OH)CO3 systems showed in Figure 3.2, can be
ex-plained via two mechanisms, such as the growth based on the aggregation of smaller particles followed by vanishing of small particles according to Ocana and Ostwald ripening models, respectively.
3.3.1.2 E↵ect of reactional temperature
The choice of the reaction temperature for our syntheses was based on pa-pers by Matijevi´c et al. which show that temperature around 85 oC is the best choice for this kind of synthesis based on urea decomposition. Aging temperatures lower than 70oC decrease significantly the urea decomposition
in a way that no precipitation occurs. On the other hands, at temperatures above 100oC the urea decomposition is too fast, leading to secondary crit-ical supersaturation conditions, then an increase of particle size distribution.
3.3.1.3 E↵ect of metal concentration
The e↵ect of metal concentration on 0.3 at.% Eu3+:Y(OH)CO3 particles
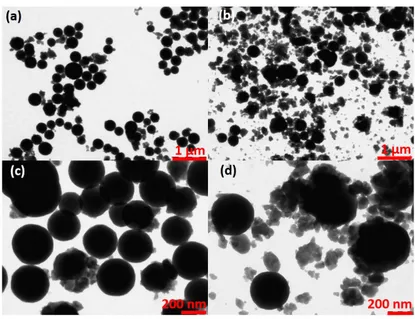
were investigated by TEM images present in Figure 3.5.
Figure 3.5: TEM images of 0.3 at.% Y(OH)CO3particles prepared using 0.5 M of
urea and (a, c) 5.625 and (b, d) 7.5 mM of metals with 4h 30 min as reactional time.
A large number of nuclei is present for system with higher metal con-centration, due to the short aging time, 4 h 30 min. At this short time the size di↵erences for large spherical particles are not so clearly visible, due to unfinished particle growth. Then, a possible increase of reaction time on both systems would promote higher growth of particles in the system which presents higher metal concentration. This possibility is based on the consideration that small adjacent particles will agglomerate forming larger objects (Ocana mechanism) and vanishing of small particles increasing sizes and decreasing the surface roughness (Ostwald ripening process). The co-existence of di↵erent particle size distributions shows that the LaMer model cannot be used to explain the particle formation mechanisms.
Within the range of yttrium concentration studied here, the particle shape is a well rounded sphere and the objects are not agglomerated. Particle
morphologies are strongly dependent on growth speed of particles. In par-ticular, spherical shape is characteristic of low growth speed.
The metal content influences significantly the speed of urea decomposition increasing it a lot, moving the equilibrium of decomposition reactions. In our work, the urea to metal concentration ratio is approximately 67. Sordelet and Akink (1987) have observed particle shape deviations from spherical to plate-like due to increase of metal content, with urea to metal ratios below 3 [120].
A particle might grow under supersaturation, maintaining the equilibrium form with its minimum surface free energy, such as spherical morphol-ogy.
3.3.1.4 E↵ect of urea concentration
The last parameter chosen to study and control particle sizes was the urea concentration, which has been systematically varied in this study from 0.3 to 3.0 M. A series of TEM micrographs and histograms are presented in Figures 3.6 and 3.7, respectively.
Figure 3.6: TEM images of 0.3 at.% Eu3+:Y(OH)CO
3particles prepared using 7.5
Figure 3.7: Histograms with log normal fit (red line) of 0.3 at.% Eu3+:Y(OH)CO3
particles prepared using 7.5 mM of metals and 0.3, 0.5, 2.0 and 3.0 M of urea.
All systems exhibit spherical, well dispersed particles with smooth sur-faces. An increase in urea concentration decreases the average particle size from 729 nm ([urea]= 0.3 M), 633 nm ([urea]= 0.5 M), 289 nm ([urea]= 2.0 M) to 198 nm ([urea]= 3.0 M), with standard deviations of particle sizes around ± 73, ± 67, ± 39 and ± 38 nm, respectively, according to a log normal fit (see Figure 3.8).
0.0 0.5 1.0 1.5 2.0 2.5 3.0 200 300 400 500 600 700 800 900 lo g av er ag e pa rt ic le s iz e (n m ) Urea concentration (M)
Figure 3.8: Average particle size of 0.3 at.% Eu3+:Y(OH)CO
3particles as a function
of urea concentration. The error bars are based on the standard deviation of size distributions and the solid line is the linear fit.
The linear inverse relationship between the logarithm of urea concentra-tion and the average particle size is in agreement with Sohn and co-authors [112]. The urea concentration in a reaction medium influences both the amount of nuclei formed as well as the point when supersaturation will be reached (promoting precipitation), providing a strong influence on the size of formed particles. At high urea concentrations, the elevated amount of CO32 and OH groups promotes a higher degree of supersaturation before
the beginning of precipitation. Thus, a larger nucleation density is formed promoting the decrease of average particle sizes [112].
The highest concentrated system does not show relevant particle aggrega-tion index, Sohn et al. observed significant aggregaaggrega-tion in systems made by using 7 M urea, (under di↵erent conditions compared with this work), due to the high nucleation density and a fast growth of precipitates [112]. In contrast to yttrium concentration dependence which can a↵ect only the ki-netics of precipitation, urea concentration influences both the precipitation kinetics and also the precipitation-nucleation rate.
3.3.1.5 E↵ect of Eu3+ concentration
The influence of Eu3+concentration on the precipitation rate of Eu3+:Y(OH)CO3
particles was probed by TEM measurements of 0.5 and 5.0 at. % Eu3+:Y(OH)CO 3
![Figure 2.2: Calculated (Hartree-Fock) radial distribution functions of 4f, 5s, 5p, 6s orbitals in Gd 3+ as a function of the distance from the nucleus [69]](https://thumb-eu.123doks.com/thumbv2/123doknet/7765703.255901/18.892.169.629.186.529/figure-calculated-hartree-distribution-functions-orbitals-function-distance.webp)