Calcitonin Gene-Related Peptide Negatively Regulates
Alarmin-Driven Type 2 Innate Lymphoid Cell Responses
The MIT Faculty has made this article openly available. Please share how this access benefits you. Your story matters.
Citation Wallrapp, Antonia et al. "Calcitonin Gene-Related Peptide Negatively Regulates Alarmin-Driven Type 2 Innate Lymphoid Cell Responses." Immunity 51, 4 (October 2019): P709-723.e6 © 2019 Elsevier Inc As Published http://dx.doi.org/10.1016/j.immuni.2019.09.005
Publisher Elsevier BV
Version Author's final manuscript
Citable link https://hdl.handle.net/1721.1/126749
Terms of Use Creative Commons Attribution-NonCommercial-NoDerivs License Detailed Terms http://creativecommons.org/licenses/by-nc-nd/4.0/
Calcitonin gene related peptide negatively regulates alarmin-driven type 2 innate lymphoid cell responses
Authors
Antonia Wallrapp1#, Patrick R. Burkett1,2#, Samantha J. Riesenfeld3#, Se-Jin Kim1,2, Elena Christian1,3, Raja-Elie E. Abdulnour2, Pratiksha I. Thakore3, Alexandra Schnell1, Conner Lambden1,3, Rebecca Herbst3, Pavana Khan2, Kazutake Tsujikawa4, Ramnik J. Xavier5,6, Isaac M. Chiu7, Bruce D. Levy2, Aviv Regev3,8*, Vijay K. Kuchroo1,3§*
# These authors contributed equally to this work.
Affiliations
1Evergrande Center for Immunologic Diseases, Harvard Medical School and Brigham and Women s Hospital, Boston, MA 02115, USA.
2Division of Pulmonary and Critical Care Medicine, Department of Medicine, Brigham and Women s Hospital, Boston, MA 02115, USA.
3Klarman Cell Observatory, Broad Institute of MIT and Harvard, Cambridge, MA 02142, USA. 4Laboratory of Molecular and Cellular Physiology, Graduate School of Pharmaceutical Sciences, Osaka University, Osaka, 565-0871, Japan.
5Broad Institute of MIT and Harvard, Cambridge, MA 02142, USA.
6Department of Molecular Biology, Massachusetts General Hospital, Boston, MA 02114, USA. 7Department of Immunology, Harvard Medical School, Boston, MA 02115, USA.
8Howard Hughes Medical Institute and Koch Institute for Integrative Cancer Research, Department of Biology, Massachusetts Institute of Technology, Cambridge, MA 02142, USA.
§ Lead Contact: Vijay K. Kuchroo
A.R. (aregev@broadinstitute.org) and V.K.K. (vkuchroo@evergrande.hms.harvard.edu)
Summary
Neuroimmune interactions have emerged as critical modulators of allergic inflammation, and type 2 innate lymphoid cells (ILC2s) are an important cell type for mediating these interactions. Here, we show that ILC2s expressed both the neuropeptide CGRP (Calcitonin Gene-Related Peptide) and its receptor. CGRP potently inhibited alarmin-driven type 2 cytokine production and proliferation by lung ILC2s both in vitro and in vivo. CGRP induced marked changes in ILC2 expression programs in vivo and in vitro, attenuating alarmin-driven proliferative and effector responses. A distinct subset of ILCs scored highly for a CGRP-specific gene signature after in vivo alarmin stimulation, suggesting CGRP regulated this response. Finally, we observed increased ILC2 proliferation and type 2 cytokine production and exaggerated responses to alarmins in mice lacking the CGRP receptor. Together, these data indicate that endogenous CGRP is a critical negative regulator of ILC2 responses in vivo.
Keywords
Type 2 innate lymphoid cells, neuropeptides, airway inflammation, CGRP, Ramp1, allergic inflammation, neuro-immune interaction
INTRODUCTION
Allergic asthma is characterized by chronic inflammation leading to airway hyperreactivity and remodeling after repeated allergen exposure (Lambrecht and Hammad, 2015). Type 2 helper T cells (Th2 cells) drive allergic inflammation by producing large amounts of interleukin-4 (IL-4), IL-5 and IL-13, which are important for class switching to IgE, recruitment of eosinophils and goblet cell hyperplasia, respectively (Lambrecht and Hammad, 2015; Yu et al., 2014). However, recent studies have highlighted the role of type 2 innate lymphoid cells (ILC2s) in the development of allergic diseases. Similar to Th2 cells, ILC2s express the transcription factor Gata3 and the type 2 cytokines IL-5 and IL-13. In contrast to Th2 cells, ILC2s are primarily found at mucosal surfaces, and do not express antigen-specific receptors and thus cannot respond directly to pathogens or allergens. Instead, they respond to signals from the tissue microenvironment, such as the alarmins IL-25, IL-33 or TSLP, which are released by epithelial cells upon stress or damage (Liew et al., 2016; Wallrapp et al., 2018).
The role of ILC2s in initiating and amplifying type 2 inflammation is tightly regulated to prevent exaggerated mucosal immune responses. Besides alarmins, an increasing array of factors have been shown to either positively or negatively regulate ILC2 function, including cytokines (Duerr et al., 2016; Molofsky et al., 2015; Moro et al., 2016; Motomura et al., 2014; Roediger et al., 2015), cell surface receptors (Oliphant et al., 2014; Taylor et al., 2017), and lipid mediators (Barnig et al., 2013; Krishnamoorthy et al., 2015; von Moltke et al., 2017). In particular, neuroimmune interactions are critical for regulating ILC2 function in mucosal tissues. Neurons recognize and respond to immunologically relevant molecules, including bacterial- and helminth-derived
peptidergic and non-peptidergic neurotransmitters regulate the function of adaptive and innate immune cells, including ILCs. The neuropeptides neuromedin U (NMU) and vasoactive intestinal peptide (VIP) both promote ILC2 effector function, whereas 2-adrenergic receptor ligands (e.g., epinephrine) inhibit ILC2 proliferation and cytokine production, indicating that neurotransmitters can both stimulate and inhibit ILC2-driven responses (Cardoso et al., 2017; Klose et al., 2017; Moriyama et al., 2018; Nussbaum et al., 2013; Talbot et al., 2015; Wallrapp et al., 2017).
Here, we identified an additional neuroimmune pathway that modulates ILC2 responses by analyzing expression of both neuropeptides and their receptors. ILC2s expressed both CGRP and the genes encoding its receptor chains Ramp1 and Calcrl. We demonstrate that CGRP limited type 2 cytokine production and ILC2 proliferation and induced a regulatory gene expression profile in ILCs. In an in vivo model, treatment with CGRP restrained ILC2-dependent airway inflammation, whereas deletion of Ramp1 promoted type 2 immune responses, indicating that CGRP is a central negative regulator of ILC2-mediated allergic inflammation.
RESULTS
ILC2s express the CGRP receptor subunits Ramp1 and Calcrl
To identify putative neuroimmune interactions that may modify ILC2-mediated responses, we analyzed the expression of a set of neuropeptide and neurotrophic factor receptors (Hoyer and Bartfai, 2012) (Table S1) in our previously reported single-cell RNA-seq (scRNA-seq) atlas of lung ILCs (Wallrapp et al., 2017). As previously shown (Cardoso et al., 2017; Klose et al., 2017; Nussbaum et al., 2013; Wallrapp et al., 2017), ILC2s expressed Vipr2 and Nmur1, the receptors
factor receptors were either undetectable or minimally expressed (e.g., Ntrk1, Ntrk3, and Mc1r;
Figure S1A), Ramp1, Ramp3, and Calcrl were expressed in a substantial proportion of cells
(Figure S1A). Calcrl and Ramp1 form the receptor for the neuropeptide calcitonin gene-related peptide (CGRP), whereas Ramp3 and Calcrl form the receptor for adrenomedullin (ADM) (Figure
S1B), and can act as a low affinity receptor for CGRP (Russell et al., 2014).
We examined which subsets of ILCs expressed Ramp1, Ramp3 and Calcrl at either steady-state or following treatment with IL-33 or IL-25 (Figure S1C,D) (Wallrapp et al., 2017). All three genes were expressed by lung-resident ILCs from all conditions, with broad expression of Ramp1 (Figure S1E). In addition, Ramp3 was highly expressed in a subset (cluster 9) of alarmin-induced ILC2s, as well as in a minor subset of ILC3s (Figure S1E).
We validated these results with quantitative real-time PCR (qPCR) of Ramp1, Ramp3, and Calcrl on lung-resident cell types. All three genes were highly expressed in naïve ILC2s, consistent with our scRNA-seq data (Figure S1F). Though other immune cell populations and CD45- stromal cells also expressed Ramp1, Ramp3 and Calcrl, expression of Ramp1 and Calcrl was highest in ILC2s compared to the other immune cell types (Figure S1F).
Lung ILC2s express the neuropeptide CGRP
We next investigated whether there are other cellular sources of CGRP in the lung besides neurons and neuroendocrine cells (Branchfield et al., 2016; Chiu et al., 2013; Sui et al., 2018). To test if CGRP is expressed in lung-resident immune cell populations, we used mice that express GFP under the control of the promoter of the gene encoding CGRP (Calca) (McCoy et al., 2012). Rare
(<1%) GFP+ cells were seen from most lung-resident immune cell types, while ~17% of ST2+ ILC2s were GFP+ at steady state (Figure S1G). IL-33 challenge did not increase the frequency of GFP+ ILC2s, but their frequency increased in response to the combination of IL-33 and CGRP (Figure S1G). Calca was largely co-expressed in one (cluster 9) of the two subsets (clusters 2 and 9) of lung ILCs that also highly expressed Ramp3 in scRNA-seq data (Figure S1E,H). ILCs also expressed several other genes encoding neurotransmitters, including Ubl5 and neuromedin B (Nmb), both of which have been implicated in regulating organismal metabolism (Figure S1I,
Table S1) (Collier et al., 2000; Majumdar and Weber, 2011). However, Calca was the only one
for which ILCs also expressed the receptor (Figure S1A). Taken together, our data show that ILCs uniquely express both chains of the CGRP receptor and CGRP itself, indicating that this pathway may play a key role in regulating ILC responses, potentially in an autocrine or paracrine manner.
CGRP negatively regulates ILC2 responses driven by IL-33 and IL-25 in vitro
To investigate how CGRP affects ILC2 function, we examined its effects on ILC2s in vitro, either alone or with IL-33 (Figure 1A). A recent report demonstrates that CGRP enhances IL-5 production by ILC2s (Sui et al., 2018), inferring it promotes ILC2 activation. Indeed, after 6 hours, ILC2s cultured with CGRP had upregulated expression of Il5 compared to ILC2s cultured with IL-7 alone (Figure 1B, bottom) and showed a trend towards increased expression of amphiregulin (Areg) (Figure S2A). In contrast, CGRP downregulated expression of Il13, indicating that CGRP may have a more nuanced role in regulating ILC2 responses (Figure 1B, top). Together with IL-33, CGRP led to significantly decreased Il13 expression and significantly increased Il5 and Areg expression, compared to IL-33 alone (Figure 1C,D). Similarly, short-term treatment with CGRP+IL33 increased the frequency of IL-5+ ILCs compared to IL-33 alone (Figure S2B),
whereas the frequency of IL-13+ ILC2s was significantly reduced (Figure S2C). Thus, CGRP treatment rapidly alters expression of three key effector cytokines produced by ILC2s, inducing both IL-5 and Areg and inhibiting IL-13.
The impact of CGRP on IL-33-induced changes in cytokine expression varied over time. After 3 days, CGRP treatment continued to promote Areg (Figure 1E) and repress IL-13 mRNA and protein expression (Figure 1F,G top), decreasing both the frequency of IL-13+ ILCs and intensity of IL-13 expression (Figure 1H, left). However, in contrast to short-term CGRP treatment, IL-5 mRNA and protein were both reduced after 3 days (Figure 1F,G, bottom), with significant decreases in both the frequency of IL-5-producing ILCs and the intensity of IL-5 expression (Figure 1H, right). CGRP similarly inhibited ILC2 responses to IL-25 and NMU (Figure 1I,J), which synergize to promote type 2 cytokine production in lung ILC2s (Wallrapp et al., 2017). Thus, over time CGRP inhibits IL-33-induced production of both IL-5 and IL-13 in vitro, and can inhibit ILC responses to two distinct stimuli.
CGRP inhibits IL-33-induced ILC2 proliferation in vitro
CGRP also suppressed ILC2 proliferation. We cultured lung ILCs labeled with CellTrace Violet for 3 days with IL-7, IL-33, or IL-33+CGRP. ILC2s proliferated in response to IL-33 (Figure 1K), while addition of CGRP strongly inhibited IL-33-induced ILC2 proliferation in a dose-dependent manner (Figure 1K). While ~55% of IL-33-activated ILCs divided at least once, less than 10% of ILCs proliferated in the presence of 100nM CGRP. Thus, CGRP negatively regulates IL-33-driven ILC2 proliferation and type-2 cytokine production, while promoting expression of Areg.
Upon binding to its receptor, CGRP induces generation of cAMP, a key second messenger (Russell et al., 2014). To investigate whether CGRP regulates ILC2 proliferation and type-2 cytokine expression via cAMP, we cultured lung ILCs with IL-33 and cell-permeable dibutyryl-cAMP (dbcAMP). Similar to CGRP, dbcAMP increased Areg expression and reduced Il13 expression, while Il5 expression was induced at 6 hours and inhibited at 3 days (Figure 1L,M; Figure S2D,E). IL-33-induced ILC2 proliferation was also inhibited by dbcAMP (Figure 1N), indicating CGRP activation of cAMP-signaling pathways can modulate ILC2 responses.
CGRP does not inhibit inflammatory ILC2s in vitro
Recent work has highlighted a distinct population of IL-25-induced inflammatory ILC2s (iILC2s) in both the lung and intestine that play an important role in host defense (Huang et al., 2018). We had previously identified a distinct population (Figure S1D, Cluster 8) with an iILC2-like gene expression profile, i.e. relatively high Klrg1, Il6, and Il17a expression, and relatively low expression of Il1rl1, which encodes the IL-33 receptor ST2 (Figure 2A) (Huang et al., 2015; Huang et al., 2018; Wallrapp et al., 2017). Cluster 8 cells also had significantly lower Ramp1 expression than did other ILC2s (P<4.3x10-45, logistic regression, Wald test), and minimal Ramp3 expression (Figure 2B). We confirmed reduced Ramp1 expression in iILC2s by isolating lung-resident natural ST2+ ILCs (nILC2s) and KLRG1hi ST2- ILCs (iILC2s) from IL-25-treated mice (Figure 2C, Figure S3). Ramp1 and Calcrl expression was extremely low in iILC2s compared to nILC2s by qPCR (Figure 2D), suggesting that iILC2s may not be inhibited by CGRP, since they lack receptor expression.
We confirmed that iILC2s are less CGRP-responsive by culturing iILC2s with either 33 or IL-25 with or without CGRP (Figure 2E). CGRP did not inhibit IL-IL-25- or IL-33-induced Il5 or Il13 expression in iILC2s (Figure 2F,G). Thus, while CGRP inhibits type 2 cytokine production by ST2+ nILC2s, iILC2s do not express the CGRP receptor and are not inhibited by CGRP in vitro.
CGRP induces transcriptional changes and a revised chromatin landscape
We profiled how CGRP altered expression and chromatin accessibility in IL-33-activated ILC2s. By 6 hours, CGRP markedly altered the chromatin landscape of ILC2s. Of the 92,814 accessible regions detected in ILC2s activated with or without CGRP, 9,760 were significantly modified by CGRP (P<0.05, Wald test) (Figure 3A, Table S3). CGRP also altered the transcriptional response of ILC2s to IL-33 (Figure 3B, Table S2A) (>2,691 differentially expressed genes; FDR-adjusted P<0.05, Wald test; fold change >1.5; STAR Methods), actively inducing a distinct transcriptional state: half of the differentially expressed genes were up-regulated by IL-33+CGRP, compared to IL-33 alone.
Many of the transcriptionally regulated genes (e.g., Ramp3, Calca, Il5 and Il13) also had significant, consistent changes in chromatin accessibility (596 of 1,911 genes with increased expression were near regions of increased chromatin accessibility; 894 of 1685 genes with decreased expression were near regions of decreased chromatin accessibility; P< 1.96x10-194, hypergeometric test; Figure 3B,C, S4A). Genes with increased expression and accessibility included Crem, which is downstream of cAMP signaling (Foulkes et al., 1996), Il1rl1, and genes associated with metabolism (e.g., Odc1) or hypoxia (e.g., Hif1a) (Figure 3B). CGRP also enhanced chromatin accessibility and transcription of Ramp3 and Calca, indicating that CGRP
regulates its own expression in ILC2s (Figure 3B,C). Notably, CGRP enhanced chromatin accessibility of Il5 while reducing accessibility of Il13 (Figure 3B,C), mirroring the increased Il5 expression and reduced Il13 expression at 6 hours (Figure 3B). Ramp3, Calca, Crem, and Il5 were among the top 15 differentially expressed genes in ILCs treated with only CGRP for 6 hours (Table
S2B). Overall, the coherent CGRP-induced changes in chromatin accessibility suggest that CGRP
reprograms ILC2s and leads to sustained changes in long-term gene expression.
We assessed the long-term effects of CGRP on ILC2s by analyzing gene expression profiles after 3 days of culture with CGRP and IL-33 or IL-33 alone (Figure 3D, Figure S4B, Table S2C). A significant number of the CGRP-induced changes in expression seen at 6 hours were still present (with the same directionality) after 3 days (P< 2.89x10-150, hypergeometric test, Table S2D). CGRP continued to promote a distinct transcriptional state, as 635 of 946 differentially expressed genes were up-regulated by IL-33 and CGRP, compared to IL-33 alone. Differentially expressed genes were enriched in GO terms such as leukocyte chemotaxis (e.g., Sell, S1pr1, Ccr7), lipid storage (e.g., Dgat1, Dgat2, Hilpda), and regulation of cell activation (e.g., Icos, Tnfaip3, Ikzf3) (Figure S4C, Table S4, STAR Methods). However, there were exceptions where expression was induced after 6 hours and reduced after 3 days (e.g. Il5, Serpinb1a, or Tgfa) (Figure 3D). Genes such as Ccl1, Nr4a1 or Tnfsf4, exhibited the inverse pattern, i.e. were initially down-regulated but induced later.
CGRP induces a regulatory expression program in ILC2s in vitro
At both time points, CGRP-induced genes were significantly enriched in genes associated with regulatory CD4 T cells or with negative regulation of effector T cell responses, such as the cell
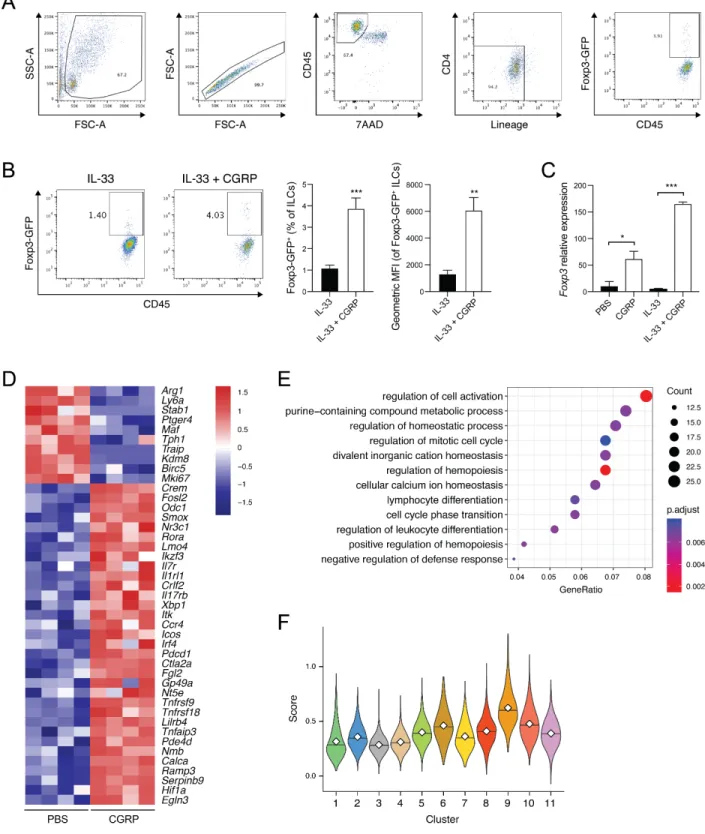
surface molecules Pdcd1 (PD-1), Havcr2 (Tim-3), Lilrb4, Entpd1 (CD39) and Tnfrsf18 (GITR) (P< 1.1x10⁻⁶, hypergeometric test; Figure 3B,D,E, Table S2, STAR Methods) (Chihara et al., 2018). Similarly, the transcription factors Foxp3, Nfil3, and Nr3c1 and the soluble mediator Fgl2 were upregulated (Figure 3B,D,E). Chromatin accessibility was also increased at the loci of most of these genes (Pdcd1, Tnfrsf18, Lilrb4, Entpd1, Nfil3, Nr3c1, and Fgl2) (Figure 3B, Figure S4A,
Table S3). To verify that IL-33+CGRP induced Foxp3 expression at the protein level, we cultured
lung ILCs from FoxP3-GFP reporter mice with IL-33+CGRP. After 3 days a small (~4%) but consistent fraction of ILCs expressed FoxP3, versus only ~1% of ILCs cultured with IL-33 alone (Figure S5A,B). We also detected Foxp3 expression in ILCs from Rag2-/- mice after culture with IL-33+CGRP (Figure S5C). Thus, CGRP may inhibit ILC2 function by inducing cell surface molecules and transcription factors associated with T cell regulation or dysfunction.
CGRP induced the regulatory program even in the absence of IL-33 (Figure S5D). Fewer differentially expressed genes (331 vs. 946 genes) were seen with CGRP alone, but one third of them (112 genes; P<2.0x10-47, hypergeometric test) overlapped with the CGRP+IL-33 condition (Table S2E), including most negatively regulatory genes (e.g., Pdcd1, Lilrb4, Fgl2, Nr3c1, and Tnfrsf18) (Figure S5D). GO terms associated with cell cycle progression were also enriched for down-regulated, differentially expressed genes (e.g., Mki67, Birc5, Kdm8) (Figure S5D,E, Table
S4), consistent with CGRP inhibiting alarmin-driven proliferation (Figure 1K). Thus, CGRP
impacts ILC2 gene transcription and chromatin organization, inducing genes known to negatively regulate T cells and inhibiting genes promoting proliferation and effector function.
In vivo administration of CGRP limits alarmin-induced airway inflammation
To assess whether ILC2s respond to endogenous CGRP in vivo, we generated a gene signature based on the transcriptional response of ILCs cultured with IL-33+CGRP in vitro (Table S5,
STAR Methods) and used it to score cells from the previously published scRNA-seq dataset
(Wallrapp et al., 2017). Cells of cluster 9, which is primarily composed of ILCs from IL-33 treated mice (1,214/1,467 cells), scored significantly higher for this signature, compared to those of the other clusters (FDR-adjusted P<2.2x10-308 linear regression, Wald test) (Figure 3F, Figure S5F,
STAR Methods) and expressed more Calca and Ramp3 (Figure S1E,H). Thus, we hypothesize
that these ILCs represent a population exposed to endogenous CGRP.
To test the in vivo role of CGRP in ILC-driven inflammation we treated mice with PBS, CGRP, IL-33 or IL-33+CGRP for 3 days and assessed airway inflammation (Figure 4A). While the frequency or total number of lung-resident ILCs was not altered by CGRP alone, compared to PBS, ILC frequencies and numbers were significantly reduced by 33+CGRP compared to IL-33 alone, indicating that CGRP inhibits IL-IL-33-induced ILC expansion in vivo (Figure 4B). The frequency of Ki67+ ILCs was also decreased by IL-33+CGRP compared to IL-33 alone (Figure
4C).
CGRP also inhibited production of type 2 cytokines by ILCs after IL-33 stimulation in vivo. Compared to 33 alone, CGRP and 33 significantly reduced the frequency of 5+ and IL-13+ ILCs (Figure 4D), lung Il5 and Il13 transcripts were significantly reduced (Figure 4E), and IL-5 and IL-13 protein was greatly diminished in lung homogenate and bronchoalveolar lavage fluid (BALF) (Figure 4F, Figure S6A). The frequency and number of eosinophils in both lung
tissue and BALF were also significantly decreased by CGRP (Figure 4G, Figure S6B). Moreover, IL-33-induced perivascular and peribronchial lymphocytic infiltrates in lung sections were reduced by CGRP (Figure 4H), and IL-33+CGRP-treated mice developed less airway hyperreactivity than mice treated only with IL-33 (Figure 4I). Thus, CGRP is a potent inhibitor of IL33-driven inflammation in vivo. We also examined papain-induced ILC2 responses in Calca+/+ and Calca-/- mice (Halim et al., 2012; Halim et al., 2014). Consistent with the effect of exogenous CGRP administration, there was significantly increased ILC2 proliferation and a trend towards increased ILC2 frequency in papain-treated Calca-/- mice (Figure 4J-L).
CGRP also inhibited ILC responses induced in vivo by IL-25+NMU, albeit more mildly. We treated mice with 25, 25+CGRP, 25+NMU or 25+NMU+CGRP (Figure S6C). IL-25+CGRP had no effect on ILC frequencies and numbers, but co-administration of CGRP with IL-25+NMU strongly reduced ILC frequency and number (Figure S6D). CGRP also significantly decreased IL-25+NMU-induced ILC proliferation, as assessed by Ki67 staining (Figure S6E). Compared to IL25+NMU, co-treatment with CGRP also diminished expression of type 2 cytokines at the mRNA level in the lung (Figure S6F), reduced IL-13 protein in both lung tissue and BALF, and there were trends towards reduced IL-5 protein expression (Figure S6G,H) and decreased BALF eosinophil frequency and number (Figure S6I). Thus, while CGRP more potently inhibits IL-33-driven ILC2 responses, it also inhibits IL-25+NMU-induced ILC activation in vivo.
CGRP inhibition of ILC2s is independent of T cells
To test if CGRP inhibits ILC2 activation independently of adaptive immune cells, we analyzed the effect of CGRP on IL-33-induced airway inflammation in Rag2-/- mice (Figure 5A). Total
numbers of lung ILCs were significantly reduced in IL-33+CGRP treated mice compared to IL-33 alone, and there were trends towards lower frequencies of both ILCs and Ki67+ ILCs (Figure
5B,C). Although the frequency of IL-5+ ILCs was not different, the frequency of IL-13+ ILCs was
significantly lower in IL-33+CGRP-treated mice (Figure 5D). Compared to IL-33 alone, treatment with 33+CGRP also significantly reduced Il5 and Il13 transcripts in the lung (Figure 5E), IL-5 and IL-13 protein concentration in lung homogenates and BALF (Figure IL-5F,G), and eosinophil numbers in the lung and BALF (Figure 5H,I). Histopathological analysis also showed that IL-33+CGRP reduced lymphocytic infiltrates in lung sections of Rag2-/- mice, compared to IL-33 alone (Figure 5J). Thus, CGRP negatively regulates alarmin-driven ILC2 responses independently of adaptive immunity.
CGRP largely reverts the IL33 induced program in vivo
To characterize the transcriptional response of ILC2s to CGRP at the single-cell level, we analyzed 31,053 lung ILCs from mice treated with PBS, CGRP, IL-33 or IL-33+CGRP by scRNA-seq (Figure 6A, Figure S7A-D). CGRP alone had little impact on the distribution of ILCs overall (Figure 6A) and across 16 clusters (Figure 6B,C), while IL-33 caused a dramatic shift (P<5.38x10-132, Dirichlet multinomial regression, Wald test). Cells from IL33+CGRP treated mice were largely albeit not completely (P<6.38x10-37, Dirichlet multinomial regression, Wald test) shifted back to their control distribution, including in non-ILC2 clusters (Figure 6A-C, Figure
S7E). ILC2s from CGRP-treated mice mostly co-localized with control ILC2s, suggesting that
CGRP alone minimally affected ILC2 transcriptional profiles (Figure 6A,C,D). Three clusters (3, 4, and 9) were predominantly (84 89%) comprised of IL-33-treated ILC2s, whereas IL-33+CGRP
ILC2s mostly clustered with PBS- or CGRP-treated ILC2s, indicating the extent to which CGRP inhibited ILC2 activation in vivo (Figure 6D, Figure S7F).
Consistent with known effects of IL-33, relative to the PBS-dominated cluster (cluster 2), clusters 4 and 9 scored highly for a proliferative gene signature and, along with cluster 3, were more likely to express Il13 (P<7.9x10-203) and Il5 (clusters 3 and 4 only, P<2.1x10⁻¹⁴) (logistic regression, Wald test; Figure 6E,F, Figure S7G). Each of these clusters had a distinct expression profile (Figure 6G, Table S6): cluster 4 strongly up-regulated genes associated with cell cycle (e.g., Mki67, Cdk1, Birc5), cluster 9 expressed genes associated with antigen presentation (e.g., H2-Ab1, Cd74), and cluster 3 expressed genes associated with effector ILC2s (e.g., Arg1, Ly6a, Il5, and Il13). Conversely, ILC2s from the IL-33+CGRP condition had dramatically different expression profiles from those of ILC2s from the IL-33 condition, with significantly reduced proliferative signature scores and less frequent Il13 expression (P<2.2x10-308, linear and logistic regression, Wald test; Figure 6E,F, Figure S7G). While 33+CGRP ILC2s comprised only 7 14% of IL-33 dominated clusters, they contributed 41 49% of cells in clusters 5, 6 and 12, which also contained PBS or CGRP ILCs (Figure S7F). Clusters 5, 6, and 12 express genes associated with tissue repair (e.g., Areg) and cAMP signaling (e.g., Atf3) and several chemokines (e.g., Cxcl1, Cxcl2, Ccl1) (Figure 6G, Table S6).
Of note, Cluster 11 highly expressed Calca and Ramp3, as well as genes associated with regulatory phenotypes, consistent with our in vitro findings with IL-33+CGRP. These also included immune checkpoint genes (e.g., Pdcd1, Tnfrsf18, Tnfrsf9, Fgl2, Lilrb4a) (Figure 6H, Table S6) (Chihara et al., 2018) and cAMP signaling (Crem), suggesting that these ILC2s encountered CGRP in vivo.
While ILC2s from IL-33+CGRP-treated mice are a plurality of cluster 11, ILC2s from the other conditions are also present in this cluster, suggesting that ILC2s actively respond to endogenous CGRP. We observed Foxp3 expression in a tiny fraction of ILCs, which was significantly increased in mice treated with IL-33+CGRP, compared to the other conditions (P<0.005, logistic regression, LRT; Figure S7H).
Ramp1 is required for regulation of ILC2 responses by CGRP
To investigate how endogenous CGRP regulates ILC2-mediated airway inflammation, we analyzed wildtype and Ramp1-/- mice at steady-state and after IL-33 treatment. Ki67+ ILC frequency was significantly increased at steady state in Ramp1-/- mice, compared to controls, as were the frequencies of IL-5+ and IL-13+ ILCs (Figure 7A,B), indicating that CGRP is an important basal regulator of ILC proliferation and cytokine production in vivo. The frequency and number of eosinophils were also significantly elevated in naive Ramp1-/- mice (Figure 7C). Moreover, after IL-33 challenge, Il5 and Il13 expression was increased in the lungs of Ramp1 -/-mice, as was the frequency of lung eosinophils, indicating exaggerated alarmin responses in Ramp1-/- mice (Figure 7D-F).Finally, exogenous CGRP failed to inhibit IL-33-induced lung Il5 and Il13 expression, eosinophilia, and ILC2 expansion in Ramp1-/- mice, in contrast to controls (Figure 7D-G). Thus, Ramp1 is required for CGRP to inhibit ILC2 responses in vivo.
DISCUSSION
We and others recently demonstrated that neurons regulate ILC2 responses to allergens and helminths via neurotransmitters such as neuromedin U, vasoactive intestinal peptide, and epinephrine (Cardoso et al., 2017; Klose et al., 2017; Moriyama et al., 2018; Nussbaum et al.,
2013; Talbot et al., 2015; Wallrapp et al., 2017). To elucidate additional neuroimmune pathways that regulate ILC2s, we analyzed neuropeptide receptor expression on ILC2s. Lung-resident ILC2s expressed both CGRP and its receptor. CGRP inhibited in vitro ILC2 proliferation and effector function and induced genes associated with T cell dysfunction. In vivo, CGRP treatment reduced acute airway inflammation by inhibiting ILC2 responses, even in the absence of adaptive immune cells, indicating CGRP negatively regulates ILC2s.
Previous studies investigated the role of CGRP in regulating type 2 lung inflammation and, in contrast to our findings, report decreased airway hyperreactivity following OVA challenge in mice lacking Ramp1 or CGRP (Aoki-Nagase et al., 2002; Li et al., 2014). Li et al. found that deleting Calcrl specifically in smooth muscle cells decreases airway hyperreactivity similar to observations in Ramp1-/- mice (Li et al., 2014), consistent with CGRP directly inducing human bronchial smooth muscle contraction (Springer et al., 2004). The effects of CGRP on smooth muscle therefore appear distinct from its immunomodulatory role on ILC2s. Although ILC2s highly expressed Ramp1 at steady-state and during lung inflammation, significant expression of Ramp1 and Calcrl was seen in other cell types, indicating that ILCs are not the only CGRP-responsive cell type.
CGRP has pleiotropic effects on immune responses and affects both immune and non-immune cells. For instance, CGRP enhances IL-33-induced IL-5 production by ILCs in the short term, thus promoting inflammation (Sui et al., 2018). In contrast, it can also inhibit pro-inflammatory myeloid cells (Baliu-Pique et al., 2014; Chiu et al., 2013; Harzenetter et al., 2007; Jusek et al., 2012). We have previously found that CGRP inhibits cytokine production during lung S. aureus infection and opsophagocytic killing of bacterial pathogens by neutrophils (Baral et al., 2018; Pinho-Ribeiro et
al., 2018). While here CGRP acutely enhanced ILC2 IL-5 production, it inhibited IL-13 at all time points and overall CGRP inhibited ILC2-mediated inflammation in vitro and in vivo.
CGRP is expressed by sensory neurons and pulmonary neuroendocrine cells (PNECs), which are specialized epithelial cells that sense hypoxia and produce neurotransmitters and soluble mediators (Domnik and Cutz, 2011; Linnoila, 2006). A recent study found that genetic ablation of PNECs decreases allergen-induced lung inflammation, and linked this to PNEC expression of CGRP (Sui et al., 2018). However, decreased lung inflammation may be due to loss of other factors produced by PNECs. This study also reports that deletion of Calcrl in Il5-expressing cells does not alter the ILC2 frequency but does reduce the frequency of lung-infiltrating CD4+ T cells and eosinophils. Developing genetic approaches to specifically target CGRP signaling in ILC2s versus Th2 cells could provide insight into how CGRP affects these cell types.
Our finding that ILC2s express CGRP in the lung suggests that CGRP may potentially act as an autocrine or paracrine regulator, or as a mechanism by which ILC2s modulate other CGRP-responsive cells. CGRP not only upregulated its own expression in ILC2s but also upregulated genes associated with inhibition of effector lymphocyte responses, including a negative regulatory gene module (Pdcd1, Tnfrsf18, Entpd1, Lilbr4, Tnfrsf9, and Icos) recently demonstrated to be induced by IL-27 in T cells (Chihara et al., 2018). The same co-inhibitory gene module, induced by different stimuli, may thus inhibit ILC2 function.
Binding of CGRP to its receptor generates cAMP (Russell et al., 2014), and chronically elevated cAMP promotes T cell anergy (Powell et al., 1999), consistent with cell-soluble cAMP
recapitulating CGRP s effects. In ILCs cultured with CGRP, we observed increased expression of genes involved in negative feedback of cAMP signaling, including phosphodiesterase 4D (Pde4d), which breaks down cAMP, and the transcription factor Crem, which can negatively regulate transcription (Raker et al., 2016). PDE4 inhibitors have been approved for treating chronic inflammatory diseases, such as atopic dermatitis and chronic obstructive pulmonary disease, providing additional evidence that increases in intracellular cAMP inhibit inflammation (Li et al., 2018). Additionally, 2 adrenergic receptor agonists, which also increase cAMP, have recently been shown to dampen ILC2 type 2 cytokine production and proliferation (Moriyama et al., 2018). In contrast, Nmur1 signals via G q proteins that induce calcium influx and activate phospholipase C, resulting in ILC2 stimulation (Cardoso et al., 2017; Klose et al., 2017). These data suggest that the modulation of cAMP is a critical pathway by which CGRP inhibits ILC2 activation.
Finally, our data show that by negatively regulating ILC2 responses, CGRP limits acute airway inflammation. Elucidating the role of CGRP in chronic lung inflammation will be an important area of future research, particularly in light of the recent approval of humanized monoclonal antibodies that inhibit either CGRP or the CGRP receptor (Goadsby et al., 2017; Silberstein et al., 2017). Although no asthma-related adverse events were reported in the phase 3 clinical trials of these antibodies (Goadsby et al., 2017; Silberstein et al., 2017), the possibility that these agents could enhance ILC2 responses and promote type 2 inflammation clearly warrants close monitoring as they enter widespread clinical use. Our study also highlights that activation of the CGRP receptor may represent a therapeutic strategy in allergic diseases.
Acknowledgments
We thank Junrong Xia, Guangli Zhu, Dan Dubinsky, Deneen Kozoriz, Helene Stroh and the Dana Farber Cancer Institute Rodent Histopathology Core for technical assistance. Mark Zylka and Eric McCoy (University of North Carolina) originally generated the CGRP-GFP reporter mice. Felipe Pinho-Ribeiro bred the mice at Harvard Medical School. A.W. is a PhD student who is jointly supervised by V.K.K. and Hans-Martin Jäck (Friedrich-Alexander University of Erlangen-Nürnberg, Erlangen, Germany) and has been supported by a Boehringer Ingelheim Fonds PhD fellowship. P.R.B. (1K08AI123516), R.E.A. (1K08HL130540), P.I.T. (F32AI138458), B.D.L. (R01 HL122531), I.M.C. (R01 AI130019) and V.K.K (R01 AI139536) are supported by the N.I.H. A.R. is supported by the Howard Hughes Medical Institute. We also acknowledge the support of the Food Allergy Scientific Initiative (A.R. and V.K.K.) and the Klarman Cell Observatory (A.R.) at the Broad Institute. A.R. is an HHMI Investigator.
Author Contributions
P.R.B. and V.K.K. conceived the study. A.W., P.R.B., S.J.R., V.K.K. and A.R. designed the experiments and interpreted the results. A.W., P.R.B. and S.K. performed and analyzed functional biological experiments, with assistance from P.K. S.J.R. designed and performed the computational analysis, with assistance from C.L. and R.H. E.C. performed bulk-RNA-seq. A.S. performed ATAC-seq and P.I.T. analyzed the data. R.A.E. and B.D.L. assisted with measuring airway resistance. K.T. generated Ramp1-/- mice. R.J.X. provided scientific advice for the project. I.C. provided CGRP-GFP mice and neuro-immunology expertise. The manuscript was written by A.W., P.R.B. and S.J.R., and was edited by A.R. and V.K.K., with input from all authors.
Declaration of Interests
A.R. is an SAB member of ThermoFisher Scientific, Neogene Therapeutics, and Syros Pharmaceuticals. A.R. and V.KK. are cofounders of and equity holders in Celsius Therapeutics. A.W., P.R.B., S.J.R., A.R. and V.K.K. are co-inventors on US provisional patent application no. 62/667,381 and A.R. and R.J.X. are co-inventors on US provisional patent application no. 62/818,404, which are both filed by The Broad Institute relating to CGRP signaling modulation. All other authors have no competing financial interests.
Figure Legends
Figure 1. CGRP inhibits type 2 cytokine expression and proliferation of ILC2s in vitro
(A) Lungs ILCs were isolated from C57BL/6J mice by fluorescence activated cell sorting (FACS) and cultured with IL-7 or IL-7+IL-33 with medium or CGRP.
(B-C) Il13 and Il5 expression in ILC2s cultured for 6 hours, determined by qPCR. Data points are technical replicates (n = 2). Data are representative of two independent experiments.
(D-E) Areg expression in ILC2s cultured for either 6 hours (D) or 3 days (E), determined by qPCR. Data points are technical replicates (n = 2). Data are representative of two (D) or three (E) independent experiments.
(F) Il13 and Il5 expression in ILCs cultured for 3 days, determined by qPCR. Data points are averages of technical replicates from four independent experiments.
(G) IL-13 and IL-5 concentration in 3 day ILC culture supernatants, determined by LegendPlex. Data points are averages of technical replicates from four independent experiments.
(H) Expression of IL-13 and IL-5 in ILCs cultured for 3 days, analyzed by flow cytometry. Representative flow cytometry plots, frequency and geometric mean fluorescence intensity (MFI) of IL-5 and IL-13 are shown. Data points are technical replicates (n = 2). Data are representative of two independent experiments.
(I) Il13 and Il5 expression in ILCs cultured with IL-25+NMU or IL-25+NMU+CGRP for 3 days, determined by qPCR. Data points are technical replicates from one experiment. Data are representative of three independent experiments.
(J) IL-13 and IL-5 concentration in 3 day ILC culture supernatants, determined by LegendPlex. Data points are technical replicates from one experiment. Data are representative of three independent experiments.
(K) CellTrace Violet-labeled ILCs cultured for 3 days, analyzed by flow cytometry. Histograms (left) show CellTrace Violet dye dilution. Graph (right) shows the frequency of proliferating ILCs from 2-3 independent experiments.
(L) Il13 and Il5 expression in ILC2s cultured for 6 hours, determined by qPCR. Data are pooled from three independent experiments with two technical replicates each.
(M) Il13 and Il5 expression in ILCs cultured for 3 days, determined by qPCR. Data are pooled from three independent experiments with two technical replicates each.
(N) Cell Trace Violet-labeled ILCs were cultured for 3 days and proliferation was analyzed by flow cytometry. Data are representative of two independent experiments.
Data shown as the mean ± s.e.m. *P <0.05; **P <0.01; ***P <0.001; ns, not significant; by either unpaired t test (B-J, L, M) or unpaired ANOVA (K). Please see also Figure S2.
Figure 2. Inflammatory ILC2s express less Ramp1 and do not respond to CGRP
(A-B) Expression of the indicated genes in ILCs by cluster (as shown in Figure S1D) as determined by scRNA-seq. Violin plots show expression of Klrg1, Il6 Il1rl1, and Il17a (A), or Ramp1 and Ramp3 (B) by cluster (x axis). *P<4.3x10-45, logistic regression, Wald test.
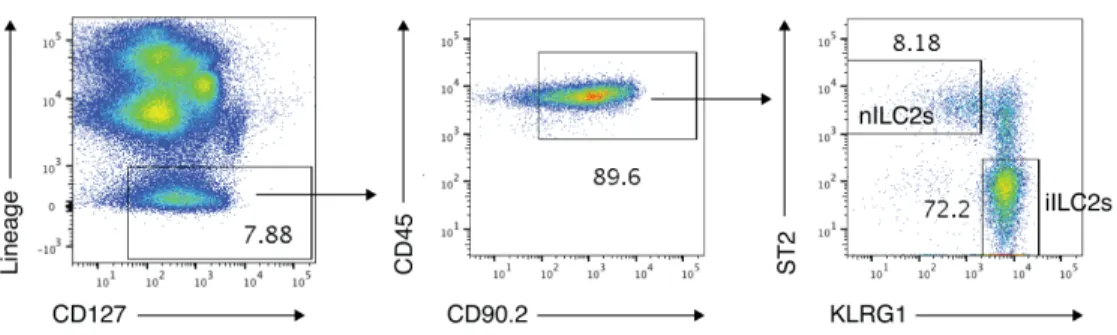
(C) IL-25 was given intraperitoneally for three consecutive days. Natural ILC2s (ST2+ KLRG1- ILCs; nILC2s) and inflammatory ILC2s (ST2- KLRG1+ ILCs; iILC2s) were then isolated. (D) Ramp1, Ramp3 and Calcrl expression in different ILC subsets, determined by qPCR. Data points are technical replicates from one experiment. Data are representative of two independent experiments.
(F-G) Il5 and Il13 expression in iILC2s, determined by qPCR. Data points are technical replicates from one experiment. Data are representative of two independent experiments.
For panels (D,F,G) data are shown as the mean ± s.e.m. *P <0.05; **P <0.01; ns, not significant; by either unpaired ANOVA (D) or unpaired t test (F,G). Please see also Figure S3.
Figure 3. CGRP modulates ILC activation and induces a regulatory gene module
(A) ILC2s cultured for 6 hours with IL-33 or IL-33+CGRP were profiled by ATAC-seq. Accessible regions are mapped as z-scores of normalized peak counts taken across columns (n = 3).
(B) ILC2s cultured for 6 hours with IL-33 or IL-33+CGRP were analyzed by ATAC-seq and bulk RNA-sequencing (RNA-seq). Heatmap of significant fold changes (>1.5, color) in expression (left column) of genes (rows) in ILC2s cultured with IL-33+CGRP versus IL-33 (FDR-adjusted P<0.05, generalized linear regression, Wald test). Fold changes in chromatin accessibility (right) are shown for the ATAC-seq peak corresponding to the respective gene by GREAT. When multiple peaks were assigned to a gene, the peak with the most significant change between ILC2s cultured with IL-33+CGRP versus IL-33 was shown (FDR-adjusted P<0.05, Wald test).
(C) Chromatin accessibility in ILC2s treated with IL-33 (upper track of each set) or IL-33+CGRP (lower track of each set) is shown for the Calca, Il5 and Il13 loci.
(D) ILCs cultured for 3 days with IL-33 or IL-33+CGRP were analyzed by bulk RNA-seq. Heatmap of significant fold changes (>1.5, color) in expression of genes (rows) in ILC2s cultured with IL-33+CGRP versus IL-33 for 6 hours (upper row, cultured as described in B) or 3 days (lower row). (FDR-adjusted P<0.05, generalized linear regression, Wald test.)
(E) Heatmap of expression (color), z-scored by row, of selected pro-inflammatory and regulatory genes (rows) that exhibit a significant fold change (>1.5) in expression of at least 1.5 in ILCs cultured with IL-33 (left) versus IL-33+CGRP (right) for 3 days. Each column represents one replicate. (FDR-adjusted P<0.05, generalized linear regression, Wald test.)
(F) tSNE plot of published single-cell RNA-seq data, as in Figure S1C,D, shows ILCs (dots) isolated from PBS-, IL-25- or IL-33-treated mice, colored by score of CGRP signature.
Please see also Figure S4 and S5.
Figure 4. CGRP dampens IL-33-induced airway inflammation
(A) PBS, CGRP, IL-33 or IL-33+CGRP were administered nasally daily for 3 days. (B) Frequency (left) and number (right) of lung ILCs, determined by flow cytometry. (C) Frequency of Ki67+ lung ILCs, determined by flow cytometry.
(D) Frequency of IL-5+ and IL-13+ lung ILCs, determined by flow cytometry. (E) Il5 and Il13 expression in lung tissue, determined by qPCR.
(F) IL-5 and IL-13 concentration in BALF, determined by LegendPlex.
(G) Eosinophil frequency and number in BALF, determined by flow cytometry.
(H) Representative H&E stained lung sections from mice treated with PBS, CGRP, 33 or IL-33+CGRP (left). Graph (right) shows severity score for individual mice (n = 9) from three independent experiments. Scale bars represent 100 m.
(I) Airway resistance was assessed in IL-33- or IL-33+CGRP-treated mice in response to methacholine challenge. Data points represent the mean of individual mice from two independent experiments (IL-33, n = 9; IL-33+CGRP, n = 9).
(J) Calca+/+ and Calca-/- mice were treated nasally with papain for three days. (K) Frequency of Ki67+ lung ILCs, determined by flow cytometry.
(L) Lung ILC frequency, determined by flow cytometry.
Data points are individual mice pooled from three independent experiments (n = 9) in panels B and E-G and from two independent experiments (n = 6) in panels C and D. Data points are individual mice pooled from three independent experiments (n = 11) in panel K and from four independent experiments (n=15) in panel L. Data are shown as the mean ± s.e.m. *P <0.05; **P <0.01; ***P <0.001; ns, not significant; by either unpaired ANOVA (B-H) or unpaired t test (I, K, L). Please see also Figure S6.
Figure 5. CGRP negatively regulates ILC2 responses in vivo independent of adaptive immunity
(A) Nasal administration of IL-33 or IL-33+CGRP to Rag2-/- mice for three consecutive days. (B) Frequency (left) and number (right) of lung ILCs, determined by flow cytometry.
(C) Frequency of Ki67+ ILCs, analyzed by flow cytometry.
(D) Frequency of IL-5+ and IL-13+ lung ILCs, determined by flow cytometry. (E) Il5 and Il13 expression in lung tissue, determined by qPCR.
(F-G) IL-5 and IL-13 concentration in lung tissue (F) and BALF (G), determined by LegendPlex. (H-I) Frequency and number of eosinophils in lung tissue (H) and BALF (I), determined by flow cytometry.
(J) Lung sections were scored for disease severity in a blinded manner. Graph shows severity score for individual mice (n = 6) from two independent experiments.
Data points represent individual mice (n = 10) pooled from three independent experiments (B,D-I) or individual mice (n=6) from two independent experiments (C, J). Data are shown as the mean ± s.e.m. *P <0.05; **P <0.01; ***P <0.001; ns, not significant; by unpaired t test.
Figure 6. CGRP inhibits proliferative and inflammatory response of ILC2s to IL-33
(A,B) Uniform manifold approximation and projection (UMAP) embedding of 31,053 cells (dots) isolated from PBS-, CGRP-, IL-33-, or IL-33+CGRP-treated mice, colored by treatment condition (A) or by cluster (B).
(C) Bar plot of proportions (x axis) of cells from each cluster (color) per condition (y axis). (D) Bar plot of counts (y axis) of cells from each treatment condition (color) per cluster (x axis). (E) ILC2s were scored for expression of proliferation signature genes. Violin plots show distributions of proliferation signature scores (y axis) for each cluster (x axis).
(F) Violin plots show distributions of Il5 and Il13 expression (y axis, white diamond indicates mean) for each cluster (x axis).
(G) Dot plot visualizes the mean expression (color), z-scored by column, in positively expressing cells of selected significantly differentially expressed genes (x axis, Methods), per cluster (y axis). Dot size represents the proportion of cells in a cluster that express the gene.
(H) Violin plots show distributions of expression (y axis, white diamond indicates mean) in each cluster (x axis, color) of selected genes (rows) that are significantly differentially expressed in Cluster 11 (blue) compared with all other cells (Methods).
Figure 7. Increased type 2 immunity in Ramp1-/- mice
(A-G) WT mice were purchased from Jackson Laboratories and co-housed with Ramp1-/- mice for at least one week. (A-C) Naïve WT and Ramp1-/- mice.
(A) Frequency of Ki67+ lung ILCs, analyzed by flow cytometry.
(B) Frequency of IL-5+ and IL-13+ lung ILCs, determined by flow cytometry. (C) Lung eosinophil frequency and number, analyzed by flow cytometry.
(D-G) IL-33 or IL-33+CGRP were administered nasally to WT mice or Ramp1-/- mice for 3 days. (E) Il5 and Il13 expression in lung tissue, determined by qPCR.
(F) BALF eosinophil frequency, analyzed by flow cytometry. (G) Frequency of Ki67+ lung ILCs, determined by flow cytometry.
Data points are individual mice pooled from two independent experiments (n = 10, panels A-C or n= 6, panels E-G). Data are shown as the mean ± s.e.m. *P <0.05; **P <0.01; ***P <0.001; ns, not significant; by unpaired t-test.
Methods
CONTACT FOR REAGENT AND RESOURCE SHARING
Further information and requests for resources and reagents should be directed to and will be fulfilled by the Lead Contact, Vijay Kuchroo (vkuchroo@evergrande.hms.harvard.edu).
EXPERIMENTAL MODEL AND SUBJECT DETAILS
Animals
All experiments involving mice were approved by the Institutional Animal Care and Use Committee (IACUC) at Brigham and Women s Hospital. Mice were maintained in the animal facility at Brigham and Women s Hospital under specific pathogen-free conditions with food and water ad libitum and a 12-hour dark/light cycle. Mice were age- and sex-matched for experiments and were randomly assigned to experimental groups. C57BL/6J (WT) mice and Rag2-/- mice were purchased from the Jackson Laboratory. CGRP-GFP mice (McCoy et al., 2012) were provided by I. Chiu (Harvard Medical School, Boston). FoxP3-GFP mice (Bettelli et al., 2006) were generated in our laboratory. Calca-/- mice (Oh-hashi et al., 2001) were provided by Hiroki Kurihara (The University of Tokyo, Tokyo) and distributed by RIKEN BioResource Research Center. Ramp1 -/-mice (Tsujikawa et al., 2007) were provided by Wade Kingery (Veterans Affairs Palo Alto Health Care System) with permission by Kazutake Tsujikawa (Osaka University, Osaka).
Primary Cell Culture
Primary cells were cultured in a humidified incubator at 37°C and 10% CO2 in complete medium consisting of RPMI 1640 medium (Cat# 11875-119; Thermo Fisher Scientific) supplemented with 10% fetal bovine serum, HEPES, L-Glutamine, Penicillin/Streptomycin and ß-Mercaptoethanol.
METHOD DETAILS
Isolation of lung cells for fluorescence-activated cell sorting
Mice were euthanized and perfused with 8ml cold PBS via the right heart ventricle. Lung lobes were removed from the chest cavity and transferred into gentleMACS C tubes containing Buffer S and enzymes A and D from the lung dissociation kit (Cat# 130-095-927; Miltenyi Biotec). After manual dissociation of the tissue by running program lung_01 of the automated tissue dissociator (gentleMACS; Miltenyi Biotec), and digestion at 37°C for 25min on a rotator, the tissue pieces were further dissociated by running program lung_02 of the automated tissue dissociator. Subsequently, the single-cell suspension was passed through a 70um cell strainer and washed with DPBS (Cat# 14190-144; Thermo Fisher Scientific) containing 0.5% bovine serum albumin (Cat# BP1600-1; Fisher Scientific) and 2mM EDTA. After incubation of the cells with CD90.2 MicroBeads (Cat# 130-049-101; Miltenyi Biotec) on ice for 17min, cells were washed and transferred onto LS columns (Cat# 130-042-401; Miltenyi Biotec) to enrich for CD90.2-positive cells by positive selection. Then, positive and negative cell fractions were stained with surface antibodies for 20min on ice in the dark, washed and resuspended in 1-2ml DPBS containing 0.5% bovine serum albumin and 2mM EDTA. Cells were purified by fluorescence-activated cell sorting using a BD FACS Aria IIIu flow cytometer with 3 lasers (405nm, 488nm, 640nm) or 4 lasers (405nm, 488nm, 561nm and 640nm) (BD Biosciences). For subsequent cell culture, cells were sorted into complete medium. For RNA isolation, cells were directly sorted into RLT Plus lysis buffer (RNeasy Plus Mini Kit; Qiagen) or extraction buffer (PicoPure RNA Isolation Kit; Thermo Fisher Scientific). Debris and doublets were excluded for cell types using forward and sideward scatter. The CD90.2 positive cell fraction was used to sort innate lymphoid cells (ILCs) (7AAD-,
CD45+, CD90.2+, Lineage (CD3, CD4, CD8, CD11b, CD11c, CD19, NK1.1, TCR , TCR )-, CD127+ cells), ILC2s (ST2+ ILCs), CD4 T cells (7AAD-, CD45+, CD3+, CD4+, TCR + cells) and TCR T cells (7AAD-, CD45+, CD3+, CD4-, TCR -, TCR +). The CD90.2 negative fraction was used to sort B cells (7AAD-, CD45+, CD19+), eosinophils (7AAD-, CD45+, CD11b+, CD11c-/low, Siglec-F+, SSC-Ahi), neutrophils (7AAD-, CD45+, CD11b+, CD11c-, Siglec-F-, Ly6G+), macrophages (7AAD-, CD45+, CD11b+, CD11c+, F4/80+, Siglec-F+, MHC2+) and CD45- cells (7AAD-, CD45-). For the isolation of inflammatory ILC2s, single-cell suspension was enriched for lymphocytes by 40/70% Percoll gradient centrifugation instead of enrichment with CD90.2 beads. Inflammatory ILC2s were defined as 7AAD-, CD45+, CD127+, Lineage-, CD90.2int, ST2-, KLRG1+ cells and gated as shown in Figure S3.
Culture of innate lymphoid cells
Sort-purified innate lymphoid cells (ILCs) were cultured under sterile conditions in complete medium in a humidified incubator at 37°C and 10% CO2. ILCs were plated at a density of 3,000-5,000 ILCs per well in a 96 well round-bottom plate in complete medium with 20ng/ml IL-7. Depending on the experiment, different combinations of 200ng/ml IL-25, 200ng/ml IL-33, 1ug/ml NMU, 100nM CGRP or 100uM dibutyryl-cAMP were added either at start or after overnight culture with 20ng/ml IL-7. After 6 hours or 3 days, culture supernatant was removed and frozen at -20°C and ILCs were lysed in Extraction Buffer (PicoPure RNA isolation Kit; Thermo Fisher Scientific), incubated at 42°C for 30min and frozen at -80°C.
Proliferation assay
Lung cells were isolated and enriched for CD90.2 cells as described above, followed by labeling with CellTrace Violet (Cat# C34557; Thermo Fisher Scientific) according to manufacturer s instructions and subsequently stained with antibodies. After 3-day culture of sort-purified ILCs with 20ng/ml IL-7 either alone or in combination with 200ng/ml IL-33, 100pM CGRP or 100nM CGRP followed by staining, expression of CellTrace Violet in live (7AAD-) ILCs was analyzed on a BD LSRFortessa (BD Biosciences).
Airway inflammation
Mice received nasally 500ng IL-25, 500ng IL-33, 20ug NMU, 6.65ug CGRP or 50ug papain diluted in DPBS for three consecutive days. For nasal administration, mice were lightly anesthetized with Isoflurane (Cat# 07-893-1389; Patterson Veterinary). For induction of inflammatory ILC2s, mice received intraperitoneally 500ng IL-25 for three consecutive days. One day after the last treatment, mice were euthanized and perfused with 8ml cold DPBS via the right heart ventricle. After exposure of the trachea, a small incision was made at the top of the trachea and a curved gavage needle was inserted. Lungs were washed with 1.5ml cold PBS via the needle and the retrieved bronchoalveolar lavage fluid was centrifuged at 1300rpm for 5 min at 4°C. After centrifugation, the supernatant was frozen at -20°C and the cell pellet was resuspended in 250ul complete medium and stored on ice until flow cytometric analysis. The post-caval lung lobe was transferred into 10% buffered formalin and stored at room temperature until paraffin embedding for histological analysis. The other lung lobes were dissociated using the lung dissociation kit (Cat# 130-095-927; Miltenyi Biotec) and automated tissue dissociator (gentleMACS; Miltenyi Biotec) as described above with the adjustment that after running program lung_02, the single cell
suspension was centrifuged at 1300rpm for 5 min at 4°C and 1ml of the supernatant was frozen at -20°C. Single-cell suspension was resuspended in complete cell culture medium and stored on ice until further processing.
For RNA isolation, lung cells were centrifuged at 300g for 6 min at 4°C, the supernatant was discarded and the cell pellet was resuspended in 600ul RLT Buffer Plus (Qiagen RNA isolation kit), vortexed and frozen at -80°C.
For cell counts, lung cells were stained with 7AAD and Precision Count Beads (Cat# 424902; BioLegend) were added according to manufacturer s instructions. Cells and beads were acquired on a BD LSRFortessa (BD Biosciences) and cell numbers were calculated based on number of acquired live (7AAD-) cells and number of acquired beads.
For flow cytometric analysis, lung cells were transferred into a 96 well V-bottom plate and stained with surface antibodies for 20min at 4°C in the dark. Cells were washed twice with DPBS containing 2% fetal bovine serum and transferred into 1.2ml tubes for analysis by flow cytometry. For intracellular cytokine staining, cells were incubated in complete cell culture medium with 50ng/ml phorbol 12-myristate 13-acetate (Sigma-Aldrich), 1uM ionomycin (Sigma-Aldrich) and GolgiStop (Cat# 554724; BD Biosciences) for 5 hours and fixed and stained using the BD Fixation/Permeabilization Solution Kit (Cat# 554714; BD Biosciences) per manufacturer s instructions. For ki67 staining, cells were fixed with the Foxp3/Transcription Factor Staining Buffer Set (Cat# 00-5223-00; Invitrogen) per manufacturer s instructions. Cells were analyzed on a BD LSRFortessa (BD Biosciences) flow cytometer with 5 lasers (355nm, 405nm, 488nm, 561nm
and 640nm). Data was analyzed using FlowJo v10.5.0 software and cell populations were gated as described previously (Wallrapp et al., 2017).
RNA isolation and cDNA synthesis
RNA was isolated from lung cells and immune cell populations sorted from naïve mice using the Qiagen RNeasy Plus Mini Kit (Cat# 74134; Qiagen) according to manufacturer s instructions. RNA concentration and purity were determined with a NanoDrop spectrophotometer (Thermo Fisher Scientific) and equal amounts of RNA were reverse transcribed to cDNA using the iScript cDNA Synthesis Kit (Cat# 1708891; Bio-Rad). RNA was isolated from cultured ILCs or ex vivo sort-purified ILCs with the PicoPure RNA isolation kit (Cat# KIT0204; Thermo Fisher Scientific) according to manufacturer s instructions and subsequently reverse transcribed to cDNA with the SuperScript IV VILO Master Mix (Cat# 11756050; Thermo Fisher Scientific). To analyze gene expression TaqMan Fast Advanced Master Mix (Cat# 4444557; Thermo Fisher Scientific) was used per manufacturer s directions and quantitative real-time PCR was performed with a ViiA 7 system (Thermo Fisher Scientific). Gene expression was normalized to expression of the housekeeping gene Actin-b. The following TaqMan probes were used: Il5 (Mm00439646_m1), Il13 (Mm00434204_m1), Ramp1 (Mm00489796_m1), Ramp3 (Mm00840142_m1), Calcrl (Mm00516986_m1), Calca (Mm01274759_g1), Areg (Mm00437583_m1), Foxp3 (Mm00475162_m1) and Actb (Cat#4352341E; Thermo Fisher Scientific).
Bead-based immunoassay
Cytokine concentrations in bronchoalveolar lavage fluid, lung tissue and ILC culture supernatant were determined using the LEGENDplex mouse Th cytokine panel (Cat# 740005; BioLegend) or
mouse Th2 cytokine panel (Cat# 740027; BioLegend) according to manufacturer s instructions. Samples were acquired using a BD LSRFortessa flow cytometer (BD Biosciences) and analyzed with the LEGENDplex Software v7.1.
Methacholine assay
Mice were anesthetized and a 20G needle was inserted into the trachea and connected to a flexiVent FX1 instrument (SCIREQ). Mice were exposed to increasing doses of aerosolized methacholine (0, 3, 10, 30, 100mg/ml diluted in DPBS) and airway resistance was measured. For each dose the airway resistance was calculated as the mean of 8 measurements.
Histology
Lung tissue was fixed in 10% buffered formalin at room temperature and embedded in paraffin. After sectioning, lung slices were stained with hematoxylin and eosin (H&E) and scored for severity of airway inflammation by a histopathologist in a blinded manner according to the following scoring system: 0, normal; 1, very mild; 2, mild; 3, moderate; 4, severe.
ATAC-seq
ILC2s were cultured as described above for 6 hours with IL-33 or IL-33+CGRP. Subsequently, 6,000 viable ILC2s were sorted into DPBS supplemented with 2% FCS. Cells were pelleted by centrifugation and stored in BambankerTM cell freezing media (LYMPHOTEC Inc.) at -80 C. For ATAC-seq library preparation, cells were thawed at 37 C, washed once with PBS, and lysed and tagmented in 1X TD Buffer, 0.2ul TDE1 (Illumina), 0.01% digitonin, and 0.3X PBS in 40ul reaction volume following the protocol described in Corces at al. (Corces et al., 2016).
Transposition was performed at 37 C for 30 min at 300 rpm. The DNA was purified immediately with the MinElute PCR purification kit (Qiagen). The complete eluate was then amplified with PCR, as follows. First, 5 cycles of pre-amplification were performed using indexed primers with NEBNext High-Fidelity 2X PCR Master Mix (NEB). The number of additional cycles was assessed by SYBR Green quantitative PCR. After purifying the final library with the MinElute PCR purification kit (Qiagen), the library was quantified with the Kapa Library Quantification Kit (Kapa Biosystems) and a Qubit dsDNA HS Assay kit (Invitrogen). Libraries were sequenced on an Illumina NextSeq 550 system with paired-end reads of 37 base pairs in length.
ATAC-seq data processing
Read alignment, filtering, visualization of signal tracks, and measurement of quality control metrics was performed using a publicly available ATAC-seq pipeline (Lee et al., 2016). Briefly, reads were aligned to the mm10 genome using Bowtie2 and filtered to remove duplicates and mitochondrial reads. Alignment files were merged for biological replicates for peak-calling using MACS2 (Zhang et al., 2008). Read counts per peak were compiled using the bedtools multicov tool. Counts were normalized and processed for differential peak accessibility between conditions using DESeq2 (Love et al., 2014). Gene annotation with putative regulatory elements was performed using GREAT with default parameters (McLean et al., 2010). Briefly, genes were assigned a minimum basal regulatory domain from -5 kb to +1 kb from the transcription start site and extending up to the nearest gene s basal regulatory domain. ATAC-seq peaks were assigned to any gene with an intersecting regulatory domain as a potential regulatory element of that gene (Table S3).
Previously published single-cell RNA-Seq data
Processed scRNA-Seq data was obtained from our earlier study (Wallrapp et al., 2017), without any change to processing, using the same expression values and cluster assignments as previously reported. In particular, log-transformed normalized gene expression levels, referred to as log TPX, were calculated by calling Seurat s LogNormalize() function with the scale set to reflect the expected number of UMIs in each condition. That is, for cells in condition c and batch i to, the scale.factor argument was set to 10, 000 × (wc,i/meani(wPBS,i)), where wc,i is the mean number of
UMIs per cell in condition c and batch i (Wallrapp et al., 2017).
Bulk RNA-seq
ILCs were plated in replicates and cultured as described above for 3 days and RNA was isolated using PicoPure RNA isolation kit according to manufacturer s instructions. Two replicates from each of two distinct experiments were subsequently sequenced. RNA was quantified using a Qubit RNA HS Assay kit (Invitrogen) and quality accessed with a RNA 6000 Pico Kit (Agilent). 2ng of RNA were used as input for a modified SMART-Seq2 protocol (Picelli et al., 2014) entailing RNA ec nda c e dena a i n (72 C f h ee min e ), e e e transcription with Maxima Reverse Transcriptase (Life Technologies), and whole transcriptome amplification (WTA) with KAPA HiFi HotStart ReadyMix 2X (Kapa Biosystems) for 12 cycles. WTA products were purified with Ampure XP beads (Beckman Coulter), quantified with a Qubit dsDNA HS Assay Kit (Invitrogen), and quality accessed with a High Sensitivity DNA Chip run on a Bioanalyzer 2100 system (Agilent). 0.2 ng of purified WTA product was used as input for Nextera XT DNA Library Preparation Kit (Illumina). Uniquely barcoded libraries were pooled and sequenced with a NextSeq 500 sequencer using a high output V2 75 cycle kit (Illumina) and 2x38 paired end reads.
Bulk RNA-seq data processing
Raw data was converted to fastq files using bcl2fastq 2.17.1.14 with options --minimum-trimmed-read-length 10 --mask-short-adapter-reads 10 . Transcript quantification was done using Kallisto 0.42.3 (Bray et al., 2016) with the mm10 mouse genome annotation, and transcript counts were then converted to gene counts and normalized TPM values using the R package tximport (Soneson et al., 2015).
Bulk RNA-seq analysis
Differential expression was analyzed using the DESeq2 R package (Love et al., 2014). At each time point, gene expression was modeled as a sum of the effects of the condition and of the batch, i.e., date of the experiment. For the joint analysis of both time points, gene expression was modeled as a sum of the effects of the condition, batch, and time point, with an interaction term for condition and time point. For the IL-33+CGRP condition, the null condition was IL-33 treatment. For the IL-7+CGRP condition, which was analyzed separately, the null condition was IL-7 treatment. Significance of the overall model fit was estimated by a likelihood ratio test (LRT), where the reduced model consisted of only the batch variable. P-values were automatically adjusted by DESeq2 using independent filtering for an FDR of 0.1. Genes that had an adjusted p-value for the LRT of at most 0.05 ( LRT-filtered ) are included on the sheets of Table S2. LRT-filtered genes were considered significantly differentially expressed if, in addition, they met the criteria of having a Wald test adjusted p-value for the condition variable of at most 0.05, and absolute value of the associated log fold change of at least log2(1.5). Tests of enrichment in gene sets from GO (Table
clusterProfiler (Yu et al., 2012) and DOSE (Yu et al., 2015). The negative regulatory gene set used in comparisons consists of the cell surface transmembrane receptors Ctla4, Havcr2, Icos, Lag3, Lilrb4, Pdcd1, Tigit, Tnfrsf4, Tnfrsf9, and Tnfrsf18 (Chihara et al., 2018).
CGRP response gene signature derivation
The CGRP signature was defined as the set of genes that satisfy all the following criteria: (1) LRT-filtered in the 3-day CGRP+IL-33 vs. IL-33 model and CGRP+IL-7 vs. IL-7 model; (2) significantly differentially expressed at least one of those models; (3) having model coefficients of the same sign in each comparison, i.e., corresponding to fold changes in the same direction in both models. The sign of the gene in the CGRP signature corresponded to the sign of the coefficient in the models (Table S5).
Gene signature scoring and analysis
A score for an individual cell in the single-cell RNA-seq dataset was calculated as the log of the geometric mean of the normalized expression (TPX) values of the genes in the signature. Genes with a negative sign in the signature contributed negatively to the score, and genes that did not appear in the single-cell dataset but appeared in the signature contributed as zero values. Using linear regression, the signature score was modeled as a sum of the effects of the cluster (or the condition) and the log of the number of UMIs. Cluster 9 in the previously published scRNA-seq data had statistically significantly higher CGRP signature scores, regardless which other cluster was used as the reference.