HAL Id: hal-01007980
https://hal.archives-ouvertes.fr/hal-01007980
Submitted on 17 Apr 2018Chloride propagation in concrete harbour
Frédéric Rosquoët, Stéphanie Bonnet, Franck Schoefs, Abdelhafid Khelidj
To cite this version:
Frédéric Rosquoët, Stéphanie Bonnet, Franck Schoefs, Abdelhafid Khelidj. Chloride propagation in concrete harbour. 2nd International Symposium on Advances in Concrete through Science and Engineering , Sep 2006, Québec, Canada. �hal-01007980�
CHLORIDE PROPAGATION IN CONCRETE HARBOUR
Frédéric Rosquoët, Stéphanie Bonnet, Franck Schoefs and Abdelhafid Khelidj
Institut de Recherche en Génie Civil et Mécanique, GeM, UMR CNRS 6183, Nantes-Saint-Nazaire, France
Abstract
Under the marine environment, the main cause of degradation of reinforced concrete structure is the corrosion of steel bars. It is due to the presence of chloride ions into the concrete porosity. When the chloride ions concentration reaches a critical value, steel bars are not protected and corrosion can start. This work studies the chloride propagation within a coasting concrete structure. This structure is a quay of the Nantes Saint-Nazaire harbour (P.A.N.S.N.) located in the estuary on the West Atlantic coast and built in 1971.
In situ measurements of chloride profiles are realised for longitudinal and transversal beams and for slab in different locations and different orientations (north, south, east, west and under face).
These profiles are determined by a destructive method using at the end the titration of chloride solution. The diffusion coefficients are calculated by using the Fick’s law and they permit to quantify the concrete quality in relationship with the location. A statistical distribution of these data was carried out in the aim to predict the service life of the structure by using a probabilistic model. A second part deals with the chloride kinetics in this structure which is not always immersed. The kinetics propagation is also compared with two models existing in the literature.
This approach will be compared later to experimental tests realised in laboratory and will allow the development of an empirical chloride propagation law in this quay structure.
This will be done also with other structures because this work is done in the frame of a European Interreg III B project called Medachs.
1. INTRODUCTION
The lifespan estimation of a reinforced concrete work, as well as the need for repairing structures is the main preoccupation of building owners. Many mechanisms can induce irreversible damage for the reinforced concrete structures: it is the case of steel corrosion. The corrosion initiation is generally due to two mechanisms, the carbonation and the chloride ions penetration. This study focuses only on the chloride ions penetration because the structure studied is in marine environment. Chloride ions transported by water or spray, progress into the concrete cover to the steel bars by convection and or diffusion. When the concentration reaches a critical value, steel bars will be depassivated and corrosion will start. Many laboratory tests on chloride diffusion into concrete have been realised [1] [2]. This study deals on real scale structure because few works were done in France with a sounding followed by a scientific analysis.
Abroad, several studies were undertaken but these did not deal with experimental chloride profiles analysed by a probabilistic study using two different propagation laws. An important program research on 9 bridges was carried out in Holland [3]. These structures were built between 1940 and 1987. An hundred samples were taken on parts of structure only subjected to the spray sea water. The chloride ions concentration has been measured for each core. The diffusion coefficient of chloride ions was given from the solution of Fick’s second law, even if the in situ limit conditions do not correspond with the law applicability domain. A similar study was realised on a structure located at Dundee in Scotland [4]. Kirkpatrick et al. introduced a probabilistic study for estimating the time necessary before carrying out an intervention on ten different bridges [5]. We have studied a quay only in contact with the spray see water by taking into account the previous studies: on the one hand the chloride profiles were determined and on the other hand the evolutions during times were estimated with two different propagation laws using a probabilistic approach.
This study contributes to the European project Interreg III B entitled MEDACHS which relates to the durability and maintenance of the works of the Atlantic coast. Within this framework we engaged a partnership with the Port Authority of Nantes Saint-Nazaire (P.A.N.S.N.)
2. STUDIED STUCTURE
The studied structure is "poste 1" of the "Agro-alimentaire" terminal of the P.A.N.S.N which is 34 years old (built in 1971, figure 1).
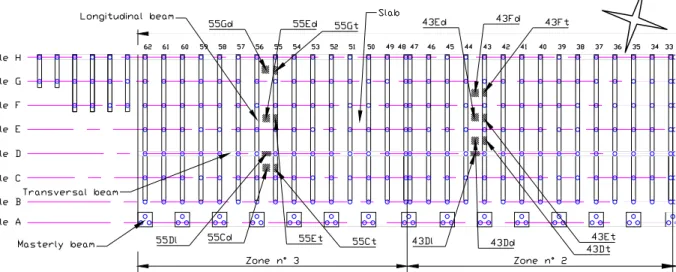
The quay consists of in place casted concrete elements, like the transversal, longitudinal and masterly beams (Figure 2) and of precasted element (slabs). The piles are in steel.
Figure 2: Sketch of the quay.
For the transversal beam, each marked point includes three measurements: in the east face (E), west face (W) and under face (UF). Only the total chloride ions profiles were measured on these cores. The chloride ions concentrations are determined as following: the cores of 40 mm diameter and 80 mm length are extracted by wet process, and then are sawn and crushed to obtain a powder. The objective is to evaluate the chloride concentration every 20 mm. Then to get the value at the middle point of one 20 mm length sample, the laboratory crushes 25 cm3 of concrete. This wetting method does not have influence on the measured concentration [3]. The chloride ions are extracted from the powder by acid attack and the solution obtained is titrated by the potentiometer method.
3. ANALYSIS
3.1 Chloride profiles
The aim of the probabilistic modelling is to assess the randomness of on site choride penetration. Then, for a statistical study, we assume that a given set of parameters allows to characterize a population: same type of concrete (casted in place), same exposure (spray) and same type of element. All the studied elements are subjected only to the spray sea water and are never in direct contact with sea water excepted during exceptional storms. As these elements are under the quay, the climate exposure is not influent (no sun, no rain). An analysis of the various elements was carried out from the data in the aim to focus our statistical study only on two transversal beams (43 and 55).
0 0.0005 0.001 0.0015 0.002 0 20 40 60 80 Depth x (mm) Chloride concentration C (kg/kg of concrete) 43.D.W 43.E.W 43.F.W 43.D.Uf 43.E.Uf 43.D.E 43.E.E
Critical chloride concentration value
Steel bar
Transversal beam 43
(W = West ; UF = Under-face ; E = East)
0 0.0005 0.001 0.0015 0.002 0 20 40 60 80 Depth x (mm) Chloride concent ration C (kg/kg of concrete) 55.C.W 55.E.W 55.G.W 55.G.Uf 55.C.E 55.E.E 55.G.E
Critical chloride concentration value
Steel bar
Transversal beam 55
(W = West ; UF = Under-face ; E = East)
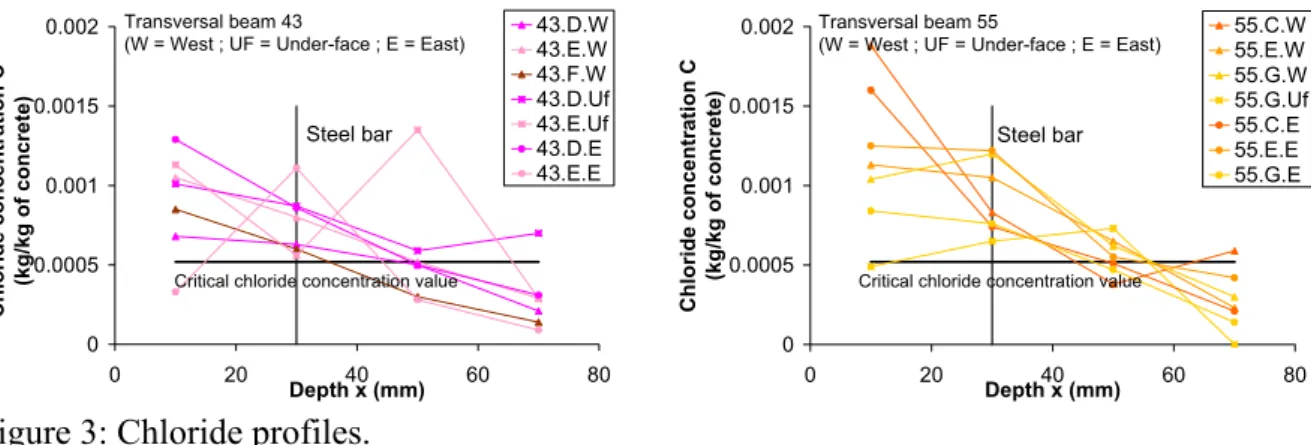
Figure 3: Chloride profiles.
The chloride concentration profiles are represented for the two beams on figure 3 and compared to the critical chloride concentration [6]. The theoretical decreasing of the chloride concentration with depth is respected but the scatter of profiles between beams is great at 10 mm but remains in the same range in depth. Only three profiles on beam 55 are different close to the surface. It probably comes from the great hazard near the concrete surface as concrete cover damaging. By looking at the profiles the different orientations and elements are assumed to have no influence on the chloride concentrations which allows us to set up a statistical study.
By comparing these profiles with the critical chloride concentration value and the position of the first reinforcement, it is obvious that almost all steel bars present a strong risk of corrosion, even if this is not visible on the beams surface. Let us recall that corrosion is supposed to start for concrete reinforcement when the chloride concentration reaches 0.00052 kg/kg of concrete (value suggested by French rule AFNOR P18-325: 0.4% of chloride ions by cement weight [6]).
3.2 Fick’s 2nd law of diffusion
The 14 profiles, presented above, are put in the same data base and are exploited by using the solution of Fick’s second law for a semi-infinite domain (equation 1). As the beam’s size is important compared to the concrete cover depth which is 3 cm, it is assumed to be a semi infinite domain
Theoretically this diffusion law is adapted only when concrete is always saturated with water. If not a convection term should be added to the diffusion term [2]. However, this law is used even for unsaturated concrete structure on field as done by Gaal [3], Wood [4] and Kirkpatrick [5]. The diffusion coefficients Deff and the chloride surface concentrations cs
(x = 0) are obtained by fitting experimental curves and equation 1 for each profile.
( )
x t =c ×erfc x c ,
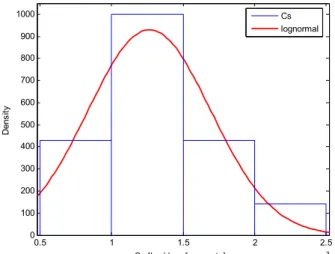
The histogram of the diffusion coefficients and the surface chloride concentrations are represented on figures 4 and 5. As explained before the different orientations and positions are not influent on the chloride profiles and all the profiles are taken into account for the statistical approach. It allows us to work with14 identified coefficients Deff and cs.
0 0.2 0.4 0.6 0.8 1 1.2 x 10⁻¹¹ 0 0.5 1 1.5 2 2.5 x 10¹¹ Deff [m²/s] Dens ity Deff lognormal
Figure 4: Histogram of the diffusion coefficients.
The histogram obtained for the diffusion coefficient is completely dissymmetrical. The diffusion coefficient values are increasing starting from a value which corresponds to a healthy concrete, around 1.00.10-12 m²/s [2], to the value around 1.00.10-11. This can be
explained physically by the concrete cover damaging which results in an increase in the transport properties [7]. The diffusion coefficients and the surface concentration are well fitted by a lognormal probability density function with respectively a mean equal to 3.65.10-12 and 1.26.10-3 and a standard deviation equal to 2.7.10-12 and 4.3.10-4 for Deff and cs (red
curves in figures 4 and 5). This result comes from the best fit, following the maximum likelihood, of available pdf in Matlab software [9].
0.5 1 1.5 2 2.5 x 10⁻³ 0 100 200 300 400 500 600 700 800 900 1000 Cs [kg / kg of concrete] Dens ity Cs lognormal
From the lognormal distributions fitted upon, and under the assumption that Cs and Deff are
statistically independent, sample of size 20 are generated for each variable from the Monte-Carlo technique. 46 . 0 1660 2153 1 x cs − = (2)
(
4 4)
2.51 96 . 4 25 . 7 E − E − = Deff (3)Monte-Carlo simulation are performed in using the Fick law as a deterministic transfer function (no error introduced in the modelling) and leads to 400 events of the concentration c(x,t) that are calculated at each depth and each time. These events are plotted in black on figure 6a at time 34 years and at locations where experimental results are available (depth 10, 30, 50, 70 mm). It allows to compare the scatter obtained by this way to the one coming from experimental results at 34 years.
0 0.0005 0.001 0.0015 0.002 0 20 40 60 80 Depth x (mm) Chloride concen tration C (k g/kg of con c rete) D.W E.W F.W C.W E.W G.W D.Uf E.Uf G.Uf D.E E.E C.E E.E G.E Statistical study 0 0.0002 0.0004 0.0006 0.0008 0.001 0.0012 0.0014 0 20 40 60 80 100 Time (Years) Chlo ride ions c onc ent ra tion C (k g/kg of conc re te ) x = 10 mm x = 30 mm x = 50 mm x = 70 mm
a) Comparison between the experimental and calculated chloride concentrations
b) Chloride ions concentration versus time Figure 6: Statistical analysis.
The good agreement between the experimental and statistical scatters (figure 6a) makes possible to validate the input distribution functions. With the fair number of available data, it is not possible to provide finest conclusions about the performance of the propagation law used from a probabilistic point of view. The evolutions of the chloride ions concentrations with time are represented on figure 6b for chosen depth. Only the average of concentrations calculated by the statistical study are plotted to simplify the representation. The variance is between 0.00037 (for 10 mm depth) and 0.00022 (for 70 mm depth).
This is not the statistical study which is questionable but rather the equation used which induces a slow increase of chloride concentrations. The chloride propagation is represented on
As the concrete in field is not always saturated and the domain is not really semi infinite a different law will be tried in the following section and compared with the previous study. 3.3 Empirical propagation law
An empirical law (equation 4) which is found in the literature connects the critical chloride concentration depth (xcr), an empirical coefficient k (m/years0.5) and the exposure time t
(years) [8].
t k =
xcr (4)
The critical chloride concentration depth at 34 years is determined from the chloride profiles (figure 7a). It is the intersection between the chloride profile and the critical chloride concentration value. 0 0.2 0.4 0.6 0.8 1 1.2 1.4 0 20 40 60 80 Depth x (mm) C h lo ri de con cen tr at ion C (k g/kg of c oncr et
e) Beam 43, file D, East profile
Critical chloride concentration value
xcr 0 10 20 30 40 50 60 70 80 90 30 35 40 45 50 55 60 Time (Years) C ritica l chloride c once n tration xcr (mm)
With Fick's law
With empirical propagation law
a) xcr determination at 34 years b) Chloride ions concentration versus time
Figure 7: Critical chloride concentration depth versus time.
The coefficient k is calculated at 34 years for all the profiles. We find 0.0081 for the average and 0.002 for the variance. This average value permits to evaluate the critical chloride concentration depth versus time (figure 7b). k is assumed to be constant during the service life of the structure. The critical chloride concentration depth is evaluated with the profiles estimated with the Fick’s law (figure 6b). The two different predictions are compared on figure 7b. From this analysis, it seems that the solution of Fick’s second law is more conservative for the service life of structure.
4. CONCLUSIONS
For this study we engaged partnership with the “Port Autonome de Nantes Saint-Nazaire” (P.A.N.S.N.) which provided us data of sounding of a quay which is 34 years old. An analysis of the chloride concentrations profiles on the various elements was carried out and allowed us to set up a statistical study to predict the evolution of the chloride concentration with time by using the Fick’s law. The good correlation between the experimental values and the statistical study makes possible to validate the distribution functions. An empirical law is also used to
predict the critical chloride concentration depth. By comparing the two predictions, it seems that the Fick’s law is more secure.
New cores will supplement the data and will make possible to refine the statistical study in the future. Measurement uncertainty will be quantified when the procedure will be improving by repetitively tests.
ACKNOWLEDGEMENTS
Special thanks to the “Port Autonome de Nantes Saint-Nazaire” for the data and the technical assistance brought during this study. The ERDF funding of the European Union for the project MEDACHS (“Marine environment damage to Atlantic coast historical and transport structures and buildings: methods of assessment and repair, maintenance”, program Intereg III B, Atlantic Spaces) enabled us to undertake this study under good condition.
REFERENCES
[1] Truc O, « A new way for determining the chloride diffusion in concrete », Cement and Concrete Research, vol. 30, 2000, p. 217-226.
[2] Castellote M., Andrade C., Alonso C., «Measurement of the steady and non-steady-state chloride diffusion coefficients in a migration test by means of monitoring the conductivity in the anolyte chamber. Comparaison with natural diffusion tests », Cement and Concrete Research, vol. 31, 2001, p. 1411-1420.
[3] Gaal G.C.M., van Beek A., Bakker J.D. et Walraven J.C., « Coefficient of diffusion derived from structures exposed to chlorides more then 60 years old », Life prediction and aging management of concrete structures, 2nd RILEM Workshop, Paris, 2003, pp. 21-29.
[4] Wood J.G.M. and Crerar J., « Tay road bridge: Analysis of chloride ingress variability and prediction of long term deterioration », Construction and Building Materials, vol. 11, n° 4, 1997, pp. 249-254.
[5] Kirkpatrick T. J., Weyers, R. E., Anderson-Cook, C.M., Sprinkel M. M., « Probabilistic model for the chloride-induced corrosion service life of bridge decks », Cement and Concrete Research, Vol. 32, 2002, pp. 1943-1960.
[6] AFNOR P18-325, NF EN 206-1, « Béton - Partie 1 : spécification, performance, production et conformité», 2000.
[7] Djerbi A., Bonnet S., Khelidj A., "Effect of mechanical damage on chloride migration into high performance concretes : experimentations and modelling" Seventh CANMET/ACI International Conference on Durability of Concrete, Montreal, Canada, 31 May - 3 June 2006.
[8] Paulsson-Tralla J., « Service life prediction of concrete bridge decks repaired with bonded concrete overlays », Materials and Structures, Vol. 34, January-February 2001, pp. 34-41.
[9] Matlab version 7 release 14, The MathWoks Inc., 3 Apple Hill Drive, Natick, MA 01760-2098 USA, [email protected] www.mathworks.com.