Publisher’s version / Version de l'éditeur:
Vous avez des questions? Nous pouvons vous aider. Pour communiquer directement avec un auteur, consultez la première page de la revue dans laquelle son article a été publié afin de trouver ses coordonnées. Si vous n’arrivez pas à les repérer, communiquez avec nous à PublicationsArchive-ArchivesPublications@nrc-cnrc.gc.ca.
Questions? Contact the NRC Publications Archive team at
PublicationsArchive-ArchivesPublications@nrc-cnrc.gc.ca. If you wish to email the authors directly, please see the first page of the publication for their contact information.
https://publications-cnrc.canada.ca/fra/droits
L’accès à ce site Web et l’utilisation de son contenu sont assujettis aux conditions présentées dans le site LISEZ CES CONDITIONS ATTENTIVEMENT AVANT D’UTILISER CE SITE WEB.
Client Report (National Research Council of Canada. Construction), 2018-03-28
READ THESE TERMS AND CONDITIONS CAREFULLY BEFORE USING THIS WEBSITE.
https://nrc-publications.canada.ca/eng/copyright
NRC Publications Archive Record / Notice des Archives des publications du CNRC :
https://nrc-publications.canada.ca/eng/view/object/?id=59bb30be-b77c-4df7-b739-b0343a1a34f2
https://publications-cnrc.canada.ca/fra/voir/objet/?id=59bb30be-b77c-4df7-b739-b0343a1a34f2
NRC Publications Archive
Archives des publications du CNRC
For the publisher’s version, please access the DOI link below./ Pour consulter la version de l’éditeur, utilisez le lien DOI ci-dessous.
https://doi.org/10.4224/23002895
Access and use of this website and the material on it are subject to the Terms and Conditions set forth at
The transmission loss of 203 mm thick prestressed precast concrete
hollowcore floors
The Transmission Loss of 203 mm
Thick Prestressed Precast Concrete
Hollowcore Floors
Canadian Precast/Prestressed Concrete Institute
Report A1-012467.2
28 March, 2018
Executive Summary
The transmission loss and impact insulation of floors comprised of 203 mm (8 in) thick precast/prestressed concrete hollowcores slabs were evaluated in the direct floor testing facility at the National Research Council.
The first floor of concrete hollowcore slabs had a mass per unit area of 269 kg/m2 without grout and a mass per unit
area of 273 kg/m2 once the grout was applied between the slabs.
The second floor of concrete hollowcore slabs had a mass per unit area of 301 kg/m2 without grout and a mass per
unit area of 305 kg/m2 once the grout was applied between the slabs. This floor was also tested with a 25.4 mm (1")
underlayment which was poured directly onto the concrete hollowcore slabs and with a carpet and underpad on the underlayment.
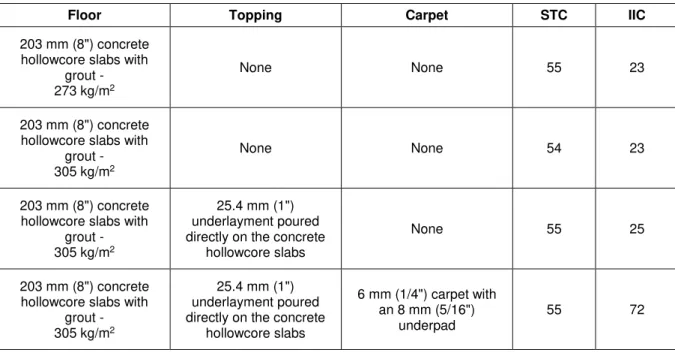
The results of the measurements are summarized in Table 1.
Table 1: Summary of the sound transmission class (STC) ratings and the impact insulation class (IIC) ratings for the floors.
Floor Topping Carpet STC IIC
203 mm (8") concrete hollowcore slabs with
grout - 273 kg/m2
None None 55 23
203 mm (8") concrete hollowcore slabs with
grout - 305 kg/m2
None None 54 23
203 mm (8") concrete hollowcore slabs with
grout - 305 kg/m2
25.4 mm (1") underlayment poured directly on the concrete
hollowcore slabs
None 55 25
203 mm (8") concrete hollowcore slabs with
grout - 305 kg/m2
25.4 mm (1") underlayment poured directly on the concrete
hollowcore slabs
6 mm (1/4") carpet with an 8 mm (5/16")
underpad
Table of Contents
1. Measurement Results ... 4 1.1 Hollowcore slabs 203 mm thick with a mass per unit area1 of 269 kg/m2 ... 4
1.2 Hollowcore slabs 203 mm thick with a mass per unit area1 of 301 kg/m2 ... 7
1.3 Hollowcore slabs 203 mm thick with a mass per unit area1 of 304 kg/m2 with a topping of 25.4 mm (1") of floor
underlayment poured directly on the slabs ... 10 1.4 Hollowcore slabs 203 mm thick with a mass per unit area1 of 304 kg/m2 with a topping of 25.4 mm (1") of floor
underlayment poured directly on the slabs and a short pile carpet with pad on the underlayment ... 13 1.5 Footnotes ... 16 References ... 17 Explanation of the transmission loss measurements ... A-1 Explanation of the impact sound transmission measurements ... B-3
1. Measurement Results
1.1 Hollowcore slabs 203 mm thick with a mass per unit area
1of 273 kg/m
2Client: Canadian Precast/Prestressed Concrete Institute
Specimen: 203 mm (8") thick floor comprised of four precast prestressed concrete hollowcore slabs with an average mass per unit area of 269 kg/m2 grouted together.
Specimen ID: A1-012467-1X
Specimen Description:
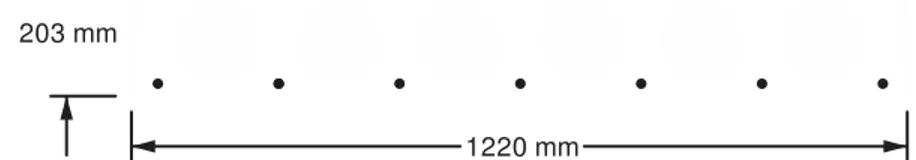
203 mm
1220 mm
Figure 1: One 203 mm concrete hollowcore floor slab cross-section (nominal dimensions shown - not to size)
Bare hollowcore: Four 1212 mm wide x 3988 mm long x 201 mm thick (actual average values) concrete hollowcore slabs were grouted together to form a concrete hollowcore floor.
Grout: The edges were grouted with 75 kg of Sakrete Mortar Mix.
Perimeter: The perimeter between the specimen and the test frame was packed with sand.
Specimen Properties:
Element Actual Average
Thickness (mm) Mass (kg)
Mass per unit area (kg/m2)
203 mm thick concrete hollowcore slabs 201 5195 269
Sakrete mortar mix 75 4
Total 5270 273
Test Specimen Installation
• The test specimen was mounted in the NRC Construction acoustic floor test frame opening which measures 4.71 m x 3.79 m.
• The area used for the calculations of the airborne sound transmission loss was the specimen opening area of 17.85 m2. The area used for mass per area for the floor elements is 19.32 m2
Airborne Sound Transmission Loss, TL, in Accordance with ASTM E 90
Client: CPCI Test ID: TLF-18-008
Date of test: 13 February, 2018 Specimen ID: A1-012467-1X
Area S of the test element: 17.85 m2 Mass per unit Area: 273 kg/m2
Room Volume (m3) Air Temperature (oC) Relative Humidity (%)
Upper 175.1 20.7 to 20.9 43.2 to 43.9 Lower 176.9 20.8 to 20.9 32.3 to 33.5 Frequency f (Hz) TL one-third octave (dB) 50 27* 63 43* 80 44 100 40 125 40 160 40 200 41 250 43 315 46 400 50 500 51 630 53 800 55 1000 57 1250 59 1600 60 2000 60 2500 62 3150 66 4000 69 5000 68 2 4 5 5 4 4 3 2 1 20 30 40 50 60 70 80 63 125 250 500 1000 2000 4000 A ir bor ne S ound T rans m is s ion Los s , T L, in dB Frequency, f, in Hz Sum of Deficiencies 30 dB Maximum Deficiency 5 dB at 250 Hz and 315 Hz
The solid line is the measured sound transmission loss for this specimen. The dashed line is the STC contour fitted to the measured values according to ASTM E413-16. The dotted line (may be above the displayed range) is 10 dB below the flanking limit established for this facility. For any frequency band where the measured transmission loss is above the dotted line, the reported value is potentially limited by flanking transmission via laboratory surfaces, and the true value may be higher than that measured. Bars at the bottom of the graph show deficiencies where the measured data are less than the reference contour as described in the fitting procedure for the STC, defined in ASTM E413-16. The shaded cells in the table and areas in the graph are outside the STC contour range.
Sound Transmission
Class (STC)
55
No. of test report: A1-012467.2 Signature: See signature page
Normalized Impact Sound Pressure Levels in Accordance with ASTM E 492
Client: CPCI Test ID: IIF-18-008
Date of test: 13 February, 2018 Specimen ID: A1-012467-1X
Area S of the test element: 17.85 m2 Mass per unit Area: 273 kg/m2
Room Volume (m3) Air Temperature (oC) Relative Humidity (%)
Upper 175.1 21.9 to 21.9 34.5 to 35.3 Lower 176.9 20.3 to 20.3 27.6 to 27.6 Frequency f (Hz) NISPL one-third octave (dB) 50 60 63 57 80 60 100 63 125 61 160 62 200 64 250 70 315 69 400 70 500 71 630 73 800 74 1000 75 1250 76 1600 77 2000 80 2500 78 3150 77 4000 74 5000 74 Sum of Positive Differences 19 dB Maximum Positive Difference 8 dB at 3150 Hz
The solid line is the measured normalized impact sound pressure level (NISPL) for this specimen. The dashed line is the IIC contour fitted to the measured values according to ASTM E989-06. The dotted line is the background sound level measured in the receiving room during this test (may be below the displayed range). For any frequency where measured NISPL is less than 10 dB above the dotted line, the reported values were adjusted as noted below. Bars at bottom of graph show positive differences; where the measured data are greater than the reference contour as defined in ASTM E989-06. Shaded cells in the table and areas in the graph are outside the IIC contour range.
Impact Insulation Class (IIC)
23
No. of test report: A1-012467.2 Signature: See signature page
1.2 Hollowcore slabs 203 mm thick with a mass per unit area
1of 305 kg/m
2Client: Canadian Precast/Prestressed Concrete Institute
Specimen: 203 mm (8") thick floor comprised of four precast prestressed concrete hollowcore slabs with an average mass per unit area of 301 kg/m2 grouted together.
Specimen ID: A1-012467-1F
Specimen Description:
203 mm
1220 mm
Figure 2: One 203 mm concrete hollowcore floor slab cross-section (nominal dimensions shown - not to size)
Bare hollowcore: Four 1210 mm wide x 3976 mm long x 203 mm thick (average values) concrete hollowcore slabs were grouted together to form a concrete hollowcore floor.
Grout: The edges were grouted with 75 kg of Sakrete Mortar Mix.
Perimeter: The perimeter between the specimen and the test frame was packed with sand.
Specimen Properties:
Element Actual Average
Thickness (mm) Mass (kg)
Mass per unit area (kg/m2)
203 mm thick concrete hollowcore slabs 203 5809 301
Sakrete mortar mix 75 4
Total 5884 305
Test Specimen Installation
• The test specimen was mounted in the NRC Construction acoustic floor test frame opening which measures 4.71 m x 3.79 m.
• The area used for the calculations of the airborne sound transmission loss was the specimen opening area of 17.85 m2. The area used for mass per area for the floor elements is 19.32 m2
Airborne Sound Transmission Loss, TL, in Accordance with ASTM E 90
Client: CPCI Test ID: TLF-18-081
Date of test: 11 December 2017 Specimen ID: A1-012467-1F
Area S of the test element: 17.85 m2 Mass per unit Area: 305 kg/m2
Room Volume (m3) Air Temperature (oC) Relative Humidity (%)
Upper 175.1 19.6 to 19.7 37.7 to 37.8 Lower 176.9 21.0 to 21.0 39.4 to 39.5 Frequency f (Hz) TL one-third octave (dB) 50 29* 63 42* 80 38 100 37 125 36 160 38 200 41 250 43 315 45 400 49 500 51 630 53 800 55 1000 57 1250 60 1600 62 2000 63 2500 65 3150 67 4000 71 5000 72 2 3 3 4 5 4 3 2 1 20 30 40 50 60 70 80 63 125 250 500 1000 2000 4000 A ir bor ne S ound T rans m is s ion Los s , T L, in dB Frequency, f, in Hz Sum of Deficiencies 27 dB Maximum Deficiency 5 dB at 315 Hz
The solid line is the measured sound transmission loss for this specimen. The dashed line is the STC contour fitted to the measured values according to ASTM E413-16. The dotted line (may be above the displayed range) is 10 dB below the flanking limit established for this facility. For any frequency band where the measured transmission loss is above the dotted line, the reported value is potentially limited by flanking transmission via laboratory surfaces, and the true value may be higher than that measured. Bars at the bottom of the graph show deficiencies where the measured data are less than the reference contour as described in the fitting procedure for the STC, defined in ASTM E413-16. The shaded cells in the table and areas in the graph are outside the STC contour range.
Sound Transmission
Class (STC)
54
No. of test report: A1-012467.2 Signature: See signature page
Normalized Impact Sound Pressure Levels in Accordance with ASTM E 492
Client: CPCI Test ID: IIF-17-066
Date of test: 12 December, 2017 Specimen ID: A1-004972-01F
Area S of the test element: 17.85 m2 Mass per unit Area: 305 kg/m2
Room Volume (m3) Air Temperature (oC) Relative Humidity (%)
Upper 175.1 20.0 to 20.1 36.3 to 37.2 Lower 176.9 21.0. to 21.0 39.4 to 39.5 Frequency f (Hz) NISPL one-third octave (dB) 50 58 63 56 80 64 100 62 125 63 160 61 200 65 250 73 315 70 400 71 500 72 630 73 800 74 1000 75 1250 75 1600 76 2000 78 2500 78 3150 77 4000 74 5000 73 Sum of Positive Differences 17 dB Maximum Positive Difference 8 dB at 3150 Hz
The solid line is the measured normalized impact sound pressure level (NISPL) for this specimen. The dashed line is the IIC contour fitted to the measured values according to ASTM E989-06. The dotted line is the background sound level measured in the receiving room during this test (may be below the displayed range). For any frequency where measured NISPL is less than 10 dB above the dotted line, the reported values were adjusted as noted below. Bars at bottom of graph show positive differences; where the measured data are greater than the reference contour as defined in ASTM E989-06. Shaded cells in the table and areas in the graph are outside the IIC contour range.
Impact Insulation Class (IIC)
23
No. of test report: A1-012467.2 Signature: See signature page
1.3 Hollowcore slabs 203 mm thick with a mass per unit area
1of 305 kg/m
2with a
topping of 25.4 mm (1") of floor underlayment poured directly on the slabs
Client: Canadian Precast/Prestressed Concrete Institute
Specimen: 203 mm (8") thick floor comprised of four precast prestressed concrete hollowcore slabs with an average mass per unit area of 301 kg/m2 grouted together with a 25.4
mm (1") underlayment poured directly on the floor.
Specimen ID: A1-012467-2F
Specimen Description:
Figure 3: Floor of 203 mm thick precast concrete hollowcore slabs with a 25.4 mm underlayment poured directly on the floor.
Bare hollowcore: Four 1212 mm wide x 3988 mm long x 201 mm thick (average values) concrete hollowcore slabs were grouted together to form a hollowcore floor.
Grout: The edges were grouted with 75 kg of Sakrete Mortar Mix.
Perimeter: The perimeter between the specimen and the test frame was packed with sand.
Topping: 25.4 mm (1") underlayment poured directly on the floor. The underlayment had a mass per unit area of 37 kg/m2 and a compressive strength of 1.02 to 1.32 kg/m2 (3500 psi to 4500 psi).
Specimen Properties:
Element Actual Average
Thickness (mm) Mass (kg)
Mass per unit area (kg/m2)
203 mm thick concrete hollowcore slabs 203 5809 301
Sakrete mortar mix 75 4
25.4 mm underlayment 25 951 49
Total 5270 354
Test Specimen Installation
• The test specimen was mounted in the NRC Construction acoustic floor test frame opening which measures 4.71 m x 3.79 m.
• The area used for the calculations of the airborne sound transmission loss was the specimen opening area of 17.85 m2. The area used for mass per area for the floor elements is 19.32 m2
Airborne Sound Transmission Loss, TL, in Accordance with ASTM E 90
Client: CPCI Test ID: TLF-18-001
Date of test: 10 January, 2018 Specimen ID: A1-012467-2F
Area S of the test element: 17.85 m2 Mass per unit Area: 354 kg/m2
Room Volume (m3) Air Temperature (oC) Relative Humidity (%)
Upper 175.1 24.6 to 24.7 30.5 to 30.8 Lower 176.9 22.0 to 22.0 36.3 to 36.7 Frequency f (Hz) TL one-third octave (dB) 50 34* 63 46* 80 42 100 38 125 38 160 37 200 42 250 43 315 46 400 49 500 52 630 54 800 57 1000 60 1250 64 1600 66 2000 67 2500 68 3150 70 4000 74 5000 73 1 5 3 5 5 5 3 2 30 40 50 60 70 80 63 125 250 500 1000 2000 4000 A ir bor ne S ound T rans m is s ion Los s , T L, in dB Frequency, f, in Hz Sum of Deficiencies 29 dB Maximum Deficiency 5 dB
The solid line is the measured sound transmission loss for this specimen. The dashed line is the STC contour fitted to the measured values according to ASTM E413-16. The dotted line (may be above the displayed range) is 10 dB below the flanking limit established for this facility. For any frequency band where the measured transmission loss is above the dotted line, the reported value is potentially limited by flanking transmission via laboratory surfaces, and the true value may be higher than that measured. Bars at the bottom of the graph show deficiencies where the measured data are less than the reference contour as described in the fitting procedure for the STC, defined in ASTM E413-16. The shaded cells in the table and areas in the graph are outside the STC contour range.
Sound Transmission
Class (STC)
55
No. of test report: A1-012467.2 Signature: See signature page
Normalized Impact Sound Pressure Levels in Accordance with ASTM E 492
Client: CPCI Test ID: IIF-18-001
Date of test: 10 January, 2018 Specimen ID: A1-004972-02F
Area S of the test element: 17.85 m2 Mass per unit Area: 354 kg/m2
Room Volume (m3) Air Temperature (oC) Relative Humidity (%)
Upper 175.1 25.1 to 25.2 30.9 to 32.1 Lower 176.9 22.0 to 22.0 37.3 to 37.6 Frequency f (Hz) NISPL one-third octave (dB) 50 53 63 55 80 61 100 62 125 62 160 61 200 65 250 70 315 78 400 70 500 70 630 71 800 71 1000 71 1250 72 1600 73 2000 74 2500 75 3150 75 4000 72 5000 73 Sum of Positive Differences 14 dB Maximum Positive Difference 8 dB at 3150 Hz
The solid line is the measured normalized impact sound pressure level (NISPL) for this specimen. The dashed line is the IIC contour fitted to the measured values according to ASTM E989-06. The dotted line is the background sound level measured in the receiving room during this test (may be below the displayed range). For any frequency where measured NISPL is less than 10 dB above the dotted line, the reported values were adjusted as noted below. Bars at bottom of graph show positive differences; where the measured data are greater than the reference contour as defined in ASTM E989-06. Shaded cells in the table and areas in the graph are outside the IIC contour range.
Impact Insulation Class (IIC)
25
No. of test report: A1-012467.2 Signature: See signature page
1.4 Hollowcore slabs 203 mm thick with a mass per unit area
1of 305 kg/m
2with a
topping of 25.4 mm (1") of floor underlayment poured directly on the slabs and
a short pile carpet with pad on the underlayment
Client: Canadian Precast/Prestressed Concrete Institute
Specimen: 203 mm (8") thick floor comprised of four precast prestressed concrete hollowcore slabs with an average mass per unit area of 301 kg/m2 grouted together with a 25.4
mm (1") underlayment poured directly on the floor. A short pile carpet with pad was installed on the underlayment.
Specimen ID: A1-012467-3F
Specimen Description:
Figure 4: Floor of 203 mm thick precast concrete hollowcore slabs with a 25.4 mm underlayment poured directly on the floor. An 8 mm underpad and a 6 mm carpet were installed on the underlayment.
Bare hollowcore: Four 1212 mm wide x 3988 mm long x 201 mm thick (average values) concrete hollowcore slabs were grouted together to form a hollowcore floor.
Grout: The edges were grouted with 75 kg of Sakrete Mortar Mix.
Perimeter: The perimeter between the specimen and the test frame was packed with sand.
Topping: 25.4 mm (1") underlayment poured directly on the floor. The underlayment had a mass per unit area of 37 kg/m2 and a compressive strength of 1.02 to 1.32 kg/m2 (3500 psi to 4500 psi). 6 mm (1/4")
carpet 0.62 kg/m (20 oz/yd) with standard 8 mm (5/16”) underpad.
Specimen Properties:
Element Actual Average
Thickness (mm) Mass (kg)
Mass per unit area (kg/m2)
203 mm thick concrete hollowcore slabs 203 5809 301
Sakrete mortar mix 75 4
25.4 mm underlayment 25 951 49
8 mm underpad 8 16 0.8
6 mm carpet 6 41 2.1
Total 6892 357
Test Specimen Installation
• The test specimen was mounted in the NRC Construction acoustic floor test frame opening which measures 4.71 m x 3.79 m.
• The area used for the calculations of the airborne sound transmission loss was the specimen opening area of 17.85 m2. The area used for mass per area for the floor elements is 19.32 m2
Airborne Sound Transmission Loss, TL, in Accordance with ASTM E 90
Client: CPCI Test ID: TLF-18-002
Date of test: 11 January, 2018 Specimen ID: A1-012467-3F
Area S of the test element: 17.85 m2 Mass per unit Area: 357 kg/m2
Room Volume (m3) Air Temperature (oC) Relative Humidity (%)
Upper 175.1 24.4 to 24.5 31.8 to 31.9 Lower 176.9 22.1 to 22.1 33.6 to 33.6 Frequency f (Hz) TL one-third octave (dB) 50 34* 63 46* 80 40 100 36 125 37 160 37 200 42 250 42 315 45 400 49 500 53 630 54 800 58 1000 62 1250 66 1600 70 2000 73 2500 76 3150 80* 4000 85* 5000 87* 2 5 3 6 6 5 2 2 30 40 50 60 70 80 90 63 125 250 500 1000 2000 4000 A ir bor ne S ound T rans m is s ion Los s , T L, in dB Frequency, f, in Hz Sum of Deficiencies 31 dB Maximum Deficiency 6 dB at 250 Hz and 315 Hz
The solid line is the measured sound transmission loss for this specimen. The dashed line is the STC contour fitted to the measured values according to ASTM E413-16. The dotted line (may be above the displayed range) is 10 dB below the flanking limit established for this facility. For any frequency band where the measured transmission loss is above the dotted line, the reported value is potentially limited by flanking transmission via laboratory surfaces, and the true value may be higher than that measured. Bars at the bottom of the graph show deficiencies where the measured data are less than the reference contour as described in the fitting procedure for the STC, defined in ASTM E413-16. The shaded cells in the table and areas in the graph are outside the STC contour range.
Sound Transmission
Class (STC)
55
No. of test report: A1-012467.2 Signature: See signature page
Normalized Impact Sound Pressure Levels in Accordance with ASTM E 492
Client: CPCI Test ID: IIF-18-002
Date of test: 11 January, 2018 Specimen ID: A1-004972-03F
Area S of the test element: 17.85 m2 Mass per unit Area: 357 kg/m2
Room Volume (m3) Air Temperature (oC) Relative Humidity (%)
Upper 175.1 24.9 to 25.0 31.7 to 33.1 Lower 176.9 22.1 to 22.1 33.7 to 33.8 Frequency f (Hz) NISPL one-third octave (dB) 50 48 63 47 80 48 100 48 c 125 42 c 160 33 * 200 36 c 250 39 315 37 400 35 500 34 630 30 800 21 c 1000 17 * 1250 14 * 1600 12 * 2000 12 * 2500 13 * 3150 14 * 4000 15 * 5000 17 * Sum of Positive Differences 10 dB Maximum Positive Difference 8 dB at 100 Hz
The solid line is the measured normalized impact sound pressure level (NISPL) for this specimen. The dashed line is the IIC contour fitted to the measured values according to ASTM E989-06. The dotted line is the background sound level measured in the receiving room during this test (may be below the displayed range). For any frequency where measured NISPL is less than 10 dB above the dotted line, the reported values were adjusted as noted below. Bars at bottom of graph show positive differences; where the measured data are greater than the reference contour as defined in ASTM E989-06. Shaded cells in the table and areas in the graph are outside the IIC contour range.
Impact Insulation Class (IIC)
72
No. of test report: A1-012467.2 Signature: See signature page
1.5 Footnotes
1. The mass per unit area given in this report is for the individual precast/prestressed concrete hollowcore slabs. The mass per unit area of a floor built from the slabs will have a higher mass per unit area due to the mass of the grout used to fill the keyways. It is the higher mass per unit area that is used to calculate the ASTC rating of constructions which include precast/prestressed concrete hollowcore slabs such as the research report, RR-331
Guide to calculating airborne sound transmission in buildings [1].
2. Discussion
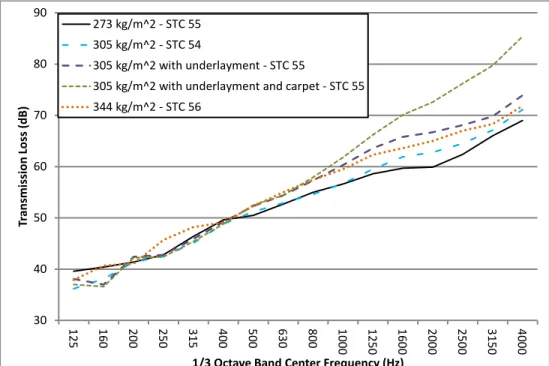
The transmission loss values for the floors are compared in Figure 5. Also shown in the figure is the transmission loss for a concrete hollowcore floor with a mass per unit area of 344 kg/m2 which was measured as part of an earlier
study [2].
Figure 5: Comparison between the transmission loss curves for the different concrete hollowcore floors which were tested.
The 273 kg/m2 concrete hollowcore floor had an STC rating of 55 whereas the heavier 305 kg/m2 concrete hollowcore
floor had a STC rating of 54 which was unexpected. As the curves in Figure 5 show, the 305 kg/m2 concrete
hollowcore floor had a dip in the 160 Hz 1/3 octave band, most likely corresponding to the critical frequency of the slabs whereas the 276 kg/m2 concrete hollowcore does not. This dip resulted in a lower STC rating for the heavier
floor.
At the frequencies above the 200 Hz 1/3 octave band, the heavier the concrete hollowcore floor, the better the transmission loss, but the STC rating does not capture this since the rating is driven by the dips in the transmission loss curves at the lower frequencies.
Also not captured by the STC rating is the improvement due to the addition of the linings. The addition of the 25.4 mm of underlayment or the underlayment and carpet did not improve the STC rating. However, Figure 5 shows that there was an improvement in the transmission loss above the 315 Hz 1/3 octave band, especially in the case of the underlay plus carpet where there was a significant increase in the transmission loss. It is expected that there would have been a bigger improvement if a lining was used between the underlayment and the concrete hollowcore floor rather than pouring the underlayment directly on the concrete hollowcore floor.
30 40 50 60 70 80 90 1 25 160 200 250 315 400 500 630 800 1000 1250 1600 2000 2500 3150 4000 Tr a n sm issi o n L o ss (d B )
1/3 Octave Band Center Frequency (Hz)
273 kg/m^2 - STC 55 305 kg/m^2 - STC 54
305 kg/m^2 with underlayment - STC 55
305 kg/m^2 with underlayment and carpet - STC 55 344 kg/m^2 - STC 56
References
[1] Hoeller C, Quirt, D., Mahn J, NRC Research Report RR-331: Guide to Calculating Airborne Sound
Transmission in Buildings: 3rd Edition. Ottawa, Canada: National Research Council Canada; 2017.
[2] Report A1-004972.1 - Measurements of Airborne Sound Transmission Loss (ASTM E90) and Impact Sound Transmission (ASTM E492) on One Bare Hollow Core Floor Assembly (203 mm).
Explanation of the transmission loss measurements
Explanation of the Data Presented in the Tables
The results in this report apply only to the specific sample submitted for measurement. No responsibility is assumed for performance of any other specimen. Airborne sound transmission loss measurements were conducted in accordance with the requirements of ASTM E90, “Standard Test Method for Laboratory Measurement of Airborne Sound Transmission Loss of Building Partitions and Elements.”
ASTM E90 requires that at each measurement position in the receiving room, corrections shall be made unless the background level is more than 10 dB below the combination of signal and background. Values in the table which are followed by a “c” indicate that the measurements in the receiving room were 5 dB and 10 dB higher than the combined receiving room level and background level. The reported values have been corrected according to the procedure outlined in ASTM E90. Values marked “*” indicate that the measured background level was less than 5 dB below the combined receiving room level and background level, in which case, the corrected values provide an estimate of the lower limit of airborne sound transmission loss.
Facility and Equipment
The acoustics wall test facility comprises two reverberation rooms (referred to in this report as the upper and lower rooms) with a moveable test frame between the two rooms. In each room, a calibrated Bruel & Kjaer condenser microphone (type 4166 or 4165) with preamp is moved under computer control to nine positions, and measurements are made in both rooms using an 8-channel National Instrument NI-4472 system installed in a desktop PC-type computer. Each room has four bi-amped loudspeakers driven by separate amplifiers and noise sources. To increase the diffusivity of the sound field, there are fixed diffusing panels in each room.
Test Procedure - Transmission Loss
Airborne sound transmission measurements were conducted in accordance with the requirements of ASTM E90, “Standard Method for Laboratory Measurement of Airborne Sound Transmission Loss of Building Partitions”. Airborne sound transmission loss tests were performed in the forward (receiving room is the large room) and reverse (receiving room is the small room) directions. Results presented in this report are the average of the tests in these two directions. In each case, sound transmission loss values were calculated from the average sound pressure levels of both the source and receiving rooms and the average reverberation times of the receiving room. One-third octave band sound pressure levels were measured for 32 seconds at nine microphone positions in each room and then averaged to get the average sound pressure level in each room. Five sound decays were averaged to get the reverberation time at each microphone position in the receiving room; these reverberation times were averaged to get the average reverberation times for each room. Information on the flanking limit of the facility and reference specimen test results are available on request.
Significance of Test Results - Transmission Loss
ASTM E90 requires measurements in 1/3-octave bands in the frequency range 100 Hz to 5000 Hz. Within those ranges, reproducibility has been assessed by inter-laboratory round robin studies. The standards recommend making measurements and reporting results over a larger frequency range, and this report presents such results, which may be useful for expert evaluation of the specimen performance. The precision of results outside the 100 to 5000 Hz range has not been established, but is expected to depend on laboratory-specific factors.
Sound Transmission Class (STC)
The STC rating was determined in accordance with ASTM E413-16, “Classification for Rating Sound Insulation”. The Sound Transmission Class (STC) is a single-figure rating scheme intended to rate the acoustical performance of a partition element separating offices or dwellings. The higher the value of the rating, the better the performance. The rating is intended to correlate with subjective impressions of the sound insulation provided against the sounds of speech, radio, television, music, and similar sources of noise characteristic of offices and dwellings. The STC is of limited use in applications involving noise spectra that differ markedly from those referred to above (for example, heavy machinery, power transformers, aircraft noise, motor vehicle noise). Generally, in such applications it is preferable to consider the source levels and insulation requirements for each frequency band.
Explanation of the impact sound transmission measurements
Test Procedure - Impact Sound Transmission
Impact sound transmission measurements were conducted in accordance with ASTM E492, “Standard Test Method for Laboratory Measurement of Impact Sound Transmission Through Floor-Ceiling Assemblies Using the Tapping Machine”. This test uses a standard tapping machine placed at four prescribed positions on the floor. One-third octave band sound pressure levels were measured for 32 seconds at each microphone position in the receiving room and then averaged to get the average sound pressure level in the room. Five sound decays were averaged to get the reverberation time at each microphone position in the room; these nine reverberation times were averaged to get the spatial average reverberation times for the room. The spatial-average sound pressure levels and reverberation times of the receiving room were used to calculate Normalized Impact Sound Pressure Levels.
Significance of Test Results - Impact Sound Transmission
ASTM E492 requires measurements in 1/3-octave bands in the frequency range 100 Hz to 3150 Hz. Within this range, reproducibility has been assessed by inter-laboratory round robin studies. The standard recommends making measurements and reporting results over a larger frequency range, and this report presents such results, which may be useful for expert evaluation of the specimen performance. The precision of results outside the standard ranges has not been established, and is expected to depend on laboratory-specific factors such as room size and specimen dimensions.
Impact Insulation Class (IIC)
The Impact Insulation Class (IIC) was determined in accordance with ASTM E989, “Standard Classification for Determination of Impact Insulation Class (IIC)”. The IIC is a single-figure rating scheme intended to rate the effectiveness of floor-ceiling assemblies at preventing the transmission of impact sound from the standard tapping machine. A higher IIC value indicates a better floor performance.
In Situ Performance
Ratings obtained by this standard method tend to represent an upper limit to what might be measured in a field test, due to structure-borne transmission (“flanking”) and construction deficiencies in actual buildings.