READ THESE TERMS AND CONDITIONS CAREFULLY BEFORE USING THIS WEBSITE.
https://nrc-publications.canada.ca/eng/copyright
Vous avez des questions? Nous pouvons vous aider. Pour communiquer directement avec un auteur, consultez la première page de la revue dans laquelle son article a été publié afin de trouver ses coordonnées. Si vous n’arrivez pas à les repérer, communiquez avec nous à [email protected].
Questions? Contact the NRC Publications Archive team at
[email protected]. If you wish to email the authors directly, please see the first page of the publication for their contact information.
NRC Publications Archive
Archives des publications du CNRC
This publication could be one of several versions: author’s original, accepted manuscript or the publisher’s version. / La version de cette publication peut être l’une des suivantes : la version prépublication de l’auteur, la version acceptée du manuscrit ou la version de l’éditeur.
Access and use of this website and the material on it are subject to the Terms and Conditions set forth at
On the resilient behaviour of unbound aggregates Khogali, W. E. I.; Zeghal, M.
https://publications-cnrc.canada.ca/fra/droits
L’accès à ce site Web et l’utilisation de son contenu sont assujettis aux conditions présentées dans le site LISEZ CES CONDITIONS ATTENTIVEMENT AVANT D’UTILISER CE SITE WEB.
NRC Publications Record / Notice d'Archives des publications de CNRC:
https://nrc-publications.canada.ca/eng/view/object/?id=4ad8aad2-d650-4c63-9119-583c99222d55 https://publications-cnrc.canada.ca/fra/voir/objet/?id=4ad8aad2-d650-4c63-9119-583c99222d55
On the resilient behaviour of unbound
aggregates
Khogali, W. E. I.; Zeghal, M.
A version of this paper is published in / Une version de ce document se trouve dans : Unbound Aggregates in Road Construction, Nottingham, England, 2000, pp. 29-34
www.nrc.ca/irc/ircpubs
Walaa E.I. Khogali & Morched Zeghal Page 1
On The Resilient Behaviour of Unbound Aggregates
Walaa E.I. Khogali & Morched Zeghal
National Research Council Canada, Institute for Research in Construction – Urban Infrastructure Rehabilitation Program, Canada.
ABSTRACT: This paper explores the potential of the resilient modulus test to characterize the mechanical response of unbound aggregates. The paper is divided into two sections. The first section presents the results of a laboratory study aimed at identifying the significant factors that affect the resilient modulus of granular materials. Using the principles of experimental factorial design, four parameters, namely: deviator stress, confining pressure, moisture content and material dry density were included in the investigation. Resilient modulus test results showed that the effect of the deviator stress was the most significant followed by the effect of moisture content. Other factors appear to have little or no effect at all on the modulus parameter.
In the second section of the paper, an attempt is made to interpret the material micro behaviour at the grain level with its macro response measured by the resilient modulus parameter. This part of the study was carried out using the discrete element modelling technique. Theoretical values of the resilient modulus obtained satisfactorily agree with laboratory determined moduli. These results confirm the suitability of the resilient modulus test to describe the mechanical response of unbound aggregate materials to traffic and environmental stimuli.
1 INTRODUCTION
Proper characterization of the mechanical response of unbound aggregate materials is a crucial factor in the design and rehabilitation of pavement structures. Among the many parameters that exist today for characterization, the resilient modulus appears to be the most suitable candidate. This is due to the ability of this parameter to closely simulate the material in-situ conditions under traffic loading [Brown, 1977]. The resilient modulus, Mr, is a mechanical property of the material that describes its stress – strain relationship under dynamic loading and specified physical conditions. In repeated triaxial load tests, Mr is defined as the ratio of the peak cyclic deviator stress to the recoverable measured axial strain as given in equation 1 below.
Due to the non-linear behaviour of granular materials, their resilient moduli appear to be influenced by several factors, some of which have been reported by Seed et al. [1967] and other investigators [Dehlen and Monismith, 1970; Barksdale, 1971; Pell and Brown, 1972; Brown, 1974; and Cole et al., 1986]. The current paper describes a unique approach that is used to examine and quantify the effects of four of these factors on the resilient response of a typical granular material.
The short-term goal of this study is to develop a constitutive material relation that can be used in the design and analysis of pavement structures. Another, long-term objective is to establish guidelines for a systematic and rational procedure for characterising unbound aggregate materials utilising the resilient modulus test. The research approach followed consists of a laboratory investigation and an analytical simulation exercise. Details of the laboratory investigation are given in section 2. The analytical simulation was carried out using the discrete element method to model the resilient modulus test. Information pertaining to the analytical study is contained in section 3.
2 LABORATORY INVESTIGATION 2.1 Planning the Experiment
The laboratory study was conducted at the Civil Engineering Department of King Saud University in Riyadh, Saudi Arabia. A typical unbound aggregate material, designated by the specification department of the Ministry of Communications as grading III granular base coarse was used in this study.
The investigation was designed to examine the influence of four test parameters on the resilient modulus of the selected material. The four variables were the deviator stress, the confining pressure, the soil dry density and the soil moisture content. Using the principles of factorial design [Box et al., 1978], a ) 1 ( K K K K K K K K r d r M ε σ =
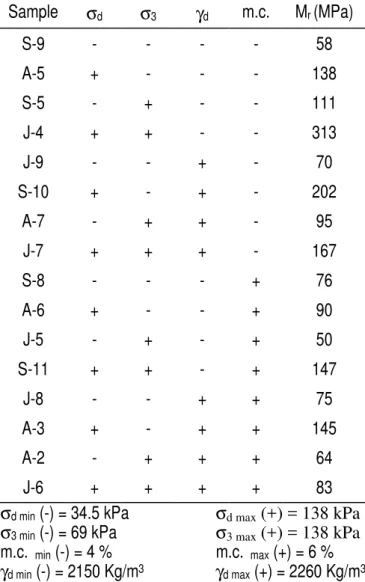
24 factorial experiment was constructed in which two levels for each of the four independent parameters were selected. Table 1 shows the design matrix for the experiment with the levels coded so that for each of the independent variables a minus sign represents the low level and a plus sign the high level. The resilient modulus obtained at each combination of the investigated variables is shown in the last column of this table.
Table 1 Design Matrix of Factorial Experiment Sample σd σ3 γd m.c. Mr (MPa) S-9 - - - - 58 A-5 + - - - 138 S-5 - + - - 111 J-4 + + - - 313 J-9 - - + - 70 S-10 + - + - 202 A-7 - + + - 95 J-7 + + + - 167 S-8 - - - + 76 A-6 + - - + 90 J-5 - + - + 50 S-11 + + - + 147 J-8 - - + + 75 A-3 + - + + 145 A-2 - + + + 64 J-6 + + + + 83
σd min (-) = 34.5 kPa σd max (+) = 138 kPa σ3 min (-) = 69 kPa σ3 max (+) = 138 kPa m.c. min (-) = 4 % m.c. max (+) = 6 % γd min (-) = 2150 Kg/m3 γd max (+) = 2260 Kg/m3
2.2 Description of Material and Test Procedure The unbound aggregate material used in the study was obtained from a crusher site 100 km east of the City of Riyadh. The aggregates, which were originally obtained in three distinct sizes, coarse, fine and filler were combined according to the Ministry of Communications specifications to produce the base coarse material class III, shown in Table 2.
To enable resilient modulus testing at different levels of dry density and moisture contents, the moisture – density relationship for the aggregate material was produced using the Standard Proctor
Test Method [AASHTO T180-93]. This relation is displayed in Figure 1.
Table 2 MOC Class III Base Coarse Gradation Sieve Size Percent Passing Percent Retained
25.4 mm 100 0
19 mm 85 15
4.76 mm 35 50
420 µm 10 25
74 µm 3 7
Figure 1 Moisture-Density Relation for Class III The maximum dry density and optimum moisture content of the material were found to be 2260 kg/m3 and 6.2%, respectively. Resilient modulus tests were performed on 16 soil samples compacted at two levels of dry density (@maximum & @ 95% of max. density), and at two levels of water content (@ optimum and @2% dry of optimum) as depicted in Table 1.
A have sine loading pulse similar to the one shown in Figure 2 was used to apply the repetitive deviator stress. Loading was exerted for a period of 0.1 second, followed by a rest period of 0.9 second.
Figure 2 Typical Dynamic Repetitive Load Pulse
1.95 2 2.05 2.1 2.15 2.2 2.25 2.3 2 3 4 5 6 7 8 Water Content (%) Dr y Density (g/cm3) 0 25 0 0.2 0.4 0.6 0.8 1 1.2 1.4 1.6 1.8 2 2.2 Time (sec) Loa d Maximum Load
Walaa E.I. Khogali & Morched Zeghal Page 3 2.3 Analysis of Laboratory Results
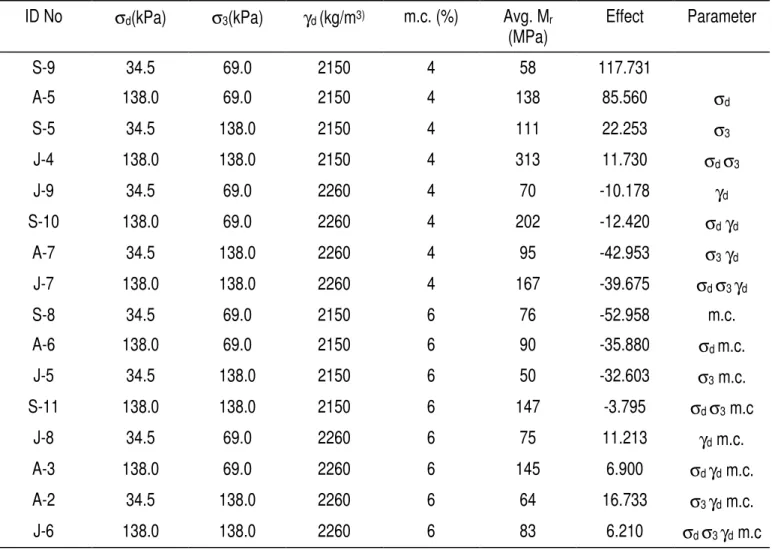
Results of resilient modulus tests for the 16 samples are displayed in Table 3. Columns 1 to 6 in this table contain the same data shown before in Table 1, with the exception that the actual values of the four independent variables are now displayed instead of the (-) and (+) signs used earlier. Column 7 in Table 3 contains the effect of each of the independent variables (or their interactions) on the resilient modulus parameter. For example, the value 85.56 represents the main effect of the deviator stress, σd, on Mr whereas 11.73 represents the interaction effect of σdσ3 on Mr. Calculation of main and interaction effects were performed using the table of contrast method [Box et al., 1978]. To illustrate, the main effect of σd was calculated as follows:
Effect (σd) = (-58+138-111+313-…..-64+83)/8, where 8 = 2 (k-1) and k = number of variables = 4
Since only 16 test runs were performed without replicates, no direct estimate of the standard error of the effects is possible. However, such an estimate can still be computed from three- and four-factor interactions since these effects can safely be assumed to be negligible, i.e.they do not represent real effects but are rather generated by noise in the data. Using the aforementioned assumption, an estimate of the Standard Error(effect) was calculated to be 19.77.
Table 3 Analysis of Factorial Experiment
ID No σd(kPa) σ3(kPa) γd (kg/m3) m.c. (%) Avg. Mr (MPa) Effect Parameter S-9 34.5 69.0 2150 4 58 117.731 A-5 138.0 69.0 2150 4 138 85.560 σd S-5 34.5 138.0 2150 4 111 22.253 σ3 J-4 138.0 138.0 2150 4 313 11.730 σd σ3 J-9 34.5 69.0 2260 4 70 -10.178 γd S-10 138.0 69.0 2260 4 202 -12.420 σd γd A-7 34.5 138.0 2260 4 95 -42.953 σ3 γd J-7 138.0 138.0 2260 4 167 -39.675 σd σ3 γd S-8 34.5 69.0 2150 6 76 -52.958 m.c. A-6 138.0 69.0 2150 6 90 -35.880 σd m.c. J-5 34.5 138.0 2150 6 50 -32.603 σ3 m.c. S-11 138.0 138.0 2150 6 147 -3.795 σd σ3 m.c J-8 34.5 69.0 2260 6 75 11.213 γd m.c. A-3 138.0 69.0 2260 6 145 6.900 σd γd m.c. A-2 34.5 138.0 2260 6 64 16.733 σ3 γd m.c. J-6 138.0 138.0 2260 6 83 6.210 σd σ3 γd m.c
Standard Error (effect) = 19.77
To interpret the meaning of the effects shown in Table 3, let us examine Figure 3. This figure represents the main and interaction effects of the factors in relation to a reference t-distribution with five degrees of freedom and a scale factor of 19.77. It is evident from this diagram that only the deviator
stress and the moisture content have significant effects on the resilient modulus. Other factors such as σ3 and γd appears to have no effect on Mr. Quantitatively, the effect of increasing the deviator stress by 103.5 kPa results in an equivalent increase of 85.6 MPa in the modulus value. On the other
hand, increasing the moisture content by 2% results in a decrease in the modulus value by 53 MPa.
Figure 3 Main and Interaction Effects Interpretation Findings obtained from the previous analysis of the effects are further substantiated upon performing regression analysis on the test data. Several regression models were postulated to describe the resilient modulus of the material, however, the model that incorporated the deviator stress and moisture content as the independent parameters appears to be the most plausible in explaining the Mr relation. Addition of other parameters into the model did not improve the relation as measured by its R2 -value and consequently these parameters were discarded from the analysis. The final form of the Mr relation is given in equation 2 below.
R2 of model = 0.69
3 DISCRETE ELEMENT MODELLING 3.1 Preamble
As mentioned earlier, the second part of the study involved using the discrete element modelling (DEM) technique to simulate the resilient modulus test. The objective behind this exercise was to examine the ability of the analytical technique to support the interpretation of the resilient modulus test results obtained from the laboratory investigation.
The particulate nature of unbound aggregate materials makes the interpretation of experimental data difficult since test parameters are generally estimated from boundary conditions. DEM, also known as the distinct element method, is best suited to model particulate media. This numerical technique permits the accessibility, at any time of the simulation, to information at the grain level such as inter-particle forces and displacements. Furthermore, it allows for a greater flexibility in
modelling wide ranges of loading configurations, boundary conditions and particle size distributions.
3.2 Resilient Modulus Test Simulation
The study made use of a discrete element program that models aggregates as circular discs. A linear force displacement law governs the interaction between particles at contact points and shear forces are bounded by a maximum value (Coulomb friction law). The program has the capabilities of applying both strain- and stress-controlled rigid boundaries as well as flexible boundaries to simulate membranes used to confine soil samples in laboratory tests.
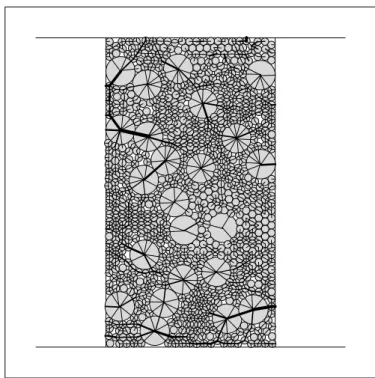
DEM simulation of the resilient modulus test involved three stages; a) compaction, b) confining and c) loading. During the compaction stage, 760 particles were randomly generated with both normal and shear stiffness equal to 8 MPa (the granular material modelled being very soft) and a coefficient of friction between particles of 0.5. Due to current limitations in the program, fines smaller than 420 µm in diameter were not modelled. The percentage corresponding to this range of particle sizes was added to the percentage of particles having a diameter of 420 µm.
The sample was compacted using lateral rigid boundaries to form a 10.16 cm (4”) by 20.32 cm (8”) specimen with a dry density of 2150 kg/m3 (several trial runs were performed to compact a sample with a void ratio of 0.2 corresponding to the desired density). After this is achieved, velocities of the lateral boundaries were set to zero and iterations were continued until the sample reached equilibrium (particle velocities converged to zero). A compacted sample is shown in Figure 4. The lines between the
Figure 4 Interparticle Forces after Compaction m.c σd
-60 -40 -20 0 20 40 60 80 100
( )
Mr 3.97 0.51Ln( )
0.94Ln( )
m.c.K(2)Walaa E.I. Khogali & Morched Zeghal Page 5 particles represent the interparticle forces (the width
of each line is proportional to the magnitude of the force generated).
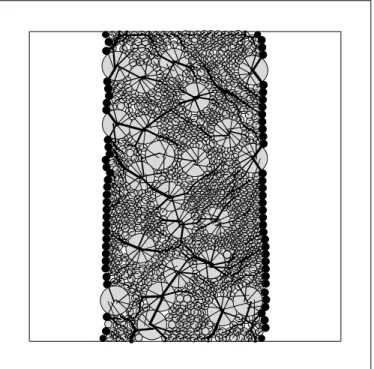
During the confining stage, the lateral rigid boundaries used during compaction were left in place and the sample was subjected to a hydrostatic confining pressure. Lateral confinement was applied by the boundary particles shown in black in Figure 5. Black lines shown in this figure represent the inter-particle forces generated in the sample after confinement. The configuration of the flexible boundary was checked at regular intervals to include any internal particle attempting to move between two external particles. The top of the sample was also subjected to a pressure equal to the lateral stress. Confinement was continued until the sample reached equilibrium under the prescribed level of lateral stress.
Following the confining stage, the prepared sample was subjected to a deviator repetitive stress of specified amplitude to obtain the required modulus. The loading function used during this stage of the simulation has the same characteristics of the one displayed in Figure 2.
Figure 5 Interparticle Forces after Confinement
3.3 Analysis of Simulation Results
Using the steps described in section 3.2 above, four simulations were performed to produce theoretical resilient moduli for samples S-8, A-6, S-5 and S-11 of Table 1. An example output of the stress-strain relation for sample S-8 is shown in Figure 6. It is worth mentioning that this relationship appears to stabilise after few loading cycles, generally less than
20, which is in total agreement with the trend observed during laboratory testing. This finding strongly suggests that the DEM technique has the potential to effectively model the resilient modulus test.
During the analytical study, the resilient modulus for each loading cycle was calculated for every one of the four soil samples modelled. However, only the resilient moduli obtained after the stress-strain relationship stabilises are reported here. Table 4 contains a summary of these values for the four simulations together with their corresponding laboratory values. Close examination of Table 4 reveals that theoretically obtained resilient moduli are generally greater than laboratory ones. The magnitude of the error averages 40%. The authors believe that this discrepancy can greatly be reduced pending further development of the DEM program. Research activities that are currently underway to enhance the program capabilities include:
• ability to model soil moisture;
• ability to model angular aggregates; and • ability to model fine-grained particles.
Figure 6 Stress – Strain Response for Sample S-8 Table 4 Resilient Modulus Test Simulation Results
Confining pressure (kPa) Deviator stress (kPa) Mr simulation (MPa) Mr laboratory (MPa) Error (%) 69 34.5 110 76 44 69 138 135 90 51 138 34.5 162 111 46 138 138 173 147 18
4 SUMMARY AND CONCLUSIONS
This paper presents a systematic and rational approach for characterizing unbound aggregate materials for the design and rehabilitation of roads.
0 2 4 6 8 10 12 14 16 0.00E+0 0
2.00E-04 4.00E-04 6.00E-04 8.00E-04 1.00E-03 1.20E-03 1.40E-03 1.60E-03 1.80E-03
Strain St ress ( p si; 1 p s i = 6.9 kPa)
The approach utilises the resilient modulus as the parameter of choice for the characterization. The premise is that the resilient modulus closely describes the material mechanical behaviour under in-situ traffic loading and environmental conditions.
The study involved a laboratory investigation and an analytical research component. The laboratory investigation examined the influence of four parameters on the resilient modulus of a typical granular material. Effective use of the techniques of experimental factorial design allowed the identification of the cyclic deviator stress and soil moisture content as the significant factors that influence the resilient modulus parameter. Increasing the deviator stress produces a concurrent increase in the resilient modulus whereas moderate increase in moisture content is accompanied by a sharp decrease in the resilient modulus.These finding were further confirmed by using regression analysis to postulate a constitutive law for the material behaviour in term of its resilient response.
The analytical study involved the use of discrete element modelling to simulate the resilient modulus test. The aim was to gain confidence in the use of the resilient modulus as an effective parameter for characterizing granular materials, and also to help support the interpretation of the laboratory results.
Preliminary findings from numerical simulations confirmed the potential of the discrete element method in modelling the resilient modulus test and supported conclusions obtained from the laboratory study. These conclusions give confidence in the use of the resilient modulus as an effective tool for better understanding unbound aggregate material behaviour.
Further developments of the discrete element program are currently underway to reduce the observed discrepancies between laboratory moduli and theoretical moduli obtained through analytical simulations. These include capability to model different particle sizes and shapes, and the ability to model soil moisture.
5 ACKNOWLEDGEMENTS
The authors would like to express their appreciation to the transportation group at the Civil Engineering Department of King Saud University for their support in providing the laboratory test data used in this study. Special thanks are also due to the students and laboratory technicians who performed the resilient modulus tests at KSU.
6 REFERENCES
AASHTO, 1993, Standard Method of Test for Moisture-Density Relations of Soils Using a
10-lb [4.54 kg] Rammer and an 18-in [457 mm] Drops: AASHTO Standard Test Designation T—180-93, American Association of State Highway and Transportation Officials. Barksdale, R G, 1971, Compressive Stress Pulse
Times in Flexible Pavements for Use in Dynamic Testing, Highway Research Record 345, Highway Research Board, pp 32-44. Box, G E P, Hunter, W G & Hunter, J S, 1978,
Statistics for Experimenters: An Introduction to Design, Data Analysis and Model Building, Wiley Series in Probability and Mathematical Statistics.
Brown, S F, 1974, Repeated Load Testing of a Granular Material, J’n’l of Geotechnical Eng. Division, American Soc. Civil Eng’rs. Vol 100, No. G77, pp 825-841.
Brown, S F, 1977, Development in Highway Pavement Engineering: chapter 2- Material Characterisation for Analytical Pavement Design, pp 41-92.
Chang, C S, Chang, Y & Kabir, M, 1992, Micromechanics Modeling for Stress Strain Behaviour of Granular Soils I: theory, J’n’l of Geotechnical Eng. Division, American Soc. Civil Eng’rs. Vol 118, No. 12, pp 1959-1974. Cole, D, Bentley, D, Durell, G & Johnson, T, 1986,
Resilient Modulus of Freeze-Thaw Affected Granular Soils for Pavement Design and Evaluation: Part 1, Laboratory Tests on Soils from Winchendon, Massachusetts, Test Sections, CRREL Report 86-4.
Cundall, P A & Strack, O D L, 1976, The Distinct Element Method as a Tool for Research in Granular Media, Report to the National Science Foundation Concerning NSF Grant ENG76-20711, part 1.
Cundall, P A & Hart, R D, 1989, Numerical of Discontinua, Proc. 1th US Conf. On Discrete Element Method
Dehlen, G L, & Monismith, C L, 1970, The Effect of Non-linear Material Response on the Behaviour of Pavements Under Traffic, Highway Research Record 310, Highway Research Board, pp 1-16.
Pell, P S & Brown, S F, 1972, The Characteristics of Materials for the Design of Flexible Pavement Structures, Proc. 3rd Int'l Conf on the Structural Design of Asphalt Pavement, London, England, pp 326-342.
Seed, H B, Mitry, F G , Monismith, C L & Chan, C K, 1967b, Factors Influencing the Resilient Deformations of Untreated Aggregate Base in Two Layer Pavements Subjected to Repeated Loadings, Highway Research Record 140, Highway Research Board 1967, pp 19-57.