CHARACTERISTICS OF DUST FALLS IN GENOA AND TURIN (NORTHERN ITALY) IN
AUTUMN 1996Pierre OZER 1 and Gabriella LUCCHETTI 2 1
Liege University, Environmental Sciences and Management Department 185, Avenue de Longwy, B-6700 Arlon, Belgium
Tel : 00 32 63230975; e-mail: pozer@ulg.ac.be 2
Università di Genova, Dipartimento per lo Studio del Territorio e sue Rissorse (DIPTERIS) 26, Corso Europa, I-16132 Genova, Italy
Abstract
This paper describes two dust fall events in Genoa and Turin, northern Italy, respectively on 12 November 1996 and 7 December 1996. Meteorological data suggest that the dust-bearing rain that fell in Genoa originated from north-eastern Morocco, where dust mobilisation was reported two days earlier, and had been carried by very strong winds straight to the north-western Italian coast. But the dust fall observed in Turin was not characterised by any specific synoptic situation inducing any dust transport from the southern Mediterranean. The analyses include a quantitative and a qualitative study of two dust samples collected in downtown Genoa and Turin. Total amounts of dust brought down give two very high values of
4.05 g m-2 for Genoa and 0.54 g m-2 for Turin. The median sizes of the dust particles were respectively of 14.6 µm and 25.8 µm. Most of the dust material collected in Genoa showed a yellow-brown to red colour due to a weathered surface with ferric hydroxides was sometimes coated with clayey particles. This attests the Saharan origin of the particles. However, only 15% the material sampled in Turin was coated with red-like clayey material from the desert. A large part of the sample was covered by a carbonic-like substance. In addition, the proportion of organic matter (pollen grains and seeds) as well as of anthropogenic fibrous material was much higher. This suggests that the dust fall observed in Turin was very likely originating from local pollution mixed with a low proportion of long distance Saharan dust.
Key-words: Saharan dust, dust fall, mineral composition, SEM, long-range transport, Genoa, Turin, northern Italy.
1. INTRODUCTION
Arid regions in North and West Africa contribute to the aeolian dust input through a large part of the Northern Hemisphere, from the eastern Mediterranean westwards to the North American Atlantic coast (Goudie & Middleton, 2001; Prospero & Lamb, 2003, Washington et al., 2003).
Atmospheric investigations based on meteorological data and remote sensing analysis have shown that Saharan outbreaks often travel several thousands of kilometres (Deuze et al., 1988; Oliva et al., 1983; Reiff et al., 1986). Chemical and mineralogical dust composition and airborne dust load over the Atlantic Ocean have been well documented from the Canary and the Cape Verde Islands (Bergametti et al., 1989; Coudé-Gaussen et al., 1987, 1994; Rognon et al., 1996) to as far as Florida, the Barbados and the Amazon Basin (Carder et al., 1986; Glaccum & Prospero, 1980; Prospero et al., 1981, 1987; Swap et al., 1992).
On transport northwards through Europe, similar work has been done in the Mediterranean (Chester et al., 1977, 1984; Ganor & Mamane, 1982; Nihlén & Olsson, 1995; Prodi & Fea, 1979; Sala et al., 1996; Tomadin et al., 1984), but Saharan dust can be carried for much longer distances passing over the Alps (De Angelis & Gaudichet, 1991; Wagenbach & Geis, 1989) and the Pyrenees (Dessens & Van Dinh, 1990) to reach Western Europe (Bücher, 1994; Bücher et al., 1983; Coudé-Gaussen, 1991; Coudé-Gaussen et al., 1988; Littmann, 1991) and even Scandinavia (Franzén et al., 1994, 1995, Ansmann et al., 2003).
For what regards human health, air quality deterioration caused by high concentrations of respirable African mineral dust has been reported in various regions far away from the sources, such as the Canary Islands (Viana et al., 2002), Spain (Rodriguez et al., 2001, 2003), and the United Kingdom (Ryall et al., 2002). Such particulate matter air pollution is a serious health threat in various regions of the world because it promotes respiratory infection, cardiovascular disease and other ailments (WHO, 2000; Griffin et al., 2001).
2. THE DUST FALLS OF 12NOVEMBER 1996 IN GENOA AND 7DECEMBER 1996 IN TURIN
On 13 November 1996, a brownish yellow colour dust was observed on cars in the province of Genoa after a very low rainfall. The phenomenon, which occurred in two successive events (Nov. 12 late afternoon and early morning of Nov. 13) was reported on the regional daily newspapers. A few weeks later, on the 7 December 1996, another dark dust fall event was noticed, this time, in the Turin area.
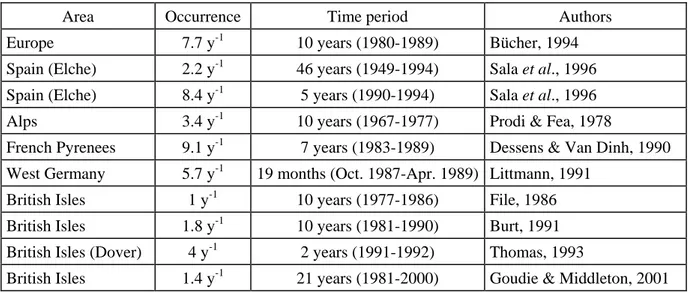
These muddy rains are not uncommon. They can occur several times in the year (Tab. 1) and have become more frequent since the early 1980s (Bücher, 1994; De Angelis & Gaudichet, 1991; Dessens & Van Dinh, 1990). The reason for presenting this study of the dust samples collected in downtown Genoa on November 13 1996 and in Turin on December 7 1996 is the very low probability of dust fall over Europe (less than 8%) from November to February (Dessens & Van Dinh, 1990). This observation has been confirmed by De Angelis & Gaudichet (1991), who found, analysing ice cores from the Mont Blanc (French Alps), high peaks of dust during the spring contrasting sharply with extended concentration minima in winter. Moreover, Littmann (1991), on 92 deposition cases in West Germany, does not present any Saharan dust fall events for the 20 November to 15 December period. Using the daily satellite data from the Total Ozone Mapping Spectrometer (TOMS), Middleton and Goudie (2001) showed that, during year 1999, Saharan dust penetrated the troposphere over the Mediterranean on more than 60% of days throughout the months of March to September, with Mediterranean dust outbreaks recorded on 100% of days in June and August. The least active months for the whole Mediterranean were November and December, both showing less than 15% of days with dusty material over some part of the Mediterranean.
3. THE METEOROLOGICAL SITUATION
The meteorological situation has been studied for the period 10-13 November 1996 thanks to the European Meteorological Bulletin. During the days preceding the dust fall in Genoa, a low pressure area moved slowly from 60°N, 30°W (10 Nov., 00 GMT) southwards to the Portuguese coast (12 Nov., 00 GMT) while a high pressure area remained relatively stable over Turkey. These synoptic conditions produced some very strong surface winds in north-eastern Morocco as well as in north-western Algeria and, on 11 and 12 November at 12 GMT, dust storms were reported in this area (30-33°N, 0-5°W). The trajectory of this North African dust was almost straight, ending in Genoa and carried by south-westerly winds. The analysis of the synoptic maps at 850mbar shows the perfect concordance between the dust source (Morocco-Algeria) and the transit through the Ligurian Gulf, where winds converge (Ozer et al., 1998). The two very low rainfalls which washed out the sky of Genoa from the Saharan dust were generated by low level clouds.
The same type of analysis has been realised for the dust fall in Turin. Surprisingly, no specific synoptic situation inducing any dust transport from the southern Mediterranean has been detected.
4. SAMPLING AND LABORATORY PROCEDURE
Two dust samples were collected on a 50 x 25 cm surface on the body of two cars parked in downtown Genoa and Turin on the day of the event. We made sure that the cars were clean before the dust-bearing rain fell and that they had not been driven since the rain. The dust was carefully collected with a paintbrush. Several measurements were done in laboratory: - estimation of dust fall rate per m2;
- granulometry;
- chemical composition.
5. DUST AMOUNTS
The quantity of dust deposited per m2 was calculated knowing the amount of sediment on the 0.125 m2 surface. Total amounts of dust collected in Genoa on the 13th of November 1996 give a very high value of 4.05 g m-2. These concentrations are quite exceptional for a single event and can sometimes represent a high volume (up to 70%) of the total annual dust deposition (Le Bolloch et al., 1996). As a matter of fact, the value measured in Genoa is almost five times greater than the quantity deposited in Bologna in 1977 which was 0.833 g m-2, as measured by Prodi & Fea (1979). But higher dust deposits have been already recorded as, for example, in south-west France with 8 g m-2 in February 1972 (Bücher & Lucas, 1972) and 6 g m-2 in July 1983 (Bücher & Lucas, 1984). On the other hand, the gross quantity of dust brought down in Turin is 0.54 g m-2.
It would be hazardous for us to estimate the yearly dust deposition in the Ligurian area because of the poor data available on this topic over Europe. Indeed, all direct measurements concern relatively short periods (from 2 to 11 years) and are only carried out in the Mediterranean islands. Moreover, these studies started while several researchers (e.g. Dessens & Van Dinh, 1990) pointed out the drastic increase of dust outbreaks over Europe to the scientific community. Therefore, the short-term data presented in table 2 could be overestimated and might be reviewed downward after longer recordings if this last decade is recognised as an epiphenomenon.
TABLE 2
For this reason, the comparison with the values of African dust found in ice cores drilled in the Alps will not be possible. Nevertheless, as shown on Table 2, the highest yearly dust
deposition is measured in the Eastern Mediterranean where the average value is 21 g m-2 in Crete (Nihlén & Olsson, 1995), while the different measurements give values ranging from 1 and 12 g m-2 in the Western Mediterranean (Le Bolloch & Guerzoni, 1995; Le Bolloch et al., 1996; Guerzoni & Molinaroli, 1997) and are between 0.4 to 1 g m-2 in the Alps (Wagenbach & Geis, 1989; De Angelis & Gaudichet, 1991).
6. GRANULOMETRY OF DUST
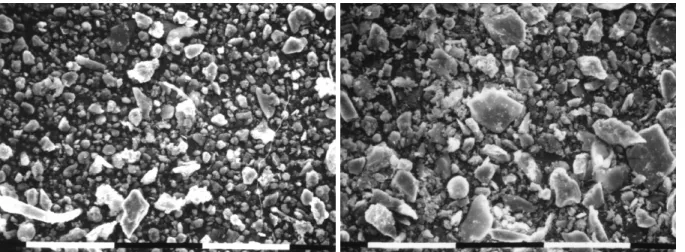
The volume size distribution of the dust was carried out by the Coulter Counter Technique with an orifice tubing of 140 µm. A part of the two samples is presented (SEM micrographs) on figure 1.
FIGURE 1
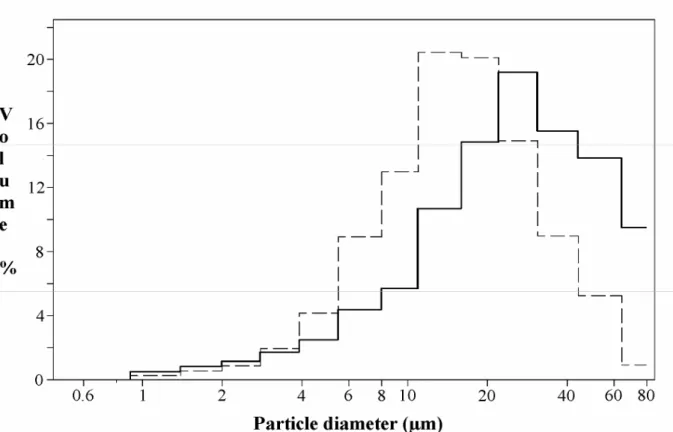
In Genoa, the two consecutive dust falls are mainly composed of silts with no sand content; the particles size is ranging from <1 to 64 µm and present a median value of 14.6 µm (Fig. 2) which is a very important value compared to other analyses available in the literature (Tab. 3) where they all ranged from 2.2 to 20 µm. The grain size distribution is monomodal which proves, according to Littmann (1991), that the dust came from a single source, and this for the two consecutive dust fall events in Genoa. Moreover, significant number of particles identified as coming from the Sahara have a size larger than 30 µm (Fig. 4c); if they are not uncommon (Coudé-Gaussen, 1991), this phenomenon is incompatible with the classical physico-mathematical models. As a matter of fact, Tomadin et al. (1984) estimate that, under normal conditions, significant quantities of particles > 16 µm are usually deposited during the first thousand kilometres of transport; the median size of the samples analysed attests very turbulent wind conditions able to maintain quite large particles in suspension in the air over more than 2000 km.
In Turin, the dust collected, mostly composed of silts with very low sand content (particles sizes ranging from <1 to 88 µm), presents a very high median value of 25.8 µm (Fig. 2), which is very significant and leads us to doubt about the Saharan origin of the material fallen in Turin.
FIGURE 2
TABLE 3
7. MINERAL COMPOSITION OF DUST
A sampling of about 6000 grains was examined under an optical microscope for both dust falls; the observation was made in polarised light and phase contrast with immersion in water and in a liquid of known refractive index (n = 1.54).
7.1. Genoa
The particles are very inhomogeneous and are grouped as follow:
1- More than 90% of the dust material is represented by grains of size ranging from 2 to 40 µm, rarely larger. They generally show a yellow-brown to red colour due to a weathered surface with ferric hydroxides. They are sometimes coated with clayey particles.
The principal mineral compounds are:
1.a- Grains characterised by high roundness and elevated sphericity; composed of highly weathered minerals phases or by clayey aggregates; they show a marked red pigmentation. 1.b- Quartz grains highly rounded and coated (Fig. 3.c); also a few quartz grains poorly pigmented and showing sharp angles.
1.d- Rounded calcite grains of brownish coloration, with a lightly corroded surface and a turbid aspect (Fig. 3.a).
1.e- Amphibole grains (± 1%) of highly variable dimension: width ranging from 2 to 40 µm and length from 8 to 200 µm. The degree of weathering is very inhomogeneous and some grains show a corroded surface, sometimes strongly pigmented.
1.f- Pyroxene grains, less common than the amphiboles and with smaller dimensions: width ranging from 2 to 20 µm and length from 3 to 50 µm with an weathering similar to the one of the amphiboles.
1.g- Phyllosilicate grains (± 1%) of red-brownish coloration; the flake diameter meanly ranges from 10 to 40 µm. In most cases, these are partially weathered biotites or vermiculite derived from weathered biotite.
2- Anthropogenic fibrous material (like Fig. 3.f): a- synthetic fibres (about 2%);
b- glassy fibres (about 1%).
Most of these types of particles are longer than 100 µm. Glassy fibres especially do not show any kind of weathering processes or important mechanical effects. They have therefore been brought on very short distances and attest of probable local pollution.
3- Special aggregates of organic compounds, often mixed with mineral granules, especially calcite. Once again, their origin could be linked to local pollution but also associated to the long-distance transport of stable organic compounds (Franzén et al., 1994).
4- Grains which reach a size of 100 µm or more (± 2%) but without evidence of pedogenic weathering. They are mainly composed of:
b- Calcite often in relatively large aggregates.
The characteristics of these grains and agglomerates indicate the evidence of local dust contribution.
5- Opaque organic grains with a size larger than 100 µm (± 3%) are likely pitch.
6- Few whole diatoms always of the same dimension: 10 µm (Fig. 3.b). Their characteristic form is unknown but they probably are freshwater diatoms as often found as far as Paris or Germany in Saharan dust fall over Europe (Coudé-Gaussen, 1991; Littmann, 1991). They are very common over the West African coast where their concentration can exceed 25 million whole diatoms per gram of airborne dust collected in the atmosphere (Melia, 1984).
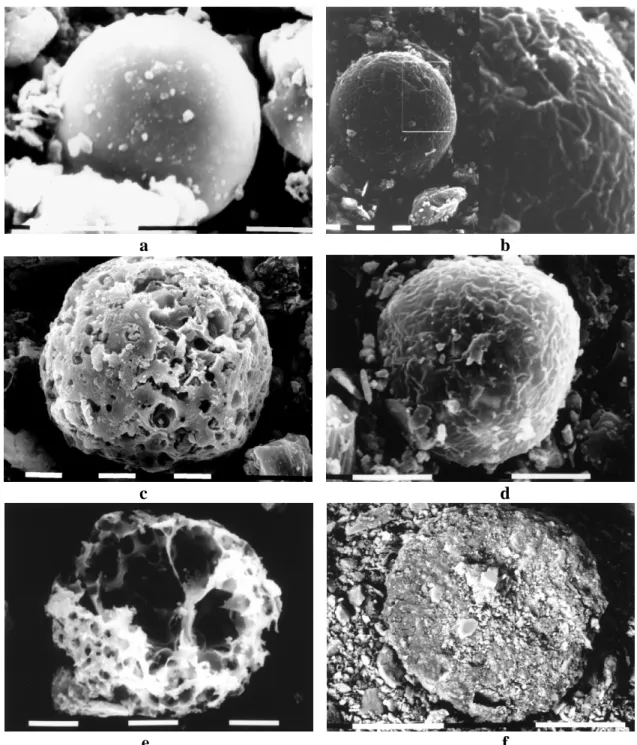
7- Finally, of particular interest is the presence of some perfectly spherical grains with an extremely smooth surface without traces of weathering, limpid, transparent, lightly yellow, isotropic and with a diameter ranging from 20 to 40 µm (like Fig. 4.a). Their nature seems to correspond to glassy grains. These spherules do not show any weathering features. Although the most probable sources are the industrial emissions, as supposed by Coudé-Gaussen (1991), two other possible origins could be proposed: a) volcanic dust produced by an explosive eruption; b) cosmic dust formed by disintegration of meteorites entering the Earth’s atmosphere.
FIGURE 3
7.2. Turin
In the dust fall collected in Turin, the mineral composition is: - Quartz, slightly predominant;
- Pyroxene, poorly elaborated; - Amphibole (up to 2 mm long); - Epidote, very scarce;
- Chrysotile fibres, very scarce.
Compared with Genoa, most parts of the particles are larger, ranging from 10 to 200 µm, and coarser (e.g. Quartz, Fig. 3.d). The proportion of asbestos fibres (Fig. 3.e) reaches 2‰. Only 15% of the particles are coated with red-like clayey material from the desert. A large part of the sample is covered by a carbonic-like substance which impedes the analysis of the particles surface. The proportion of organic matter (pollen grains and seeds) as well as of anthropogenic fibrous material is also much higher. We also have to underline the frequent presence of spongy and highly porous particles which should be soot (> 1%) with dimensions up to 100 µm (Fig. 4.c & e), glassy spherules (± 2‰) with diameters up to 50 µm (Fig. 4.a), others types of spherules which should result from industrial emissions (Fig. 4.b & d), and very large flat spherical “framboide” aggregates resulting from anthropogenic emissions. The dust fall over Turin seems therefore to have been characterised by a high proportion of local natural input and anthropogenic pollution with a low proportion of desert-like material. Such situation, that is a contribution of Saharan dust in the aerosols, has been observed elsewhere in southern Europe (Putaud et al., 2004) as some of the fine fraction of dust can remain into the atmosphere during several days before being precipitated by rainfalls.
FIGURE 4 8. CHEMICAL COMPOSITION OF DUST
The dust particles, once metallized with gold, have been analysed with a scanning electron microscope (SEM). A semi-quatitative chemical analysis has been realised on four windows
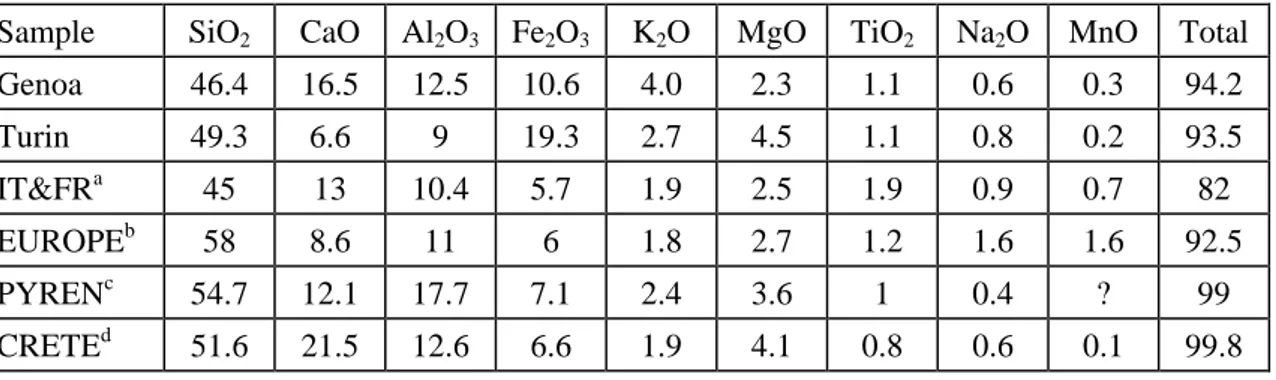
for each dust fall, on a specifically prepared sample presenting a high grain concentration as in Figure 1. The result of this analysis is presented in Table 4, which shows the percentage of the major elements contained in the muddy rains.
The first observation of Table 4 leads to an obvious conclusion: the relative concentration of crustal elements, considered as characteristic of the continental erosion (Al,Si,K,Ca,Fe), is very different in the two samples. Indeed, the proportion of Fe2O3 and MgO in Turin is remarkably higher whereas CaO and Al2O3 are clearly less represented with respect to the sample collected in Genoa. Thus, this indicates that the dust sources are different.
Coudé-Gaussen (1982) underlines the evident affinity between the mean chemical compositions of the Saharan dust collected over Europe, which, indeed, fits well with the data found by Bücher et al. (1983) in the Pyrenees, while the analyses made by Nihlén and Olsson (1995) in Crete are quite different probably because of the different dust sources (essentially southern Tunisia) affecting the Eastern Mediterranean. The comparison of the Western Europe measurements with the Genoa and Turin samples shows an important difference in the proportion of Fe2O3 which is two or three times higher respectively in Genoa and Turin. The ratio of K2O is also more than twice higher in Genoa than the European means, whereas the proportion of MnO remains very low in our samples.
TABLE 4
The chemical composition of the spherules found in the two samples has been determined with the SEM, measuring also their dimension, because of the very poor literature relative to these spherical particles (Del Monte et al., 1984).
The three spherules found in the dust collected in Genoa present similar chemical composition with Si,Al,Ca,Fe,K,Ti as major constituents. Their dimensions are 20, 30 and 40 µm.
On the sample collected in Turin, a deepest study on sixty spherules has been carried out. The results are presented in Table 5.
TABLE 5
- Group I: 30% of the spherules have Si, Fe and Al as common constituents with Ca, S, Ba, K, Ti, Mn or Mg in variable amounts; they are perfectly smooth (Tab. 5). Their diameter ranges from 4 to 40 µm, the median size is 14 µm.
- Group II: 25% of the spherules are similar in composition to the ones found in Genoa: [Si,Al,Ca,Fe,K,Ti]; they are perfectly smooth with diameter ranging from 2 to 50 µm, the median size is 10 µm (Fig. 4.a).
- Group III: 25% are only composed by iron (Fe2O3TOT>95%) and are perfectly smooth. Their diameter ranges from 2 to 30 µm, the median size is 10 µm (Tab. 5).
- Group IV: 10% of the spherules have a complex and variable composition with [Si,Ba,S,Fe,Ca,K,Al,Mg] as major constituents; they show a relatively rough surface. Their diameter ranges from 20 to 30 µm and their median size is 23 µm (Fig. 4.d).
- Group V: 10% have a chemical composition characterized by one (Ti, Fig. 4.b, or Cu) (Tab. 5) or few (Ti,Ca; Cl,Fe; Fe,Ca; Si,Ba,S) elements as major constituents. Their surface is slightly rough. Their diameter ranges from 8 to 25 µm, the median size is 18 µm.
The two dust fall events in northern Italy in autumn 1996 are only two among so many others well documented in Europe during the last decades. However, these events were special in many respects:
a) the low probability of dust fall over Europe from November to February;
b) the total amount of dust fallen in Genoa on the 13th of November 1996 was 4.05 g m-2 which is quite a rare concentration for a single event. The dust fall in Turin was more ordinary with 0.54 g m-2 on the 7th of December 1996.
c) the high median sizes of the dust particles which were of 14.6 µm and 25.8 µm respectively in Genoa and Turin.
The dust material was collected downtown in important urban areas and was therefore polluted. The local particles input is estimated at 8% in Genoa, which reduces the Saharan contribution to the still high value of 3.73 g m-2. On the other hand, local dusts appear to have made the greatest contribution to deposition in Turin. With only 15% of the material which presents a desert origin, about 0.08 g m-2 came from the Sahara.
With regard to the genesis of the various types of spherules found in the two samples: Groups 1 and 2: an in-depth study of their possible origins has to be carried on;
Group 3: they could be oxides of pedogenic origin (possibly maghemite) or, alternatively, industrial products;
REFERENCES
Ansmann A., Bösenberg J., Chaikovsky A., Comerón A., Eckhardt S., Eixmann R., Freudenthaler V., Ginoux P., Komguem L., Linné H., Márquez M.Á.L., Matthias V., Mattis I., Mitev V., Müller D., Music S., Nickovic S., Pelon J., Sauvage L., Sobolewsky P., Srivastava M.K., Stohl A., Torres O., Vaughan G., Wandinger U. and Wiegner M., 2003. Long-range transport of Saharan dust to northern Europe: The 11–16 October 2001 outbreak observed with EARLINET. J. Geophys. Res., 108, No. D24, 4783, doi: 10.1029/2003JD003757.
Bergametti G., Gomes L., Coudé-Gaussen G., Rognon P. and Le Coustumer M.N., 1989. African dust observed over Canary Islands: Source-regions identification and transport pattern for some summer situations. J. Geophys. Res., 94: 14855-14864.
Bücher A., 1994. Etude en Europe des retombées de poussières d'origine saharienne. R.G.D., 43, 1: 23-25.
Bücher A. and Lucas C., 1972. Le nuage de poussière rouge du 7 février 1972. Bull. Soc. Hist. nat. Toulouse, 108, 3/4: 437-445.
Bücher A. and Lucas C., 1984. Sédimentation éolienne intercontinentale, poussières sahariennes et géologie. Bull. Centres Rech. Explor.-Prod. Elf-Aquitaine, 8, 1: 151-165. Bücher A., Dubief J. and Lucas C., 1983. Retombées estivales de poussières sahariennes sur l'Europe. Rev. Géol. Dyn. Géogr. Phys., 24, 2: 153-165.
Carder K.L., Steward R.G., Betzer P.R. and Prospero J.M., 1986. Dynamics and composition of particles from aeolian input event to the Sargasso sea. J. Geophys. Res., 91: 1055-1066. Chester R., Baxter G.G., Behairy A.K.A., Connor K., Cross D., Elderfield H. and Padgham R.C., 1977. Soil-sized dusts from the lower troposphere of the Eastern Mediterranean Sea. Mar. Geol., 24: 201-217.
Chester R., Sharples E.J., Sanders G.S. and Saydam A.C., 1984. Saharan incursion incursion over the Tyrrhenian Sea. Atmospheric Environment, 18: 929-935.
Coudé-Gaussen G., 1982. Les poussières éoliennes sahariennes: mise au point. Rev. Géomorph. Dyn., 31, 2: 49-70.
Coudé-Gaussen G., 1991. Les poussières sahariennes. Cycle sédimentaire et place dans les environnements et paléoenvironnements désertiques. John Libbey Eurotext, Paris, 485 p. Coudé-Gaussen G., Désiré E. and Regrain R., 1988. Particularité des poussières sahariennes distales tombées sur la Picardie et l'Ile-de-France le 7 mai 1988. Hommes et Terres du Nord, 4: 246-251.
Coudé-Gaussen G., Rognon P. and Le Coustumier M., 1994. Incorporation progressive de poussières sahariennes aux limons des îles orientales du Cap Vert. C. R. Acad. Sci. Paris, 319, série II, 1343-1349.
Coudé-Gaussen G., Rognon P., Bergametti G., Gomes L., Strauss B., Gros J.M. and Le Coustumer M.N., 1987. Saharan dust on Fuerteventure Island: chemical and mineralogical characteristics, air mass trajectories and probable sources. J. Geophys. Res., 92: 9753-9771. De Angelis M. and Gaudichet A., 1991. Saharan dust deposition over Mont Blanc (French Alps) during the last 30 years. Tellus, 43B: 61-75.
Del Monte M., Landuzzi V., Lenaz R., Sabbioni C. and Tomadin L., 1984. Characterization of individual airborne particles: an open problem. Mem. Soc. Geol. It., 27: 303-309.
Dessens J. and Van Dinh P., 1990. Frequent Saharan dust outbreaks north of the Pyrenees: a sign of a climatic change?. Weather, 45, 9: 327-333.
Deuze J.L., Devaux C., Herman M., Santer R. and Tanre D., 1988. Saharan Aerosols over the South of France: Characterization Derived from Satellite Data and Ground Based Measurements. J. Appl. Meteor., 27: 680-686.
File R.F., 1986. Dust deposits in England on 9 November 1986. Weather, 41, 6: 191-195. Franzén L.G., Hjelmroos M., Kallberg P., Brorström-Lundén E., Juntto S. and Savolainen A.L., 1994. The ‘Yellow Snow’ episode of northern Fennoscandia, March 1991. A case study of long-distance transport of soil, pollen and stable organic compounds. Atmospheric Environment, 28, 22: 3587-3604.
Franzén L.G., Hjelmroos M., Kallberg P., Rapp A., Mattsson J.O. and Brorström-Lundén E., 1995. The Saharan dust episode of south and central Europe, and northern Scandinavia, March 1991. Weather, 50, 9: 313-318.
Ganor E. and Mamane Y., 1982. Transport of Saharan dust across the eastern Mediterranean. Atmospheric Environment, 16, 3: 581-587.
Glaccum R.A. and Prospero J.M., 1980. Saharan aerosols over the tropical North Atlantic. Mineralogy. Mar. Geol., 37: 295-321.
Goudie, A.S. and MiddletonN.J.,2001. Saharan dust storms: nature and consequences. Earth-Science Reviews, 56, 179-204.
Griffin D.W., Kellogg C.A. and Shinn E.A., 2001. Dust in the wind: Long range transport of dust in the atmosphere and its implications for global public and ecosystem health. Global Change and Human Health, 2: 20-33.
Guerzoni S. and Molinaroli E., 1997. Le polveri sahariane. Le Scienze, 341: 68-75.
Le Bolloch O. and Guerzoni S., 1995. Acid and alkaline deposition in precipitation on the western coast of Sardinia, Central Mediterranean (40°N,8°E). Water, Air and Soil Pollution. 85: 2155-2160.
Le Bolloch O., Guerzoni S. and Molinaroli E., 1996. Atmosphere-ocean mass fluxes at two coastal sites in Sardinia (39-41°N,8-10°E). In: The impact of desert dust across the Mediterranean (eds. Guerzoni S. & Chester R.), Kluwer Academic Publ., 217-222.
Littmann T., 1991. Recent African dust deposition in West Germany - Sediment characteristics and climatological aspects. Catena suppl., 20: 57-73.
Melia M.B., 1984. The distribution and relationship between palynomorphs in aerosols and deep-sea sediments off the coast of northwest Africa. Mar. Geol., 58: 345-371.
Middleton N.J. and Goudie A.S., 2001. Saharan dust: sources and trajectories. Transactions of the Institute of British Geographers, 26, 165-181, 2001.
Nihlén T. and Olsson S., 1995. Influence of eolian dust on soil formation in the Aegean area. Z. Geomorph. N.F., 39, 3: 341-361.
Oliva P., Coudé-Gaussen G., Delannoy H., Dorize L., Rognon P. and Tabeaud M., 1983. Etude de la dynamique de quelques lithométéores sahariens par la télédétection spatiale. Meditérranée, 3: 21-52.
Ozer P., Erpicum M., Cortemiglia G.C. and Lucchetti G., 1998. A dustfall event in November 1996 in Genoa, Italy. Weather, 53: 140-145.
Pitty A., 1968. Particle size of the Saharan dust which fell in Britain in July 1968. Nature, 220: 364-365.
Prodi F. and Fea G., 1978. Transport and deposition of saharan dust over the Alps. Proc. 15 Int. Tagung Meteorol., 1: 179-182.
Prodi F. and Fea G., 1979. A case of transport and deposition of saharan dust over the Italian peninsule and Southern Europe. J. Geophys. Res., 84, C11: 6951-6960.
Prospero J.M. and Lamb P.J., 2003. African droughts and dust transport to the Carribean: Climate change implications. Science, 302: 1024-1027.
Prospero J.M., Glaccum R.A. and Nees R.T., 1981. Atmospheric transport of soil dust from Africa to South America. Nature, 289: 570-572.
Prospero J.M., Nees R.T. and Uematsu M., 1987. Deposition rate of particulate and dissolved aluminum derived from Saharan dust in precipitation at Miami, Florida. J. Geophys. Res., 92: 14723-14731.
Putaud J.P., Raes F., Van Dingenen R., Brüggemann E., Facchini M.C., Decesari S., Fuzzi S., Gehrig R., Hüglin C., Laj P., Lorbeer G., Maenhaut W., Mihalopoulos N., Müller K., Querol X., Rodriguez S., Schneider J., Spindler G., ten Brink H., Tørseth K. and Wiedensohler A., 2004. A European aerosol phenomenology–2: chemical characteristics of particulate matter at kerbside, urban, rural and background sites in Europe. Atmospheric Environment, 38: 2579-2595.
Reiff J., Forbes G.S., Spieksma F.T.M. and Reynders J.J., 1986. African dust reaching northwestern Europe: A case study to verify trajectory calculations. J. Climate Appl. Meteor., 25: 1543-1567.
Rodriguez S., Querol X., Alastuey A., Kallos G. and Kakaliagou O., 2001. Saharan dust contributions to PM10 and TSP levels in Southern and Eastern Spain. Atmospheric Environment, 35: 2433-2447.
Rodriguez S., Querol X., Alastuey A., Viana M. and Mantilla E., 2003. Events affecting levels and seasonal evolution of airborne particulate matter concentrations in the Western Mediterranean. Environmental Science & Technology, 37: 216-222.
Rognon P., Coudé-Gaussen G., Revel M., Grousset F.E. and Pedemay P., 1996. Holocene Saharan dust deposition on the Cape Verde Islands: sedimentological and Nd-Sr isotopic evidence. Sedimentology, 43: 359-366.
Ryall D.B., Derwent R.G., Manning A.J., Redington A.L., Corden J., Millington W., Simmonds P.G., O'Doherty S., Carslaw N. and Fuller G.W., 2002. The origin of high particulate concentrations over the United Kingdom, March 2000. Atmospheric Environment, 36: 1363-1378.
Sala J.Q., Cantos J.O. and Chiva E.M., 1996. Red dust rain within the Spanish Mediterranean aera. Clim. Change, 32: 215-228.
Swap R., Garstang M., Greco S., Talbot R. and Kallberg P., 1992. Saharan dust in the Amazon Basin. Tellus, 44B: 133-149.
Tomadin L., Lenaz R., Landuzzi V., Mazzucotelli A. and Vannucci R., 1984. Wind-blown dusts over the Central Mediterranean. Oceanologica Acta, 7, 1: 13-23.
Viana M., Querol X., Alastuey A., Cuevas E. and Rodriguez S., 2002. Influence of African dust on the levels of atmospheric particulates in the Canary Islands air quality network. Atmospheric Environment, 36: 5861-5875.
Wagenbach D. and Geis K., 1989. The mineral dust record in a high alpine glacier (Colle Gnifetti, Swiss Alps). In: Paleoclimatology and paleometeorology: modern and past patterns of global atmospheric transport (eds. Leinen M. & Sarnthein M.). Kluwer Academic Publ., NATO ASI Series, Serie C282, 543-564.
Washington R., Todd M., Middleton N.J. and Goudie A.S., 2003. Dust-storm source areas determined by the Total Ozone Monitoring Spectrometer (TOMS) and surface observations. Annals of the Association of American Geographers, 93: 299-315.
Table 1: Occurrence of dust falls over Europe according to various authors.
Area Occurrence Time period Authors
Europe 7.7 y-1 10 years (1980-1989) Bücher, 1994 Spain (Elche) 2.2 y-1 46 years (1949-1994) Sala et al., 1996 Spain (Elche) 8.4 y-1 5 years (1990-1994) Sala et al., 1996 Alps 3.4 y-1 10 years (1967-1977) Prodi & Fea, 1978
French Pyrenees 9.1 y-1 7 years (1983-1989) Dessens & Van Dinh, 1990 West Germany 5.7 y-1 19 months (Oct. 1987-Apr. 1989) Littmann, 1991
British Isles 1 y-1 10 years (1977-1986) File, 1986 British Isles 1.8 y-1 10 years (1981-1990) Burt, 1991 British Isles (Dover) 4 y-1 2 years (1991-1992) Thomas, 1993
Table 2: Yearly dust deposition in Europe according to various authors.
Area Yearly dust deposition Time period Authors Aegean Area 21 (11.2-36.5) g m-2 5 years (1988-1992) Nihlén & Olsson, 1995 Western Sardinia 0.7-2 g m-2 2 years (1992-1994) Le Bolloch & Guerzoni, 1995 Southern Sardinia 6-13 g m-2 5 years (1990-1995) Le Bolloch et al., 1996 Central Corsica 12 (5-25) g m-2 11 years (1984-1994) Guerzoni & Molinaroli, 1997 French Alps 1 g m-2 31 years (1955-1985) De Angelis & Gaudichet, 1991 Swiss Alps 0.4 g m-2 47 years (1936-1982) Wagenbach & Geis, 1989
Table 3: Median size of dust fall over Europe according to various authors.
Area Median size Observations Authors Europe 4-12 µm 77 (1980-1989) Bücher, 1994
France 8-20 µm 4 (1981-1988) Coudé-Gaussen, 1991 French Pyrenees 8 µm 1 (16 October 1988) Dessens & Van Dinh, 1990 Aegean Area 8 µm ? (1988-1992) Nihlén & Olsson, 1995 Swiss Alps 4.5 ± 1.5 µm ? (1936-1982) Wagenbach & Geis, 1989 British Isles 10 µm 1 (9 November 1986) File, 1986
Britain 9 µm 1 (July 1968) Pitty, 1968 West Germany 2.2-16 µm 9 (Oct. 1987-Apr. 1989) Littmann, 1991 Swedish west coast 2.6 µm 1 (29 October 1987) Franzén, 1989
Table 4: Chemical composition: major elements of both dust falls in Genoa and Turin. Comparison with Coudé-Gaussen (1982) a dust falls over Italy and France from 1813 to 1926 (13 samples) and
b
dust falls over Europe (7 samples), c Bücher et al. (1983) on a dust outbreak in the Pyrenees in 1980 and d Nihlén & Olsson (1995) on four stations of Crete.
Sample SiO2 CaO Al2O3 Fe2O3 K2O MgO TiO2 Na2O MnO Total
Genoa 46.4 16.5 12.5 10.6 4.0 2.3 1.1 0.6 0.3 94.2 Turin 49.3 6.6 9 19.3 2.7 4.5 1.1 0.8 0.2 93.5 IT&FRa 45 13 10.4 5.7 1.9 2.5 1.9 0.9 0.7 82 EUROPEb 58 8.6 11 6 1.8 2.7 1.2 1.6 1.6 92.5 PYRENc 54.7 12.1 17.7 7.1 2.4 3.6 1 0.4 ? 99 CRETEd 51.6 21.5 12.6 6.6 1.9 4.1 0.8 0.6 0.1 99.8
Table 5: Major element composition of some analysed spherules found in the Turin’s dust sample.
Group I Group III Group V
Si,Al,Fe Si,Al,K Si,Al,Ti Si,Ca,Al Si,Al,K Iron Copper Titanium
Na2O 0.15 0.38 - 0.09 - 0.14 - - MgO 1.08 1.73 0.90 6.72 1.24 0.28 - - Al2O3 33.50 35.57 24.85 17.38 28.99 0.40 - 3.63 SiO2 55.68 55.68 46.49 34.91 55.74 1.59 0.52 1.10 S 0.41 - - - - Cl 0.33 - - - - K2O 2.71 3.85 2.87 5.34 6.10 0.08 0.08 - CaO 0.69 0.59 5.73 22.51 0.73 0.34 0.24 0.28 TiO2 1.12 0.30 12.11 1.93 1.40 0.17 0.15 94.39 Cr2O3 - - - 0.30 - 0.16 0.09 0.05 MnO - - - 0.94 - 0.21 0.05 - Fe2O3TOT 3.64 1.90 7.05 9.89 5.79 96.63 0.59 0.53 CuO - - - 98.28 0.02
Figure 2: Size distribution, in percentage of volume, of the dust collected in Genoa (dashed line) and Turin (solid line).
a b c d e f
Figure 3: SEM micrographs showing some specific compounds of the dust fall in Genoa [GE] and Turin [TU].
a) Typical rounded desertic material: 1: Calcite, 2: K-feldspar, 3: Quartz, GE, scale = 100 µµµµm; b) Unknown form of diatom, Si, GE, scale = 10 µµµµm;
c) Highly rounded quartz silt grain, GE, scale = 50 µµµµm, zoom (x 4.3) on the impact features; d) Angular quartz silt grain, TU, scale = 10 µµµµm;
e) Serpentine, TU, scale = 100 µµµµm;
a b c d e f
Figure 4: SEM micrographs showing some unknown or anthropogenic compounds of the dust fall in Turin.
a) Perfectly spherical and smooth particle common to all samples with unknown origin (fly-ash ? according to Coudé-Gaussen, 1991, p. 93), [Si,Al,Ca,Fe,K,Ti], scale = 10 µµµµm; b) Spherical particle of titanium probably industrial emission, scale = 5 µµµµm, zoom (x 3.8) on
the relatively rough surface; c) Soot particle, scale = 10 µµµµm;
d) Type of spherule, probably industrial emission, [Si,Ba,S,Fe,Ca,K,Al,Mg], scale = 10 µµµµm; e) fly-ash, [Si,Fe,Ca,Cl,Al,Ti], scale = 10 µµµµm;


![Figure 3: SEM micrographs showing some specific compounds of the dust fall in Genoa [G E ] and Turin [T U ]](https://thumb-eu.123doks.com/thumbv2/123doknet/5524918.131981/26.892.130.769.101.847/figure-sem-micrographs-showing-specific-compounds-genoa-turin.webp)