HAL Id: hal-01417491
https://hal.archives-ouvertes.fr/hal-01417491
Submitted on 15 Dec 2016
HAL is a multi-disciplinary open access archive for the deposit and dissemination of sci-entific research documents, whether they are pub-lished or not. The documents may come from teaching and research institutions in France or abroad, or from public or private research centers.
L’archive ouverte pluridisciplinaire HAL, est destinée au dépôt et à la diffusion de documents scientifiques de niveau recherche, publiés ou non, émanant des établissements d’enseignement et de recherche français ou étrangers, des laboratoires publics ou privés.
How can big data be used to reduce uncertainty in
stormwater modelling?
Nanée Chahinian, Anne-Laure Piat-Marchand, Sandra Bringay, Maguelonne
Teisseire, Elodie Boulogne, Laurent Deruelle, Mustapha Derras, Carole
Delenne
To cite this version:
Nanée Chahinian, Anne-Laure Piat-Marchand, Sandra Bringay, Maguelonne Teisseire, Elodie Boulogne, et al.. How can big data be used to reduce uncertainty in stormwater modelling?. Spatial Accuracy, Jul 2016, Montpellier, France. pp.322-329. �hal-01417491�
How can big data be used to reduce uncertainty in stormwater modelling?
Nanée Chahinian*1, Anne-Laure Piat-Marchand2, Sandra Bringay2, Maguelonne Teisseire3, Elodie Boulogne4, Laurent Deruelle5, Mustapha Derras5, Carole Delenne4
1IRD, HSM (CNRS, IRD, UM), France 2Univ. Montpellier 3, LIRMM (CNRS, UM), France
3TETIS, IRSTEA, France
4Univ. Montpellier, HSM (CNRS, IRD, UM), France 5Berger-Levrault, France
*Corresponding author: nanee.chahinian@ird.fr
Buried utility networks are often not fully documented and inaccurate positioning of network el-ements may impact hydraulic modelling applications. This study aims to put forward a method-ology to extract network characteristics from data that is posted on the web or is available through sector specific databases, using heterogeneous text scrapping methods.
I INTRODUCTION
Urban growth is an ongoing trend and one of its direct consequences is the development of buried utility networks. With growing needs among consumers, new networks are being in-stalled and more underground space is being occupied. Locating these networks is becoming a challenging task. Mispositioning of utility networks is an important problem for both industri-alised and developing countries and will worsen as cities expand and their networks increase in size and complexity (Jamil et al.,2012;Metje et al.,2007). Over the past century, it was com-mon practice for public service providers to install, operate and repair their networks separately (Rogers et al., 2012). Now local authorities are confronted with the task of combining data produced by different parties, having distinct formats, variable precision and granularity (Chen and Cohn,2011). Although in certain countries contractors are now obliged by law to position all buried networks within set precision ranges, finding data related to older network branches is a cumbersome task. Once located these data are often unavailable at the desired precision or are prone to errors or omissions. Since the mid 90’s, an increasing volume of data is posted on the web or is available through sector specific databases. An alternative and complementary approach to field surveys would be to track down archived data by using new methods of het-erogeneous texts scrapping. Hence the objective of this work is to assess whether big data can be used to reduce uncertainty in stormwater modelling. The big data used in this study is origi-nal information scrapped from the web such as calls for tenders, newspaper articles, consumer complaints, etc. Information extracted with text mining techniques such as used in Kergosien et al.(2015) are particularly interesting to confirm or infirm the position, the depth, the mate-rial of buried network elements. Call for tenders often include additional technical descriptions (slope, local constraints, junctions, etc.) which may be used to build an attribute table, that contains the characteristics of the underlying pipes.
This study is a part of a global project which aims to recreate a stormwater and a sewage network in settings where no accurate information regarding the position or characteristics of buried utility networks is available. A previous study (Pasquet et al.,2016) put forward a methodology to detect manhole covers and inlet grates from aerial images. The results were encouraging but dealt only with the correct detection of the objects i.e. no information regarding the underlying
network was supplied. Positional errors of remotely sensed manhole covers and grates could lead to errors on rim elevation, which in turn impacts the pipe length and slope. Detection errors such as i) objects masked in the aerial photograph by trees or shade, ii) spots wrongly assumed to be manhole covers or grates, or even iii) visible but out of service elements, may strongly impact the shape of the network. The pipe characteristics (material, diameter and roughness) may also affect the output hydrographs. Consequently, it is important to assess the sensitivity of the hydraulic model’s results to the network descriptors in order to determine the most relevant parameters, and the precision required when determining their values.
The paper is structured as follows. Section II describes the materials and methods including study site, the tools and methodologies used for the sensitivity analysis and the textual analysis. Section IIIand section IVpresent the main results of our study and the new perspectives that this preliminary analysis opens.
II MATERIALS AND METHODS 2.1 Study site and data
The study site is located in the "Hôpitaux Facultés" district of the city of Montpellier (Southern France), where heavy rains often cause over flooding of stormwater drains. It is an extension of the University of Montpellier’s main campus which has already been used to test the manhole cover detection techniques proposed in a previous study (Pasquet et al.,2016).
The database consists of digital orthophotos at 16 cm resolution available through the city’s open data platform; digital data on the wastewater network extracted from the GIS of Montpel-lier Métropole, the inter-municipality agency of the metropolitan area of MontpelMontpel-lier and data on the stormwater network supplied in digital format by the Municipality of Montpellier. A quick display of the three data layers showed that the manhole covers and grates located on the university campus were not reported in the city’s GIS systems. A special request was made to the university’s assets’ management department which provided PDF files of the network maps that were georeferenced in QGis. Manhole covers and grated were digitised as point data, the water pipes as lines and all the descriptive data written in the PDF were entered manually in the attribute table.
2.2 Methodology
2.2.1 Hydraulic modelling and sensitivity analysis
The network built in the previous step was imported into the PCSWMM (Computational Hy-draulics International) software for stormwater modelling. PCSWMM is built on the US EPA’s SWMM5 engine and uses the Saint-Venant (1871) equations to model water flow.
The upstream catchment characteristics are determined based on the Municipality’s dataset. The catchment is divided into three sub-catchments. Two synthetic storms are generated to run the model: a 2-hour duration Chicago design storm (Keifer and Chu,1957) is used as a reference rainfall event and a Desbordes (Desbordes, 1974) double-triangle design storm with a 5 year return period is used to account for more intense events. No model calibration is undertaken. In order to determine the most important information to be searched for by data mining, sensitivity analyses are undertaken for the following elements:
1. Slope. In the framework of this project, rim elevation may be easily determined via remote sensing data (DEMs, airborne Lidar, etc). However, this does not mean that the inlet elevation will be known. If no further information is provided, pipe slopes should
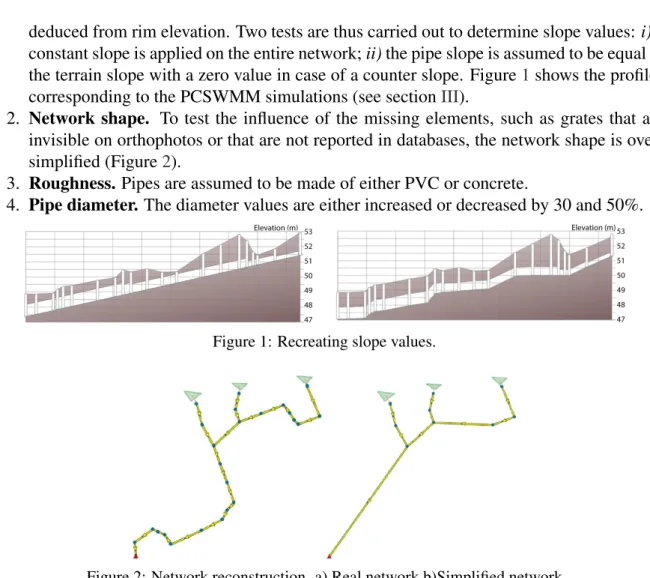
deduced from rim elevation. Two tests are thus carried out to determine slope values: i) a constant slope is applied on the entire network; ii) the pipe slope is assumed to be equal to the terrain slope with a zero value in case of a counter slope. Figure1shows the profiles corresponding to the PCSWMM simulations (see sectionIII).
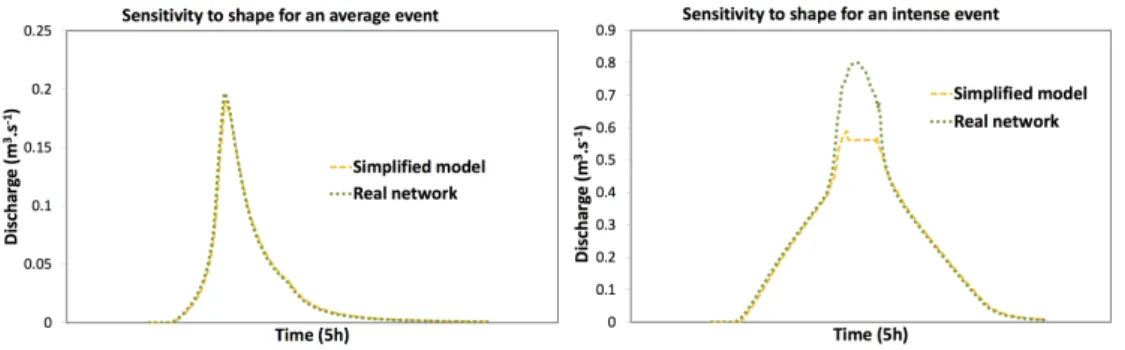
2. Network shape. To test the influence of the missing elements, such as grates that are invisible on orthophotos or that are not reported in databases, the network shape is over-simplified (Figure2).
3. Roughness. Pipes are assumed to be made of either PVC or concrete.
4. Pipe diameter. The diameter values are either increased or decreased by 30 and 50%.
Figure 1: Recreating slope values.
Figure 2: Network reconstruction. a) Real network b)Simplified network
2.2.2 Textual Analytics
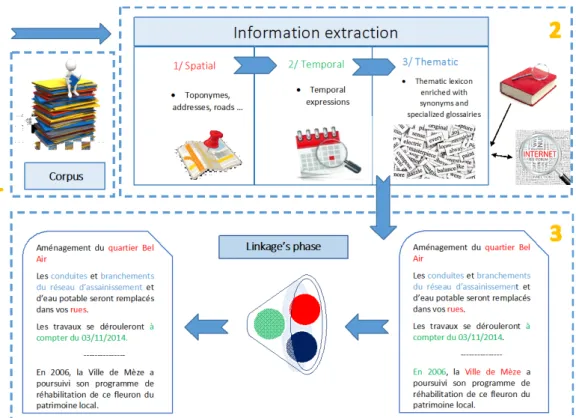
Our process explore textual resources scrapped from the web to confirm or infirm information obtained from hydrologic modelling and sensitivity analysis. Our process is divided into 3 steps as shown in Figure 3. The first step is to gather a set of relevant documents. Once this corpus is built, textual documents are analyzed in two phases. The second phase aims to identify thematic, spatial and temporal features. The third step is dedicated to the linkage of these features. For the first step, we manually gathered 30 documents identified as relevant. This set of docu-ments is composed of one local planning map, one intervention report, three annual reports of public service concession holders, three technical notes, two prevention plans against natural floods, one scientific paper, one news article, two commercial brochures, four sewerage master plans, two municipal newsletters, one public inquiry file, one file of administrative acts, three study reports, a list of service delivery’s contracts concluded, one convention document, three technical specifications. Six documents were identified as irrelevant.
For the second step, we used two different methods so as to identify three types of expressions: thematic, temporal and spatial, in our set of documents.
Our chain of treatments which aims to recognize spatial and thematic information is based on Unitex1, which is a free collection of programs dedicated to corpus processing based on
linguis-1Unitex has been developed at LADL (Laboratoire d’Automatique Documentaire et Linguistique) http://www-igm.univ-mlv.fr/ unitex/
tic resources. Resources used by the software consist of: i) Dictionaries: description of simple and compound words with their lemmas and a set of grammatical and semantic codes; ii) Gram-mars: representations, as graphs, of linguistic phenomena on the basis of finite state automata; iii)Lexicon-grammar tables: matrices describing syntactical properties of some words in which rows correspond to verbs and columns to syntactical properties. We applied the transducers’s cascade "CasEN_Quaero" which has been created in order to recognize named entities (Maurel et al.,2011). A transducer is a set of boxes which contains symbols (e.g. characters’ sequences, a syntactical code) that we aim to recognize. Each graph in a cascade is applied, one after the other, to the corpus which has been modified by the previous graph (Friburger,2002).
The recognition of temporal features was carried out using Heideltime2. Heideltime is a rule-based tagger that retrieves temporal informations (absolute and relative dates, durations) from texts. Expressions identified are normalized according to the TIMEX3 annotation standard3
which describe temporal expressions, dates...).
Finally, the second phase of the process is then implemented as follows (Fig.3):
• Thematic identification: we established a list of words related to the field of interest, composed of 77 words which describe objects such as manhole covers and stormwater or wastewater networks, and 62 terms that depict their characteristics (e.g. diameter, depth, flow) and measurement units (e.g. m 3/s , Eq-hab, m). We completed this list with terms extracted from two lexicons (UNESCO, 1992;Andréassian et al., 2002) and one reference work (Bourrier,2008). This lexicon covers 1% of our corpus (percentage of annotated documents in the corpus). The automatic extraction of synonyms from 7 websites4 provided a list of 1721 terms which had been projected on texts retrieved in step 1. Finally, 683 appeared in the corpus, thus expanding the initial list to 344%. The lexicon extended this way covers 4% of our set of documents.
• Spatial identification: we used resources embedded in the CasEN_Quaero cascade of the Unitex software in order to recognize spatial information (e.g. "au nord de la route R12 allant de Montpellier à Lunel", "le boulevard du Languedoc").
• Temporal identification: we chose to use Heideltime so as to detect time expressions (e.g. "l’appel d’offre signé du 12 mai", "du 03/06/14 au 21/07/14").
The chain of treatments was evaluated by one annotator on a sample of 3 documents which contains 21 904 tokens. Thus, 285 spatial features, 213 temporal expressions and 346 thematic features were identified.
The third phase, corresponding to the linkage operation, will link the spatial and temporal fea-tures obtained in the previous phase with the thematic marking (Fig. 3). Depending on their degree of proximity (in the document, in the section, in the paragraph or in the sentence), spa-tial and temporal markings will be retained or not.
III RESULTS
When no information is available on the inlet elevations or pipe slopes their values should be deduced from rim elevation data. The results obtained with the two approaches for this estimation are presented in Fig.4, for the moderate and intense rainfall event. It can be seen that when assuming similar ground and underground slopes, the model underestimates both flood
2http://dbs.ifi.uni-heidelberg.de/index.php?id=129
3http://www.timeml.org/tempeval2/tempeval2-trial/guidelines/timex3guidelines-072009.pdf
4 http://www.cnrtl.fr, http://www.synonymo.fr, http://www.crisco.unicaen.fr, http://www.babla.fr, http://dico.isc.cnrs.fr, http://dictionary.reverso.net, http://dictionary.sensagent.com
Figure 3: Global process of textual analysis.
volume and peakflow. Indeed, imposing a null gradient for counter slopes yields overflows and thus diminishes the routed volume. For these events using a mean, constant slope does not induce great differences on the simulated hydrographs: changing the slope by up to 43% yields comparable results. The two values tested in this case correspond to either the mean slopes given by the real database or to the difference between upstream and downstream rim elevations.
The results are further confirmed for the high intensity rainfall event. However, slight differ-ences can be seen based on the selected slope value; one yields a better estimation of the flood volume while the other one’s results are closer to the flood dynamics. This raises questions about the slope value that should be used for network reconstruction. Although French techni-cal guides recommend using a 0.01 m/m slope when designing stormflow networks, it seems that common practice, especially when extending existing networks, is to set the slope accord-ing to the input and output gradients. For a given pipe burial depth, this would imply dividaccord-ing the network into distinct sections to avoid counter slopes or unrealistic elevation values.
Figure 4: Sensitivity to slope for an average event and an intense event. The slope 0.015 correspond to the mean of all the real slope values, and 0.0085 is directly the slope between upstream and outlet.
Regarding the network’s shape (Fig. 5) no real influence can be seen when modelling moder-ate intensity rainfall events. However, for heavier rainfall events, missing out inlet grmoder-ates and consequent branching yields faster transfer times and upstream overflowing (Fig.2).
Figure 5: Sensitivity to missing inlet grates
For moderate rainfall, the roughness of the pipe material does not impact the output hydrograph. In case of high intensity events, high roughness may reduce flow velocity and yield greater over-flooding. However, roughness is often a calibrated parameter as its value cannot be easily determined by direct measurement. Consequently, lack of information on roughness can easily be overcome.
Finally, pipe diameter has nearly no influence on the output discharge as long as there is no transition from open-channel to closed-conduit flow. A significant reduction in pipe diameter will lead to over flooding.
Table 1 gives a ranking of the tested parameters in terms of impact on simulated flow hy-drographs. Elevation and slope are the parameters which need to be estimated with the best accuracy. The aim of the textual analysis would be to identify any mention of these parameters and corresponding values in big data.
Rank Parameter Justification
1 Pipe slope Faster transfer times if too steep 2 Pipe diameter May cause overflowing if too small 3 Pipe roughness Should be calibrated.
Table 1: Parameter ranking based on the sensitivity analysis
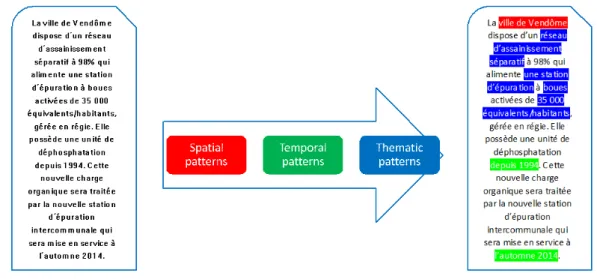
The first phase applied on the corpus allows the extraction of spatial, temporal and thematic features as illustrated in Figure 6. It can be seen that the program can accurately identify the name of the town ("ville de Vendome"), the timeframe of the document ("depuis 1994"; "l’automne 2014"). By using the thematic pattern, the type of wastewater network ("réseau séparatif"-separate wastewater network) and the capacity of the wastewater treatment plant ("35000 équivalents/habitants") are also identified. However, the text also indicates that 98% of the wastewater network is routed through a separate network but the information is not picked up by the program. To overcome this, a new pattern could be added but the selection rules cannot be extended endlessly. A rate of "acceptable loss" should be set with the specialists. The quantitative results of the feature extraction are summarised in Table2.
Regarding the results of the sensitivity analysis we carried out, with the exception of the rim elevation, the parameters correspond to terms which are too generic, with a wide variety of uses. "Pipe diameter" ("diamètre de conduite") for instance, was mentioned in reference to karstic
Spatial features Temporal features Thematic features False positive 35 21 14 Missing 124 22 34 Correct 285 213 346 Recall 0.70 0.91 0.91 Precision 0.89 0.91 0.96 F-Measure 0.78 0.91 0.94
Table 2: Quantitative Evaluation of the feature extraction.
aquifers, water supply and flooded caves. "Pipe diameter" pointed also to supply catalogs. The term "slope" was the one that needed most disambiguation. "The general slope of the terrain", "Average catchment slope" and "sloping" ("en pente" in French) are very frequently used. Pipe slope values which are not positioned closely to the words "pipe" and "slope" are often missed. As a general rule, quantified information related to the network’s slope can not be easily detected because often there are many intermediate words between them and many expressions are used when reporting this values. This also applies to "Rim elevation". In order to obtain quantitative information about these parameters, it is necessary to overcome this problem. It would be necessary to investigate other annotation techniques such as the one described in (Berrahou et al.,2013).
Figure 6: Example of an annotated text
IV CONCLUSION AND PERSPECTIVES
A methodological framework was put forward to use big data in order to improve the accuracy of stormwater modelling networks. A sensitivity analysis was carried out to determine the most sensitive parameters and text mining techniques were used to extract information about them in big data scrapped from the web. The primary results are encouraging as spatial, temporal and thematic patterns are correctly identified. However, quantitative information about the net-work’s elements such as elevation and slope can be missed sometimes. Future work will look into overcoming this problem by either setting new patterns or creating an index which will give the expert an indication on the presence of possibly interesting numerical data in a document. The final step will consist in building a model based solely on the information gathered through the big data. The uncertainty associated with each characteristic will be assessed and hydraulic simulations using a classical modelling software will be carried out to assess the uncertainty
transmission in each step of the process until the simulation of the output hydrograph. Other types of documents could also be considered such as photos or scanned plans with captions. Automatic scrapping from the web based on research engines such as Google or Yahoo and contextual analysis of snippets will also be explored (Opitz et al.(2014)).
Acknowledgment
This study is part of the project "Cart’Eaux" funded by the European Regional Development Fund (ERDF).
References
Andréassian V., Sarkissian V., Chelmiki W., Stanescu V., Moussa R. (2002). Cemagref.
Berrahou S. L., Buche P., Dibie-Barthélemy J., Roche M. (2013). How to extract unit of measure in scientific documents? In K. Liu, A. L. N. Fred, and J. Filipe (Eds.), KDIR/KMIS 2013 - Proceedings of the Interna-tional Conference on Knowledge Discovery and Information Retrieval and the InternaInterna-tional Conference on Knowledge Management and Information Sharing, Vilamoura, Algarve, Portugal, 19 - 22 September, 2013, pp. 249–256. SciTePress.
Bourrier R. (2008). Les réseaux d’assainissement Calculs - Applications - Perspectives. Paris: Editions Tec et Doc/ Lavoisier.
Chen H., Cohn A. (2011). Buried utility pipeline mapping based on multiple spatial data sources: A bayesian data fusion approach. In IJCAI-11, Barcelona, Spain, pp. 2411–2417.
Desbordes M. (1974). Réflexions sur les méhodes de calcul des réseaux urbains d’assainissement pluvial. Mont-pellier: PhD Thesis USTL.
Friburger N. (2002). Reconnaissance automatique des noms propres : application à la classification automatique des textes journalistiques. Tours: PhD Thesis University of Tours.
Jamil H., Z. N., Mohid Yussof M. (2012). Underground utility mapping and its challenges in malaysia. In FIG working week 2012. Knowing to manage the territory, protect the environment, evaluate the cultural heritage, Rome, Italy, pp. 15.
Keifer J., Chu H. (1957). Synthetic storm patterns for drainage design. Journal of Hydraulic’s division (83), 1–25. Kergosien E., Alatrista-Salas H., Gaio M., Güttler F., Roche M., Teisseire M. (2015). When textual information
becomes spatial information compatible with satellite images. In KDIR, pp. 301–306.
Maurel D., Friburger N., Antoine J., Eshkol-Taravella I., Nouvel D. (2011). Cascades autour de la reconnaissance des entités nommées. TAL (52), 69–96.
Metje N., Atkins P., Brennan M., Champan D., Lim H., Machell J., Muggleton J., Pennock S., Ratcliffe J., Redfern M., Rogers C., Saul A., Shan Q., Swingler S., Thomas A. (2007). Mapping the underworld: State of the art review. Tunnelling and underground space technology (22), 568–586.
Opitz T., Azé J., Bringay S., Joutard C., Lavergne C., Mollevi C. (2014). Breast cancer and quality of life: Medical information extraction from health forums. In C. Lovis, B. Séroussi, A. Hasman, L. Pape-Haugaard, O. Saka, and S. K. Andersen (Eds.), e-Health - For Continuity of Care - Proceedings of MIE2014, the 25th European Medical Informatics Conference, Istanbul, Turkey, August 31 - September 3, 2014, Volume 205 of Studies in Health Technology and Informatics, pp. 1070–1074. IOS Press.
Pasquet J., Desert T., Bartoli O., Chaumont M., Delenne C., Subsol G., Derras M., Chahinian N. (2016). Detection of manhole covers in high-resolution aerial images of urban areas by combining two methods. IEEE Journal of Selected Topics in Applied Earth Observations and Remote Sensing 9(5), 1802–1807.
Rogers C., Hao T., Costello S., Burrow M., Metje N., Chapman D., ..., Saul A. (2012). Condition assessment of the buried utility service infrastructure: a proposal for integration. Tunnelling and Underground Space Technology 28, 202–211.