Budgeting sinks and sources of CO
2in the coastal ocean: Diversity of
ecosystems counts
A. V. Borges, B. Delille, and M. Frankignoulle1
Chemical Oceanography Unit, Interfacultary Center for Marine Research, University of Lie`ge, Lie`ge, Belgium Received 24 March 2005; revised 17 May 2005; accepted 8 June 2005; published 16 July 2005.
[1] Air-water CO2 fluxes were up-scaled to take into
account the latitudinal and ecosystem diversity of the coastal ocean, based on an exhaustive literature survey. Marginal seas at high and temperate latitudes act as sinks of CO2 from the atmosphere, in contrast to subtropical and
tropical marginal seas that act as sources of CO2 to the
atmosphere. Overall, marginal seas act as a strong sink of CO2of about 0.45 Pg C yr 1. This sink could be almost
fully compensated by the emission of CO2 from the
ensemble of near-shore coastal ecosystems of about 0.40 Pg C yr 1. Although this value is subject to large uncertainty, it stresses the importance of the diversity of ecosystems, in particular near-shore systems, when integrating CO2fluxes at global scale in the coastal ocean. Citation: Borges, A. V., B. Delille, and M. Frankignoulle (2005), Budgeting sinks and sources of CO2in the coastal ocean: Diversity of ecosystems counts, Geophys. Res. Lett., 32, L14601, doi:10.1029/ 2005GL023053.
1. Introduction
[2] The coastal ocean has been to a large extent
ignored in global carbon budgets, even if the related flows of carbon and nutrients are disproportionately high in comparison with its surface area. It receives massive inputs of organic matter and nutrients from land, exchanges large amounts of matter and energy with the open ocean across continental slopes and constitutes one of the most biogeochemically active areas of the biosphere. Hence, intense air-water CO2exchanges can be expected in
the coastal ocean that could lead to a major re-evaluation of CO2 flux budgets at regional [Frankignoulle and
Borges, 2001] or global scales [Tsunogai et al., 1999; Thomas et al., 2004a]. However, the direction, magnitude and latitudinal variability of air-sea CO2 fluxes in
mar-ginal seas has been recently debated [Cai and Dai, 2004; Thomas et al., 2004b] although it has been overlooked that the coastal ocean is an ensemble of multiple diverse ecosystems and is not solely composed of marginal seas. A climatological approach is not possible at present time to evaluate sinks and sources of CO2in the coastal ocean,
due to the strong temporal and spatial heterogeneity of coastal environments and relative paucity of data. We adopted in the present paper an up-scaling approach (i.e. reasonable flux value for a given ecosystem multi-plied by its respective surface area) to attempt to assess
the relative importance and potential impact of near-shore systems on the overall budget of CO2 in the coastal
ocean.
2. Results and Discussion
[3] An exhaustive literature survey of air-water CO2
fluxes was conducted (Table A11) and data in 44 coastal environments were gathered in 6 major ecosystems (mar-ginal seas, upwelling systems, estuaries, mangrove and salt-marsh waters, and coral reefs). We updated the recent compilation by Borges [2005] by: 1 - adding data that was overlooked or recently published (Ross Sea, South China Sea, Southwest Brazilian coast, Vancouver Island coast); 2 - homogenizing for upwelling systems and mar-ginal seas the fluxes computed using different gas transfer velocity parameterizations; 3 - accounting for the relative occurrence of El Nin˜o/La Nin˜a events for upwelling sys-tems; 4 - computing the fluxes using daily wind speeds rather than using a constant gas transfer velocity, for sites where fluxes were not given in the original publications; 5 -using the most recent estimates of the surface areas of coastal ecosystems (in particular mangroves and coral reefs).
[4] Marginal seas at high (Barents Sea, Bristol Bay,
Pryzd Bay, and Ross Sea) and temperate (Baltic Sea, North Sea, Gulf of Biscay, US Middle Atlantic Bight, and East China Sea) latitudes are net annual sinks of atmospheric CO2but at sub-tropical and tropical latitudes they are net
annual sources of CO2 to the atmosphere (US South
Atlantic Bight, South China Sea, and Southwest Brazilian coast) (Table A1). This contrasted behavior is partly related to the fact that the open oceanic waters that circulate over continental shelves tend to be on annual scale under-saturated in CO2at high and temperate latitudes and
over-saturated in CO2 at subtropical and tropical latitudes
(Table 1). Biogeochemical processes over continental shelves further amplify or dampen this background signal imposed by the open oceanic waters. At high latitudes, important CO2 absorption from the atmosphere occurs
during the ice free periods when primary production is high, and sea ice extensively present during most of the year is assumed to block CO2 exchanges with the atmosphere
[e.g., Gibson and Trull, 1999]. At temperate and subtropical latitudes the most comprehensive studies of carbon flows including air-water CO2 fluxes are, respectively, in the
North Sea (NS [Thomas et al., 2005]) and the US South Atlantic Bight (SAB [Cai et al., 2003]). The comparison of
1Deceased 13 March 2005.
Copyright 2005 by the American Geophysical Union. 0094-8276/05/2005GL023053$05.00
1
Auxiliary material is available at ftp://ftp.agu.org/apend/gl/ 2005GL023053.
these two marginal seas by Borges [2005] shows that the NS receives less dissolved inorganic (DIC) and organic carbon (DOC) of terrestrial origin and exports more efficiently DIC to the adjacent Atlantic Ocean than the SAB. This is due to the seasonal stratification in the NS that allows a decoupling of primary production in the mixed layer and the degrada-tion below the pycnocline of sedimented organic matter, enriching in DIC the bottom waters that are advected out of the system (the so called ‘‘continental shelf pump’’). In the permanently well mixed waters of the SAB, the decoupling of organic carbon production and degradation occurs in time but does not occur across the water column, thus, the CO2
produced by organic carbon degradation can be readily exchanged with the atmosphere. It remains to be established if the modes of carbon cycling in the NS and the SAB are representative of the majority of marginal seas at, respec-tively, temperate and subtropical/tropical latitudes.
[5] Near-shore ecosystems (estuaries, saltmarsh waters,
mangrove waters, coral reefs, and coastal upwelling
sys-tems) are net annual sources of CO2(Table A1). The most
intense fluxes are located at the land-aquatic interface (estuaries, saltmarsh waters, and mangrove waters) due to inputs of terrestrial organic carbon that fuel the net hetero-trophy of the aquatic compartment (refer to Frankignoulle et al. [1998], Wang and Cai [2004], and Borges et al. [2003], respectively). Coral reefs act as sources of CO2due intense
calcification and a low net organic carbon production [e.g., Gattuso et al., 1998]. Coastal upwelling systems character-ized by high upwelling index (UI) values (Oman and California coasts) tend to be sources of CO2in contrast to
those with low UI values (Galician coast, Vancouver Island) (Table A1). This could be related to the fact that the residence time of the water mass is so short and the inputs of nutrients and DIC so intense that exhaustion of nutrients and under-saturation of CO2 do not occur over the
conti-nental shelf in high UI systems, although probably occur-ring in upwelling filaments [Borges, 2005].
[6] Table 1 shows the up-scaled CO2fluxes in the coastal
ocean by latitudinal bands of 30°, taking into account its geographical and ecosystem diversity. Systems close to a latitudinal band border were also classified according to general climatic features (for instance Bristol Bay is included in the 60° – 90° band due to extensive yearly presence of sea-ice). An overall integration of CO2fluxes (global ocean
in Table 1) was carried out using the recent climatology for open oceanic waters from Takahashi et al. [2002] (open ocean in Table 1). The coastal ocean would act as a net CO2
sink at high and temperate latitudes and as a net CO2source
at tropical latitudes. The inclusion of coastal air-water CO2
fluxes would strongly increase the overall CO2sink at high
latitudes ( 0.22 versus 0.33 Pg C yr 1, 50%) and temperate latitudes ( 2.06 versus 2.19 Pg C yr 1, 6%), but would significantly increase the overall CO2 source
at subtropical and tropical latitudes (+0.71 versus +0.90 Pg C yr 1, 27%). Marginal seas act as a significant CO2sink ( 1.62 mol C m 2 yr 1; 0.45 Pg C yr 1) in
agreement with previous estimates based on the extrapola-tion to worldwide continental shelves of data from the East China Sea [Tsunogai et al., 1999] or the North Sea [Thomas et al., 2004a]. This agreement is due to the fact that although tropical and subtropical marginal seas are CO2
sources (Tables A1 and 1) they only represent 5.6% of the total surface area of the coastal ocean compared to 55.7% and 27.2% for, respectively, temperate and high latitude marginal seas (Table 1). However, the global sink of CO2in
marginal seas could be almost fully compensated by the emission of CO2(+11.09 mol C m 2yr 1; +0.40 Pg C yr 1)
from the ensemble of near-shore coastal ecosystems, mostly related to the emission of CO2 from estuaries
(0.34 Pg C yr 1). On the whole, the coastal ocean would act as a small CO2 sink ( 0.05 Pg C yr 1) and would
lead to a modest increase of the CO2sink from the global
ocean ( 1.57 versus 1.62 Pg C yr 1, 3%).
[7] Although it cannot be denied that the estuaries studied
so far are sources of CO2(Table A1), our global up-scaled
CO2 emission estimate can be biased for at least two
reasons. Eleven of the 16 estuaries in Table A1 are located in Europe among which most are highly impacted by human activities. But the largest bias in the up-scaling is probably related to the surface area estimate from Woodwell et al. [1973] and its portioning into latitudinal bands. Here, we
Table 1. Tentative Budget of Air-Water CO2 Fluxes in the
Coastal, Open and Global Oceans Surface (106km2) Air-Water CO2Flux mol C m 2yr 1 Pg C yr 1 60° – 90° (high latitude) Open 30.77 0.61f 0.22 Marginal seas 7.08a 1.94g
}
1.21 0.10 Estuaries 0.11b 46.00h Sub-total 37.96 0.72 0.33 30° – 60° (temperate) Open 122.44 1.40f 2.06 Marginal seas 14.49a 1.84i}
0.73 0.13 Coastal upwelling 0.24a 0.11j Estuaries 0.27b 46.00h Marsh waters 0.14c 21.40k Sub-total 137.58 1.33 2.190° – 30° (subtropical and tropical)
Open 182.77 0.32f 0.71 Marginal seas 1.46a 1.84l
}
4.19 0.18 Coastal upwelling 1.25a 0.11j Coral reefs 0.28d 1.51m Mangrove waters 0.15e 18.66n Estuaries 0.56b 16.83o Sub-total 186.44 0.40 0.90 Total Open ocean 336.0 0.39 1.57 Coastal ocean 26.0a 0.15 0.05 Global ocean 362.0 0.37 1.61 aFrom Walsh [1988]. bBased on the global surface area estimate of 0.9433 106 km2 from Woodwell et al. [1973] partitioned into latitudinal bands assuming a linear dependence with freshwater discharge.
c
Assuming that non-estuarine marshes correspond to half of the global surface area estimate of 0.2787 106km2given by Woodwell et al. [1973].
d
Spalding et al. [2001].
eFood and Agriculture Organization of the United Nations [2003]. f
Takahashi et al. [2002] and http://www.ldeo.columbia.edu/res/pi/CO2/.
gAverage of data for Barents Sea, Bristol Bay, Pryzd Bay and Ross Sea. h
Surface area weighted average of data for estuaries located north of 31°N.
i
Surface area weighted average of data for marginal seas located between 32°N and 57°N.
j
Surface area weighted average of data for coastal upwelling systems.
k
Data from Duplin River.
lAverage of data for US South Atlantic Bight, South China Sea and
Southwest Brazilian coast.
mAverage of data for coral reefs. n
Average of data for mangrove waters.
oAverage of data for estuaries located south of 32°N.
L14601 BORGES ET AL.: COASTAL CO2SINKS AND SOURCES L14601
partitioned by latitude assuming a linear dependence of the surface area with freshwater discharge while Borges [2005] assumed a linear dependence with coastline length and obtained a slightly higher global CO2 emission
(0.43 Pg C yr 1). Also, Woodwell et al. [1973] state that their estimate is prone to an uncertainty of at least ±50%. Using the lower bound global surface area estimate of estuaries (0.47 106km2) would bring the global CO2emission
to 0.16 Pg C yr 1from estuaries and to 0.24 Pg C yr 1from the ensemble of near-shore coastal ecosystems. Note also that the surface area of Woodwell et al. [1973] relates to inland (or inner) estuaries (from the mouth to the uppermost limit of the tide) and does not cover the areas of salinity mixing at sea (outer estuaries or river plumes).
[8] The isotope signature of organic matter in sediments
suggests that less than 10% of particulate organic carbon (POC) of terrestrial origin is preserved over continental shelf sediments [e.g., Hedges et al., 1997]. This implies that the degradation of most of terrestrial POC could occur in estuaries in accordance with the strong net heterotrophic nature of these ecosystems [e.g., Gattuso et al., 1998; Hopkinson and Smith, 2005]. The degradation within estu-aries of riverborne POC has been estimated to range between 50 and 70% (Abril et al. [2002] and Keil et al. [1997], respectively). Assuming that the produced CO2 is
ventilated back to the atmosphere within estuaries, these systems would emit between 0.25 and 0.35 Pg C yr 1based on the provocative riverborne POC input of 0.50 Pg C yr 1 proposed by Richey [2004]. Isotopic signatures also show that most of the terrestrial DOC is removed before reaching the deep ocean [e.g., Hedges et al., 1997]. Isotopic signa-tures of DOC within estuaries further suggest that it is partly removed during estuarine mixing and that the canonical conservative behavior of DOC in these systems is related to the balance of removal and production terms [e.g., Peterson et al., 1994]. However, the fraction of DOC that is removed by degradation (contributing to the emission of CO2from
estuaries) compared to flocculation and adsorption remains to be established [e.g., Hedges et al., 1997]. Nevertheless, the degradation of riverborne organic carbon could in theory sustain in estuarine environments a CO2emission of about
0.3 – 0.4 Pg C yr 1 in accordance with the estimate we derived from up-scaled air-water CO2 fluxes in estuaries.
Furthermore, there is increasing evidence that a significant fraction of the CO2emission from estuaries is sustained by
lateral inputs of organic carbon and DIC although not estimated at global scale.
3. Concluding Remarks
[9] The present up-scaling of air-water CO2fluxes shows
the contrasted behavior of the proximal coastal ocean (ensemble of near-shore ecosystems) strongly influenced by terrestrial inputs and the distal coastal ocean (marginal seas) that exports carbon to the adjacent deep ocean as DIC [Tsunogai et al., 1999; Cai et al., 2003; Thomas et al., 2004a] and as organic carbon [e.g., Wollast, 1998]. This up-scaling also clearly illustrates the importance of the diver-sity of ecosystems and latitudinal variability in the overall role of the coastal ocean as a sink or a source of CO2. This
has significant consequences on our understanding of global cycles of carbon and CO2. For instance, 80% of the surface
area of the coastal ocean is located in the Northern Hemi-sphere, with possible consequences for global atmospheric CO2 inversion models and inter-hemisphere carbon
trans-port estimates.
[10] Several caveats remain in the present up-scaling
that should be the focus of future research: 1 - a more complete description of the latitudinal and temporal variability of air-water CO2 fluxes in marginal seas and
near-shore ecosystems; 2 - the uncertainty of surface area estimates of near-shore systems, in particular estuaries and the aquatic compartment associated to intertidal habitats (mangroves and marshes); 3 - the neglect of river plume data characterized by large fluxes and surface areas [Borges and Frankignoulle, 2002; Ko¨rtzinger, 2003], although under-sampled and for which no global surface area estimate is available; 4 - the lack of data in high-latitude estuaries and river plumes; 5 - the assumption of a zero atmosphere-ice CO2 flux at high latitudes that is
inconsistent with recent data in the Artic [Semiletov et al., 2004] and in Antarctica [Delille et al., 2004]; 6 - the lack of data in certain coastal ecosystems such as highly productive seagrass and macrophyte dominated communi-ties, systems mainly influenced by ground water inputs, and tidal and non-tidal lagoons.
[11] Acknowledgments. This is a contribution to the EU IP CARBOOCEAN (511176-2), BELCANTO (EV/12/7E) and CANOPY (EV/03/20) BSP projects, and MARE publication N°067. Comments from two anonymous reviewers improved the previous version of the paper.
References
Abril, G., E. Nogueira, H. Hetcheber, G. Cabec¸adas, E. Lemaire, and M. J. Brogueira (2002), Behaviour of organic carbon in nine contrasting Eur-opean estuaries, Estuarine Coastal Shelf Sci., 54, 241 – 262.
Borges, A. V. (2005), Do we have enough pieces of the jigsaw to integrate CO2fluxes in the coastal ocean?, Estuaries, 28, 3 – 27.
Borges, A. V., and M. Frankignoulle (2002), Distribution and air-water exchange of carbon dioxide in the Scheldt plume off the Belgian coast, Biogeochemistry, 59, 41 – 67.
Borges, A. V., S. Djenidi, G. Lacroix, J. The´ate, B. Delille, and M. Frankignoulle (2003), Atmospheric CO2flux from mangrove
sur-rounding waters, Geophys. Res. Lett., 30(11), 1558, doi:10.1029/ 2003GL017143.
Cai, W. J., and M. Dai (2004), Comment on ‘‘Enhanced open ocean storage of CO2from shelf sea pumping,’’ Science, 306, 1477.
Cai, W., Z. A. Wang, and Y. Wang (2003), The role of marsh-dominated heterotropic continental margins in transport of CO2between the
atmo-sphere, the land-sea interface and the ocean, Geophys. Res. Lett., 30(16), 1849, doi:10.1029/2003GL017633.
Delille, B., et al. (2004), Carbon dioxide dynamics in Antarctic pack ice and transfer at the ice-sea and air-ice interface, paper presented at SOLAS Open Science Conference, Surface Ocean Lower Atmos. Study, Halifax, Nova Scotia, Canada, 13 – 16 Oct.
Food and Agriculture Organization of the United Nations (2003), State of the World’s Forests (SOFO), report, 100 pp., Rome.
Frankignoulle, M., and A. V. Borges (2001), European continental shelf as a significant sink for atmospheric carbon dioxide, Global Biogeochem. Cycles, 15, 569 – 576.
Frankignoulle, M., G. Abril, A. Borges, I. Bourge, C. Canon, B. Delille, E. Libert, and J.-M. The´ate (1998), Carbon dioxide emission from European estuaries, Science, 282, 434 – 436.
Gattuso, J.-P., M. Frankignoulle, and R. Wollast (1998), Carbon and carbo-nate metabolism in coastal aquatic ecosystems, Annu. Rev. Ecol. Syst., 29, 405 – 433.
Gibson, J. A. E., and T. W. Trull (1999), Annual cycle of fCO2under
sea-ice and in open water in Prydz Bay, East Antarctica, Mar. Chem., 66, 187 – 200.
Hedges, J. I., R. G. Keil, and R. Benner (1997), What happens to terrestrial organic matter in the ocean?, Org. Geochem., 27, 195 – 212.
Hopkinson, C. S. J., and E. M. Smith (2005), Estuarine respiration: An overview of benthic, pelagic and whole system respiration, in Respiration
in Aquatic Ecosystems, edited by P. A. del Giorgio, and P. J. L. Williams, pp. 123 – 147, Oxford Univ. Press, New York.
Keil, R. G., L. M. Mayer, P. D. Quay, J. E. Richey, and J. I. Hedges (1997), Loss of organic matter from riverine particles in deltas, Geochim. Cosmochim. Acta, 61, 1507 – 1511.
Ko¨rtzinger, A. (2003), A significant CO2sink in the tropical Atlantic Ocean
associated with the Amazon River plume, Geophys. Res. Lett., 30(24), 2287, doi:10.1029/2003GL018841.
Peterson, B., B. Fry, M. Hullar, S. Saupe, and R. Wright (1994), The distribution and stable carbon isotopic composition of dissolved organic carbon in estuaries, Estuaries, 17, 111 – 121.
Richey, J. E. (2004), Pathways of atmospheric CO2through fluvial systems,
in The Global Carbon Cycle: Integrating Humans, Climate, and the Natural World, SCOPE Rep., vol. 62, edited by C. B. Field and M. R. Raupach, pp. 329 – 340, Island Press, Washington, D. C.
Semiletov, I., A. Makshtas, S. I. Akasofu, and E. L. Andreas (2004), Atmo-spheric CO2balance: The role of Arctic sea ice, Geophys. Res. Lett., 31,
L05121, doi:10.1029/2003GL017996.
Spalding, M. D., C. Ravilious, and E. P. Green (2001), World Atlas of Coral Reefs, 404 pp., Univ. of Calif. Press, Berkeley.
Takahashi, T., et al. (2002), Global sea-air CO2flux based on climatological
surface ocean pCO2, and seasonal biological and temperature effects,
Deep Sea Res., Part II, 49, 1601 – 1622.
Thomas, H., Y. Bozec, K. Elkalay, and H. J. W. De Baar (2004a), Enhanced open ocean storage of CO2from shelf sea pumping, Science, 304, 1005 –
1008.
Thomas, H., Y. Bozec, K. Elkalay, and H. J. W. De Baar (2004b), Response to comment on ‘‘Enhanced open ocean storage of CO2from shelf sea
pumping,’’ Science, 306, 1477.
Thomas, H., Y. Bozec, H. J. W. De Baar, K. Elkalay, M. Frankignoulle, L.-S. Schiettecatte, and A. V. Borges (2005), The carbon budget of the North Sea, Biogeosciences, 2, 87 – 96.
Tsunogai, S., S. Watanabe, and T. Sato (1999), Is there a ‘‘continental shelf pump’’ for the absorption of atmospheric CO2?, Tellus, Ser. B, 5, 701 – 712.
Walsh, J. J. (1988), On the Nature of Continental Shelves, 520 pp., Elsevier, New York.
Wang, Z. A., and W.-J. Cai (2004), Carbon dioxide degassing and inorganic carbon export from a marsh-dominated estuary (the Duplin River): A marsh CO2pump, Limnol. Oceanogr., 49, 341 – 354.
Wollast, R. (1998), Evaluation and comparison of the global carbon cycle in the coastal zone and in the open ocean, in The Global Coastal Ocean, edited by K. H. Brink and A. R. Robinson, pp. 213 – 252, John Wiley, Hoboken, N. J.
Woodwell, G. M., P. H. Rich, and C. A. S. Hall (1973), Carbon in estuaries, in Carbon and the Biosphere, edited by G. M. Woodwell and E. V. Pecan, pp. 221 – 240, Natl. Tech. Inf. Serv., Springfield, Va.
A. V. Borges and B. Delille, Chemical Oceanography Unit, MARE, University of Liege, Liege, Belgium. (alberto.borges@ulg.ac.be; bruno. delille@ulg.ac.be)
L14601 BORGES ET AL.: COASTAL CO2SINKS AND SOURCES L14601
Budgeting sinks and sources of CO2 in the coastal ocean: Diversity of ecosystems counts.
A. V. Borges, B. Delille, and M. Frankignoulle*
University of Liège, Chemical Oceanography Unit, MARE, Belgium, alberto.borges@ulg.ac.be, bruno.delille@ulg.ac.be, * deceased 13 March 2005
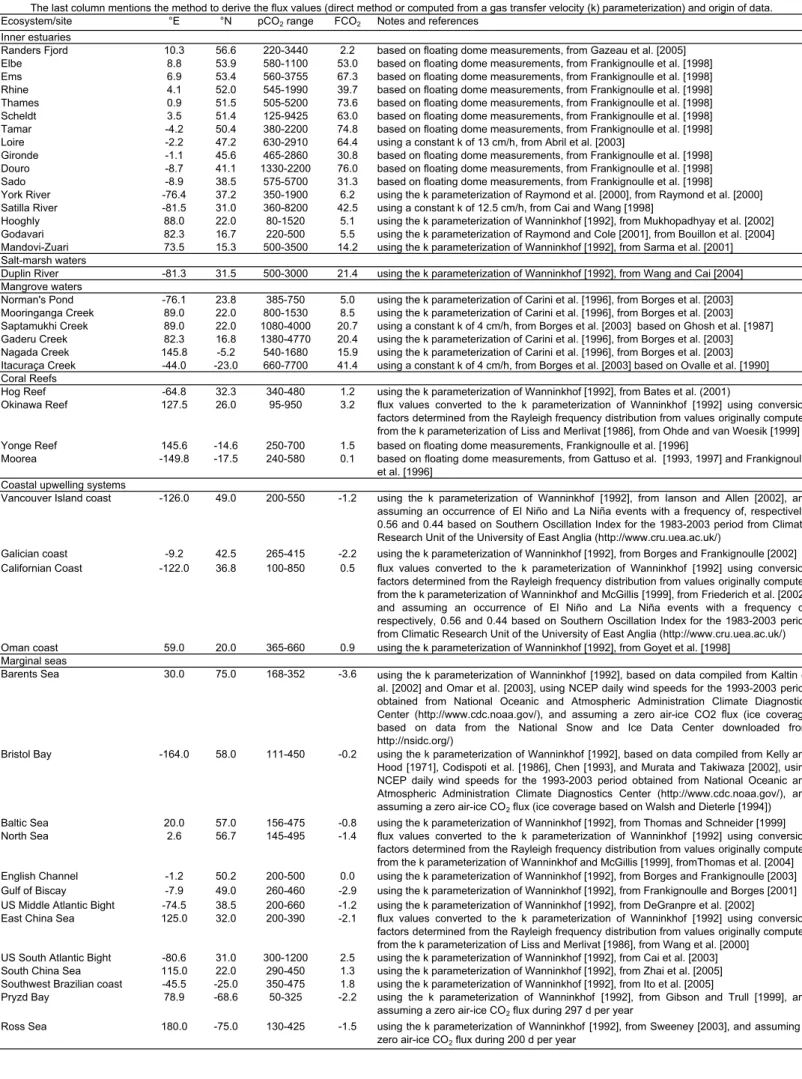
Table A1: Longitude (°E), Latitude (°N), range of partial pressure of CO2 (pCO2 in ppm) and air-water CO2 fluxes (FCO2 in mol m-2 y-1) in 44 coastal ecosystems.
The last column mentions the method to derive the flux values (direct method or computed from a gas transfer velocity (k) parameterization) and origin of data. Ecosystem/site °E °N pCO2 range FCO2 Notes and references
Inner estuaries
Randers Fjord 10.3 56.6 220-3440 2.2 based on floating dome measurements, from Gazeau et al. [2005] Elbe 8.8 53.9 580-1100 53.0 based on floating dome measurements, from Frankignoulle et al. [1998] Ems 6.9 53.4 560-3755 67.3 based on floating dome measurements, from Frankignoulle et al. [1998] Rhine 4.1 52.0 545-1990 39.7 based on floating dome measurements, from Frankignoulle et al. [1998] Thames 0.9 51.5 505-5200 73.6 based on floating dome measurements, from Frankignoulle et al. [1998] Scheldt 3.5 51.4 125-9425 63.0 based on floating dome measurements, from Frankignoulle et al. [1998] Tamar -4.2 50.4 380-2200 74.8 based on floating dome measurements, from Frankignoulle et al. [1998] Loire -2.2 47.2 630-2910 64.4 using a constant k of 13 cm/h, from Abril et al. [2003]
Gironde -1.1 45.6 465-2860 30.8 based on floating dome measurements, from Frankignoulle et al. [1998] Douro -8.7 41.1 1330-2200 76.0 based on floating dome measurements, from Frankignoulle et al. [1998] Sado -8.9 38.5 575-5700 31.3 based on floating dome measurements, from Frankignoulle et al. [1998] York River -76.4 37.2 350-1900 6.2 using the k parameterization of Raymond et al. [2000], from Raymond et al. [2000] Satilla River -81.5 31.0 360-8200 42.5 using a constant k of 12.5 cm/h, from Cai and Wang [1998]
Hooghly 88.0 22.0 80-1520 5.1 using the k parameterization of Wanninkhof [1992], from Mukhopadhyay et al. [2002] Godavari 82.3 16.7 220-500 5.5 using the k parameterization of Raymond and Cole [2001], from Bouillon et al. [2004] Mandovi-Zuari 73.5 15.3 500-3500 14.2 using the k parameterization of Wanninkhof [1992], from Sarma et al. [2001] Salt-marsh waters
Duplin River -81.3 31.5 500-3000 21.4 using the k parameterization of Wanninkhof [1992], from Wang and Cai [2004] Mangrove waters
Norman's Pond -76.1 23.8 385-750 5.0 using the k parameterization of Carini et al. [1996], from Borges et al. [2003] Mooringanga Creek 89.0 22.0 800-1530 8.5 using the k parameterization of Carini et al. [1996], from Borges et al. [2003] Saptamukhi Creek 89.0 22.0 1080-4000 20.7 using a constant k of 4 cm/h, from Borges et al. [2003] based on Ghosh et al. [1987] Gaderu Creek 82.3 16.8 1380-4770 20.4 using the k parameterization of Carini et al. [1996], from Borges et al. [2003] Nagada Creek 145.8 -5.2 540-1680 15.9 using the k parameterization of Carini et al. [1996], from Borges et al. [2003] Itacuraça Creek -44.0 -23.0 660-7700 41.4 using a constant k of 4 cm/h, from Borges et al. [2003] based on Ovalle et al. [1990] Coral Reefs
Hog Reef -64.8 32.3 340-480 1.2 using the k parameterization of Wanninkhof [1992], from Bates et al. (2001)
Okinawa Reef 127.5 26.0 95-950 3.2 flux values converted to the k parameterization of Wanninkhof [1992] using conversion factors determined from the Rayleigh frequency distribution from values originally computed from the k parameterization of Liss and Merlivat [1986], from Ohde and van Woesik [1999] Yonge Reef 145.6 -14.6 250-700 1.5 based on floating dome measurements, Frankignoulle et al. [1996]
Moorea -149.8 -17.5 240-580 0.1 based on floating dome measurements, from Gattuso et al. [1993, 1997] and Frankignoulle et al. [1996]
Coastal upwelling systems
Vancouver Island coast -126.0 49.0 200-550 -1.2 using the k parameterization of Wanninkhof [1992], from Ianson and Allen [2002], and assuming an occurrence of El Niño and La Niña events with a frequency of, respectively, 0.56 and 0.44 based on Southern Oscillation Index for the 1983-2003 period from Climatic Research Unit of the University of East Anglia (http://www.cru.uea.ac.uk/)
Galician coast -9.2 42.5 265-415 -2.2 using the k parameterization of Wanninkhof [1992], from Borges and Frankignoulle [2002] Californian Coast -122.0 36.8 100-850 0.5 flux values converted to the k parameterization of Wanninkhof [1992] using conversion
factors determined from the Rayleigh frequency distribution from values originally computed from the k parameterization of Wanninkhof and McGillis [1999], from Friederich et al. [2002], and assuming an occurrence of El Niño and La Niña events with a frequency of, respectively, 0.56 and 0.44 based on Southern Oscillation Index for the 1983-2003 period from Climatic Research Unit of the University of East Anglia (http://www.cru.uea.ac.uk/) Oman coast 59.0 20.0 365-660 0.9 using the k parameterization of Wanninkhof [1992], from Goyet et al. [1998]
Marginal seas
Barents Sea 30.0 75.0 168-352 -3.6 using the k parameterization of Wanninkhof [1992], based on data compiled from Kaltin et al. [2002] and Omar et al. [2003], using NCEP daily wind speeds for the 1993-2003 period obtained from National Oceanic and Atmospheric Administration Climate Diagnostics Center (http://www.cdc.noaa.gov/), and assuming a zero air-ice CO2 flux (ice coverage based on data from the National Snow and Ice Data Center downloaded from http://nsidc.org/)
Bristol Bay -164.0 58.0 111-450 -0.2 using the k parameterization of Wanninkhof [1992], based on data compiled from Kelly and Hood [1971], Codispoti et al. [1986], Chen [1993], and Murata and Takiwaza [2002], using NCEP daily wind speeds for the 1993-2003 period obtained from National Oceanic and Atmospheric Administration Climate Diagnostics Center (http://www.cdc.noaa.gov/), and assuming a zero air-ice CO2 flux (ice coverage based on Walsh and Dieterle [1994])
Baltic Sea 20.0 57.0 156-475 -0.8 using the k parameterization of Wanninkhof [1992], from Thomas and Schneider [1999] North Sea 2.6 56.7 145-495 -1.4 flux values converted to the k parameterization of Wanninkhof [1992] using conversion
factors determined from the Rayleigh frequency distribution from values originally computed from the k parameterization of Wanninkhof and McGillis [1999], fromThomas et al. [2004] English Channel -1.2 50.2 200-500 0.0 using the k parameterization of Wanninkhof [1992], from Borges and Frankignoulle [2003] Gulf of Biscay -7.9 49.0 260-460 -2.9 using the k parameterization of Wanninkhof [1992], from Frankignoulle and Borges [2001] US Middle Atlantic Bight -74.5 38.5 200-660 -1.2 using the k parameterization of Wanninkhof [1992], from DeGranpre et al. [2002]
East China Sea 125.0 32.0 200-390 -2.1 flux values converted to the k parameterization of Wanninkhof [1992] using conversion factors determined from the Rayleigh frequency distribution from values originally computed from the k parameterization of Liss and Merlivat [1986], from Wang et al. [2000]
US South Atlantic Bight -80.6 31.0 300-1200 2.5 using the k parameterization of Wanninkhof [1992], from Cai et al. [2003] South China Sea 115.0 22.0 290-450 1.3 using the k parameterization of Wanninkhof [1992], from Zhai et al. [2005] Southwest Brazilian coast -45.5 -25.0 350-475 1.8 using the k parameterization of Wanninkhof [1992], from Ito et al. [2005]
Pryzd Bay 78.9 -68.6 50-325 -2.2 using the k parameterization of Wanninkhof [1992], from Gibson and Trull [1999], and assuming a zero air-ice CO2 flux during 297 d per year
Ross Sea 180.0 -75.0 130-425 -1.5 using the k parameterization of Wanninkhof [1992], from Sweeney [2003], and assuming a zero air-ice CO2 flux during 200 d per year
References cited in supplemental Table A1
Abril, G., H. Etcheber, B. Delille, M. Frankignoulle, and A. V. Borges (2003), Carbonate dissolution in the turbid and eutrophic Loire estuary, Mar. Ecol. Prog. Ser., 259, 129-138.
Bates, N. R. (2002), Seasonal variability of the effect of coral reefs on seawater CO2 and air-sea CO2 exchange, Limnol. Oceanogr., 47(1),
43-52.
Borges, A. V., and M. Frankignoulle (2002), Distribution of surface carbon dioxide and air-sea exchange in the upwelling system off the Galician coast, Global Biogeochem. Cycles, 16(2), 1020, doi:10.1029/2000GB001385.
Borges, A. V., and M. Frankignoulle (2003), Distribution of surface carbon dioxide and air-sea exchange in the English Channel and adjacent areas, J. Geophys. Res., 108(C8), 3140, doi:10.1029/2000JC000571.
Borges, A. V., S. Djenidi, G. Lacroix, J. Théate, B. Delille, and M. Frankignoulle (2003), Atmospheric CO2 flux from mangrove surrounding
waters, Geophys. Res. Let., 30(11), 1558, doi:10.1029/2003GL017143.
Bouillon, S., M. Frankignoulle, F. Dehairs, B. Velimirov, A. Eiler, G. Abril, H. Etcheber, and A. V. Borges (2003), Inorganic and organic carbon biogeochemistry in the Gautami Godavari estuary (Andhra Pradesh, India) during pre-monsoon: The local impact of extensive mangrove forests, Global Biogeochem. Cycles, 17(4), 1114, doi:10.1029/2002GB002026.
Cai, W. -J., and Y. Wang (1998), The chemistry, fluxes, and sources of carbon dioxide in the estuarine waters of the Satilla and Altamaha Rivers, Georgia, Limnol. Oceanogr., 43(4), 657-668.
Cai, W. -J., Z. H. A. Wang, and Y. C. Wang (2003), The role of marsh-dominated heterotrophic continental margins in transport of CO2 between
the atmosphere, the land-sea interface and the ocean, Geophys. Res. Let., 30(16), 1849, doi:10.1029/2003GL017633.
Carini, S., Weston N., Hopkinson C., Tucker J., Giblin A., and Vallino J. (1996), Gas Exchange Rates in the Parker River Estuary, Massachusetts, Biol. Bull., 191(2), 333-334.
Chen, C. T. A. (1993), Carbonate chemistry of the wintertime Bering Sea marginal ice-zone, Cont. Shelf Res., 13(1), 67-87.
Codispoti, L. A., G. E. Friederich, and D. W. Hood (1986), Variability in the inorganic carbon system over the southeastern Bering Sea shelf during spring 1980 and spring-summer 1981, Cont. Shelf Res., 5(1/2), 133-160.
Degrandpre, M. D., G. J. Olbu, C. M. Beatty, and T. R. Hammar (2002), Air-sea CO2 fluxes on the US Middle Atlantic Bight, Deep-Sea Res. II,
49(20), 4355-4367.
Frankignoulle, M., G. Abril, A. Borges, I. Bourge, C. Canon, B. Delille, E. Libert, and J.-M. Théate (1998), Carbon dioxide emission from European estuaries, Science, 282(5388), 434-436.
Frankignoulle, M., and A. V. Borges (2001), European continental shelf as a significant sink for atmospheric carbon dioxide, Global Biogeochem. Cycles, 15(3), 569-576.
Frankignoulle, M., J.-P. Gattuso, R. Biondo, I. Bourge, G. Copin-Montégut, and M. Pichon (1996), Carbon fluxes in coral reefs. II. Eulerian study of inorganic carbon dynamics and measurement of air-sea CO2 exchanges, Mar. Ecol. Prog. Ser., 145(1-3), 123-132.
Friederich, G. E., P. M. Walz, M. G. Burczynski, and F. P. Chavez (2002), Inorganic carbon in the central California upwelling system during the 1997-1999 El Niño-La Niña event, Progr. Oceanogr., 54(1-4), 185-203.
Gattuso, J. -P., M. Pichon, B. Delesalle, and M. Frankignoulle (1993), Community metabolism and air-sea CO2 fluxes in a coral reef ecosystem
(Moorea, French Polynesia), Mar. Ecol. Prog. Ser., 96(3), 259-267.
Gattuso, J. -P., C. E. Payri, M. Pichon, B. Delesalle, and M. Frankignoulle (1997), Primary production, calcification, and air-sea CO2 fluxes of a
macroalgal-dominated coral reef community (Moorea, French Polynesia), J. Phycol., 33(5), 729-738.
Gazeau, F., A. V. Borges, C. Barrón, C. M. Duarte, N. Iversen, J. J. Middelburg, B. Delille, M.-D. Pizay, M. Frankignoulle, and J.-P. Gattuso (2005), Net ecosystem metabolism in a micro-tidal estuary (Randers Fjord, Denmark): evaluation of methods and interannual variability. Mar. Ecol. Prog. Ser., in press
Gibson, J. A. E., and T. W. Trull (1999), Annual cycle of fCO2 under sea-ice and in open water in Prydz Bay, East Antarctica, Mar. Chem.,
66(3-4), 187-200.
Ghosh, S., T. K. Jana, B. N. Singh, and A. Choudhury (1987), Comparative study of carbon dioxide system in virgin and reclaimed mangrove waters of Sundarbans during freshet, Mahasagar : Bull. Nation. Instit. Oceanogr., 20(3), 155-161.
Goyet, C., F. J. Millero, D. W. O'Sullivan, G. Eischeid, S. J. McCue, and R. G. J. Bellerby (1998), Temporal variations of pCO2 in surface seawater of the Arabian sea in 1995, Deep-Sea Res. I, 45(4-5), 609-623.
Ianson, D., and S. E. Allen (2002), A two-dimensional nitrogen and carbon flux model in a coastal upwelling region, Global Biogeochem. Cycles, 16(1), 1011, doi:10.1029/2001GB001451.
Ito, R. G. , B. Schneider, and H. Thomas (2005), Seasonal variations of fCO2 in seawater of the southwestern subtropical Atlantic and adjacent
continental shelf, J. Mar. Sys., in press, doi:10.1016/j.jmarsys.2005.02.005
Kaltin, S., L. G. Anderson, K. Olsson, A. Fransson, and M. Chierici (2002), Uptake of atmospheric carbon dioxide in the Barents Sea, J. Mar. Sys., 38(1-2), 31-45.
Kelley, J. J., and D. W. Hood (1971), Carbon dioxide in the surface water of the ice-covered Bering Sea, Nature, 229, 37-39.
Liss, P. S., and L. Merlivat (1986), Air-sea exchange rates: introduction and synthesis, in The role of air-sea exchanges in geochemical cycling, edited by P. Buat-Ménard, p. 113-118, Reidel, Norwell.
Mukhopadhyay, S. K., H. Biswas, T. K. De, S. Sen, and T. K. Jana (2002), Seasonal effects on the air-water carbon dioxide exchange in the Hooghly estuary, NE coast of Gulf of Bengal, India, J. Environ. Monit., 4(4), 549-552.
Murata, A., and T. Takizawa (2002), Impact of a coccolithophorid bloom on the CO2 system in surface waters of the eastern Bering Sea shelf,
Geophys. Res. Let., 29(11), 1547, doi:10.1029/2001GL013906.
Ohde, S., and R. van Woesik (1999), Carbon dioxide flux and metabolic processes of a coral reef, Okinawa, Bull. Mar. Sc., 65(2), 559-576. Omar, A., T. Johannessen, S. Kaltin, and A. Olsen (2003), Anthropogenic increase of oceanic pCO2 in the Barents Sea surface water, J.
Geophys. Res., 108(C12), 3388, doi:10.1029/2002JC001628.
Ovalle, A.R.C., C. E. Rezende, L. D. Lacerda, and C. A. R. Silva (1990), Factors affecting the hydrochemistry of a mangrove tidal creek, Sepetiba bay, Brazil, Est. Coast. Shelf. Sci., 31(5), 639-650.
Raymond, P. A., J. E. Bauer, and J. J. Cole (2000), Atmospheric CO2 evasion, dissolved inorganic carbon production, and net heterotrophy in
the York River estuary, Limnol. Oceanogr., 45(8), 1707-1717.
Raymond, P. A., and J. J. Cole (2001), Gas exchange in rivers and estuaries: Choosing a gas transfer velocity, Estuaries, 24(2), 312-317. Sarma, V.V.S.S., M. D. Kumar, and M. Manerikar (2001), Emission of carbon dioxide from a tropical estuarine system, Goa, India, Geophys.
Res. Let., 28(7), 1239-1242, doi:10.1029/2000GL006114.
Sweeney, C. (2003), The annual cycle of surface CO2 and O2 in the Ross Sea: A model for gas exchange on the continental shelves of
Antarctica, in Biogeochemistry of the Ross Sea, Antarctic Research Series (78), edited G.R. DiTullio and R.B. Dunbar, pp. 295-312. Thomas, H., and B. Schneider (1999), The seasonal cycle of carbon dioxide in Baltic Sea surface waters, J. Mar. Sys., 22(1), 53-67.
Thomas, H., Y. Bozec, K. Elkalay, and H. J. W. De Baar (2004), Enhanced open ocean storage of CO2 from shelf sea pumping, Science,
304(5673), 1005-1008.
Walsh, J.J., and D. A. Dieterle (1994), CO2 cycling in the coastal ocean. I - A numerical analysis of the southeastern Bering Sea with applications to the Chukchi Sea and the northern Gulf of Mexico, Prog. Oceanog., 34(4), 335-392.
Wang, Z. A., and W. -J. Cai (2004), Carbon dioxide degassing and inorganic carbon export from a marsh-dominated estuary (the Duplin River): A marsh CO2 pump, Limnol. Oceanogr., 49(2), 341-354.
Wang, S. L., C. T. A. Chen, G .-H. Hong, and C. S. Chung (2000), Carbon dioxide and related parameters in the East China Sea, Cont. Shelf Res., 20(4-5), 525-544.
Wanninkhof, R.H. (1992), Relationship between wind speed and gas exchange over the ocean, J. Geophys. Res., 97(C5), 7373-7382.
Wanninkhof, R., and W. R. McGillis (1999), A cubic relationship between air-sea CO2 exchange and wind speed, Geophys. Res. Let., 26(13),
1889-1892.
Zhai, W., M. Dai, W. -J. Cai, Y. Wang, and H. Hong (2005), The partial pressure of carbon dioxide and air-sea fluxes in the northern South China Sea in spring, summer and autumn, Mar. Chem., 96(1-2), 87-97.