Institut National de la Recherche Scientifique (INRS) Centre Énergie, Matériaux et Télécommunications (EMT)
TERAHERTZ RADIATION FOR THE CHARACTERIZATION OF
PLASMONIC NANOPARTICLES
AND ITS BIOMEDICAL APPLICATIONS
by
Holger Breitenborn
A thesis submitted to obtain the degree of Philosophy Doctor (Ph.D.)
in Energy and Materials Science
Jury Members President of the Jury and
Internal Reviewer Prof. Annie Castonguay Armand-Frappier Santé Biotechnologie (AFSB)
Institut National de la Recherche Scientifique, Laval, Canada
External Reviewer Prof. Anie Philip
Department of Surgery, Faculty of Medicine McGill University, Montreal, Canada
External Reviewer Prof. Alina Karabchevsky
Department of Electrooptics and Photonics
Ben-Gurion University of the Negev, Beersheba, Israel
Research Director Prof. Roberto Morandotti
Énergie, Matériaux et Télécommunications (EMT)
Institut National de la Recherche Scientifique, Montreal, Canada
Research Co-Director Prof. Rafik Naccache
Department of Chemistry and Biochemistry and Centre for NanoScience Research
Concordia University, Montreal, Canada © Reserved rights of “Holger Breitenborn,” submitted on August 11th, 2020
ACKNOWLEDGMENTS
I am fortunate and grateful for having had the chance to pursue my Ph.D. in the group of my supervisor Prof. Roberto Morandotti. I benefitted from a wealth of opportunities and experiences, which helped me to develop various laboratory skills and diverse knowledge in optics and photonics, especially in ultrafast lasers and terahertz technology.
Additionally, I want to thank my co-supervisor, Prof. Rafik Naccache, for his guidance, suggestions, and the opportunity to use his characterization equipment often on short notice. Moreover, I also would like to acknowledge the generous support and insightful discussions with Prof. Luca Razzari and Prof. Fiorenzo Vetrone, who allowed me to use their laboratory and equipment as well.
My deepest gratitude goes to Dr. Junliang Dong and Dr. Riccardo Piccoli for their invaluable theoretical and practical support, companionship, and tremendous patience and effort in guiding me throughout my doctoral studies. Their contributions to conceptual and experimental activities were crucial for the success of my Ph.D. work. Many pleasurable and thought-provoking discussions with them have led to new ideas and personal growth.
I am indebted to Dr. Andrew Bruhacs and Dr. Lucas Vazquez Besteiro for their priceless contributions to the success of my thesis. It would have been impossible to get the study done without their assistance and expertise. A special acknowledgment goes to Dr. Alessandro Tomasino, with whom I spent numerous nights in the laboratory. He taught me many useful and practical skills while I was taking my first steps within the field of experimental optics at the beginning of my Ph.D. I also want to thank him for his friendship, invaluable support, and precious help in many other academic concerns.
Moreover, I want to acknowledge Artiom Skripka and Dr. Riccardo Marin for the supply of nanoparticles, characterization work, as well as for sharing their knowledge about a scientific field that had been new to me. Additionally, I want to thank Dr. Diego Caraffini for his programming efforts and resilience to help me make our THz-TDS system operating.
My special thanks go to Robin Helsten for the unconventional technical support, to Dr. Anna Mazhorova for her guidance at the beginning of my Ph.D. project, and Giacomo Balistreri for limitless coffee preparation.
I also would like to thank Dr. Yoann Jestin, Dr. Christian Reimer, and Piotr Roztocki, with whom I co-founded the university-spin off company Ki3 Photonics Technologies Inc.
I wish to thank my colleagues at Friedrich Schiller University and Fraunhofer Institute for Applied Optics and Precision Engineering IOF for a great time that we spent together during numerous activities in the framework of the international research training group of the DFG and the NSERC CREATE program in collaboration with INRS-EMT, University of Toronto and Laval University. In particular, I want to mention and acknowledge the support and friendship of Prof. Andreas Tünnermann and Prof. Stefan Nolte, who initiated my fruitful collaboration with Prof. Roberto Morandotti in 2013 and have generously supported my work and studies since then.
Finally, I wish to thank my parents, Adelheid and Jürgen Breitenborn, without whom my whole path would have been impossible. I am also deeply thankful to my wife, Maria Jose Lopez Perez, for her tremendous emotional and practical support, especially in difficult times during my Ph.D.
ABSTRACT
The precise evaluation of the photothermal effect of nanomaterials is an essential prerequisite for a variety of fields, such as biology, chemistry, and nanomedicine. In particular, photothermal therapies to destroy cancer cells require an accurate determination of the light conversion capabilities of plasmonic nanoparticles to attain the necessary temperature-induced effects in biological tissue. In this Ph.D. work, a new method has been developed for the quantification of the photothermal effect of nanoparticles in aqueous solutions. The photothermal conversion efficiency linked to the morphology of plasmonic nanoparticles was evaluated in a non-contact and non-invasive manner by combining spatial and temporal thermal dynamics derived at terahertz frequencies. The method is extendable to the characterization of all nanomaterials that experience a temperature-dependent variation of their refractive index in the terahertz frequency regime.
Moreover, the capabilities of the new method were extended to the biomedical realm to observe and evaluate nanoparticle-assisted laser tissue interaction. For example, laser tissue soldering assisted by plasmonic nanoparticles is a minimally invasive wound closure procedure that could replace commonly used, highly invasive sutures. The tissue fusing process is assisted by a nanoparticle-containing solder gel, which facilitates the absorption and transformation of laser energy into heat locally confined in the tissue edges. Meticulous monitoring of the photothermally heated solder and the tissue underneath is vital to minimize or even prevent photothermal damage inflicted by the intense laser radiation as well as optimize the tensile strength of the fused tissue. The new method constitutes a non-contact, non-invasive, and non-ionizing modality for evaluating photothermally induced damage enabled by the high sensitivity of terahertz radiation to the humidity content of biological tissue. Terahertz radiation was utilized to trace the evolution of the photothermal damage during the soldering procedure and to create a tomographic image allowing a quantitative evaluation of the incurred damage as a function of depth. In the future, this method could be implemented in a variety of medical applications that involve laser tissue interaction, including laser ablation and photothermal therapies.
Keywords: Terahertz Radiation, Terahertz Time-Domain Spectroscopy, Nanoparticles, Plasmonic Heating, Photothermal Heating, Photothermal Therapy, Photothermal Conversion Efficiency, Laser Tissue Interaction, Terahertz Biomedical Imaging, Terahertz Tomography
RÉSUMÉ
L'évaluation précise de l'effet photo-thermique des nanomatériaux est une condition fondamentale pour diverses applications, telles que la biologie, la chimie et la nano-médecine. En particulier, les thérapies photo-thermiques visant à détruire les cellules cancéreuses nécessitent une détermination précise des capacités de conversion lumineuse des nanoparticules plasmoniques utilisées, afin obtenir les effets nécessaires induits par la température dans les tissus biologiques considérés. Dans cette étude de doctorat, une nouvelle méthode a été développée pour la quantification de l'effet photo-thermique de nanoparticules dans des solutions aqueuses. L'efficacité de la conversion photo-thermique liée à la morphologie des nanoparticules plasmoniques a été évaluée de manière non-invasive et sans contact en combinant des dynamiques thermiques spatiales et temporelles dérivées à des fréquences térahertz. La méthode peut être étendue à la caractérisation de tous les nanomatériaux qui subissent une variation de leur indice de réfraction en fonction de la température dans le régime de fréquence térahertz. De plus, les capacités de la nouvelle méthode ont été étendues au domaine biomédical pour observer et évaluer les interactions laser-tissu assistées par nanoparticules. Par exemple, le soudage laser des tissus assisté par des nanoparticules plasmoniques est une procédure de fermeture de plaie peu invasive capable de remplacer les sutures très invasives couramment utilisées. Le processus de fusion tissulaire est assisté par un gel d’assemblage contenant des nanoparticules, ce qui facilite l'absorption et la transformation de l'énergie laser en chaleur localement confinée dans les bords du tissu. Un contrôle méticuleux de la soudure chauffée par photo-thermie et du tissu sous-jacent est essentiel pour minimiser ou même empêcher les dommages photo-thermiques causés par le fort rayonnement laser, ainsi que pour optimiser la résistance à la traction du tissu fondu. Par conséquent, la nouvelle méthode constitue une modalité sans contact, non-invasive et non-ionisante pour évaluer les dommages induits par photo-thermie rendus possibles par la sensibilité élevée du rayonnement térahertz à la teneur en humidité du tissu biomédical. Le rayonnement térahertz a été utilisé pour suivre l'évolution des dommages photo-thermiques au cours de la procédure de soudage et pour créer une image tomographique permettant une évaluation quantitative de la profondeur des dommages. Cette méthode peut être rapidement étendue et déployée pour une variété d'applications médicales impliquant une interaction laser-tissu, par exemple l'ablation au laser et les thérapies photo-thermiques.
Mots-clés: rayonnement térahertz, spectroscopie térahertz temps-domaine, nanoparticules, chauffage plasmonique, chauffage photo-thermique, thérapie photo-thermique, efficacité de la conversion photo-thermique, interaction laser-tissu, imagerie biomédicale THz, tomographie THz
TABLE OF CONTENTS
ACKNOWLEDGMENTS ... III ABSTRACT... V RÉSUMÉ ... VII TABLE OF CONTENTS ... IX LIST OF FIGURES ... XI LIST OF TABLES ... XIX LIST OF EQUATIONS ... XXI LIST OF ABBREVIATIONS... XXVII1 INTRODUCTION ... 1
1.1 MOTIVATION AND OBJECTIVES... 1
1.2 SCOPE OF THE THESIS ... 3
1.3 TERAHERTZ RADIATION... 5
1.3.1 THz Generation by using Photoconductive Antennas (PCAs) ... 7
1.3.2 THz Time-Domain Spectroscopy (THz-TDS) ... 10
1.3.3 THz Imaging ... 12
1.4 NANOPARTICLES ... 21
1.4.1 Localized Surface Plasmon Resonance Effect (LSPR) ... 23
1.4.2 Quantification of the Photothermal Effect of Nanoparticles ... 26
1.4.3 Photothermal Conversion Based Therapy for Wound Closure Procedures ... 29
2 CHARACTERIZATION OF THE PHOTOTHERMAL EFFECT OF PLASMONIC NANOPARTICLES BY TERAHERTZ LIGHT ... 33
2.1 SETUP FOR NANOPARTICLE CHARACTERIZATION AND IMAGING ... 33
2.2 DECONVOLUTION ALGORITHMS AND SIGNAL SELF-REFERENCING METHOD ... 35
2.2.1 Sparse Deconvolution Algorithm ... 36
2.2.2 Frequency-Wavelet Domain Deconvolution (FWDD) ... 39
2.2.3 Signal Self-Referencing Method ... 41
2.3 THEORETICAL MODEL FOR THE DETERMINATION OF THE PHOTOTHERMAL CONVERSION EFFICIENCY ... 42
2.4 GOLD NANOROD DISPERSIONS FOR BENCHMARK TESTS ... 45
2.5 CALIBRATION CURVE FOR TEMPERATURE MEASUREMENTS USING THZ-TDS ... 47
2.6 QUANTIFICATION OF THE PHOTOTHERMAL EFFECT VIA THZ-TDS ... 51
2.7 CHARACTERIZATION OF THE PHOTOTHERMAL EFFECTS OF COPPER SULFIDE NANOPARTICLE DISPERSIONS ... 60
2.8 ACCESSING THE SECOND BIOLOGICAL WINDOW BY EFFICIENT BROADBAND OPTICAL PARAMETRIC AMPLIFICATION IN NON-UNIFORM BULK CRYSTALS ... 68
3 THREE-DIMENSIONAL MONITORING OF NANOPARTICLE-ASSISTED LASER TISSUE
SOLDERING BY TERAHERTZ LIGHT ... 75
3.1 SPATIOTEMPORAL HEAT TRANSFER MODELLING OF NANOPARTICLE-ASSISTED LASER TISSUE INTERACTION ... 77
3.2 DYNAMIC THZ INVESTIGATION OF NANOPARTICLE-ASSISTED LASER TISSUE INTERACTION ... 81
3.3 THZ THREE-DIMENSIONAL CHARACTERIZATION OF NANOPARTICLE-ASSISTED LASER TISSUE SOLDERING ... 88
4 CONCLUSION ... 97
5 BIBLIOGRAPHY ... 101
6 ANNEX I ... 117
6.1 ARTICLES PUBLISHED IN PEER-REVIEWED SCIENTIFIC JOURNALS ... 117
6.2 CONFERENCE PROCEEDINGS ... 117 6.3 FILED PATENT ... 119 SOMMAIRE RÉCAPITULATIF ... 121 1. MOTIVATION ET OBJECTIFS ... 121 2. RADIATION TERAHERTZ... 123 3. NANOPARTICLES PLASMONIQUES ... 125
4. QUANTIFICATION DE L'EFFET PHOTO-THERMIQUE DES NANOPARTICULES ... 127
5. THÉRAPIE À BASE DE CONVERSION PHOTO-THERMIQUE POUR LES PROCÉDURES DE FERMETURE DE PLAIE ... 133
LIST OF FIGURES
FIGURE 1.1:ELECTROMAGNETIC SPECTRUM HIGHLIGHTING THE THZ FREQUENCY SECTION.(ADAPTED FROM THE NATIONAL INSTITUTE OF INFORMATION AND COMMUNICATIONS TECHNOLOGY (NICT)) ... 6 FIGURE 1.2: TEMPERATURE-DEPENDENT (A) REFRACTIVE INDEX AND (B) ABSORPTION COEFFICIENT OF WATER IN THE THZ FREQUENCY REGIME. (FIGURE ADAPTED FROM REFERENCES [25], [26]) ... 7 FIGURE 1.3: SCHEMATIC REPRESENTATION OF (A) THE WORKING PRINCIPLE OF A PHOTOCONDUCTIVE SWITCH IN WHICH A PHOTOCURRENT FLOWS THROUGH THE CIRCUIT WHEN LIGHT GENERATES FREE ELECTRONS AND HOLES. (FIGURE ADAPTED FROM REFERENCE [37]). (B) A PCA BIASED WITH A DC VOLTAGE AND ILLUMINATED BY A FEMTOSECOND LASER PULSE GENERATES SUB-PICOSECOND THZ TRANSIENTS. (FIGURE ADAPTED FROM REFERENCE [38])... 8 FIGURE 1.4: ILLUSTRATIVE EXAMPLE OF A PCA FOR BROADBAND GENERATION AND DETECTION OF THZ PULSES. (FIGURE ADAPTED FROM REFERENCE [25]) ... 9 FIGURE 1.5: (A) SCHEMATIC DIAGRAM FOR A TIME-RESOLVED MEASUREMENT OF THZ ELECTRIC FIELDS BY USING A PCA RECEIVER. (B) THE SIDE VIEW OF A PCA SHOWS A HIGH RESISTIVITY SILICON LENS ATTACHED IN FRONT OF THE SEMICONDUCTOR CHIP TO STRONGLY FOCUS THE INCIDENT THZ RADIATION INTO THE GAP BETWEEN THE TWO ELECTRODES.(FIGURES ADAPTED FROM REFERENCE [37]) ... 10 FIGURE 1.6: THZ TIME-DOMAIN SPECTROSCOPY SETUPS BASED ON PCAS IN (A) TRANSMISSION AND (B) REFLECTION CONFIGURATION.FEMTOSECOND LONG PULSES EMANATED FROM A LASER SYSTEM ARE SPLIT AT A BEAM SPLITTER AND GUIDED TO THE THZ TRANSMITTER AND RECEIVER. THE PROBE PULSE BEAM IS OPTICALLY DELAYED BY A TRANSLATION STAGE TO ALTER ITS ARRIVAL TIME WITH RESPECT TO THE THZ PULSE BEAM AT THE THZ RECEIVER. ... 11 FIGURE 1.7: A) REPRESENTATIVE REFERENCE THZ TRANSIENT AND ITS B) SPECTRUM OF THE THZ TIME-DOMAIN SPECTROSCOPY SYSTEM USED TO PERFORM THE EXPERIMENTS IN CHAPTERS 2 AND 3. ... 12 FIGURE 1.8:(A)THZ TRANSIENT IN THE TIME-DOMAIN AND ITS FOURIER TRANSFORMATION IN THE (B) FREQUENCY DOMAIN.THE PLOTS HIGHLIGHT SPECIFIC FEATURES, WHICH CAN BE CHOSEN TO GENERATE CONTRAST IN ORDER TO CONSTRUCT A TWO-DIMENSIONAL THZ IMAGE PIXEL BY PIXEL.(FIGURES ADAPTED FROM REFERENCE [42]) ... 12 FIGURE 1.9: THZ-TOF IMAGING IN REFLECTION MODE, THE TEMPORAL POSITIONS OF THE REFLECTED THZ ECHOES CAN BE USED FOR THICKNESS CALCULATIONS AND TO INTERROGATE MATERIAL PROPERTIES IN A BI- OR MULTILAYER STRUCTURE. (A) DIGITAL IMAGE OF A THZ REFLECTION SCHEME USED IN CHAPTER 2. AN INCIDENT THZ PULSE ENCOUNTERS A CUVETTE CONTAINING A GNR DISPERSION UNDER STUDY. THE PULSES ARE BEING PARTLY TRANSMITTED AND REFLECTED FROM BOTH THE CUVETTE’S SURFACE AND THE INTERNAL INTERFACE, WHICH CREATES TWO DISTINCT THZ REFLECTION ECHOES.AN X-Y TRANSLATION STAGE IMPARTS IMAGING CAPABILITIES. (B) CROSS-SECTION OF A BILAYER STRUCTURE CONTAINING A PE CUVETTE WINDOW AND AN AQUEOUS NP
DISPERSION. (C)TIME-DOMAIN PLOT DEPICTING A THZ TRACE WITH SEVERAL ECHOES ORIGINATING FROM THE AIR/PE SURFACE, THE PE/NP DISPERSION INTERFACE, AND ITS SECOND-ROUND REFLECTION DUE TO THE ETALON EFFECT. ... 14 FIGURE 1.10: (A) THZ MAP DISPLAYING THE COATING THICKNESS OF A MULTILAYER STRUCTURE OF AN M&M CHOCOLATE TABLET. (B) DIGITAL IMAGE OF THE CROSS-SECTION OF THE CHOCOLATE TABLET. (C) THZ B-SCAN OF THE TABLET REFERRING TO THE TABLET’S CROSS-SECTION. (FIGURES ADAPTED FROM REFERENCE [46]) ... 15 FIGURE 1.11: 0.1THZ TRANSMISSION IMAGE OF A COMPUTER BAG CONTAINING TWO GUNS (FIGURES ADAPTED FROM REFERENCE [42]) ... 16 FIGURE 1.12:THZ IMAGE OF A SEMICONDUCTOR INTEGRATED CIRCUIT CHIP PACKAGED IN PLASTIC MATERIAL. ... 16 FIGURE 1.13:(A)DIGITAL IMAGE OF THE MASTERPIECE TITLED AFTER FISHING BY AUSONIO TANDA.(B)THZ C-SCAN IMAGE HIGHLIGHTING DEFECT SPOTS. (C) THZ B-C-SCAN IMAGE OF THE CROSS-SECTION AT POSITION Y=176. THE DEFECT SPOTS ARE DISCERNIBLE AND MARKED. THEIR POSITION AND DEPTH WITHIN THE STRATIGRAPHY IS NOW UNVEILED (FIGURES ADAPTED FROM REFERENCE [48]) ... 17 FIGURE 1.14: THZ IMAGES OF A RAT SKIN BURN IN VIVO: (A) UNBURNED SKIN. (B) BURNED SKIN AFTER 10 MIN. (C) BURNED SKIN AFTER 1:16 H.(C)BURNED SKIN AFTER 7:11 H.THE LIGHTER AREAS CORRESPOND TO EDEMATOUS RESPONSE AREAS POST-BURN DUE TO THE HIGHER REFLECTED THZ SIGNAL OF LOCAL WATER.(FIGURES ADAPTED FROM REFERENCE [52]) ... 18 FIGURE 1.15:THE FIRST IN VIVO MEASUREMENTS OF A BASAL CELL CARCINOMA:(A)DIGITAL IMAGE OF THE CANCER REGION. (B) THZ IMAGE GENERATED BY PLOTTING THE THZ VALUE AT 𝑬𝒎𝒊𝒏, SHOWING SURFACE FEATURES. (C) NORMALIZED THZ IMAGE CREATED BY PLOTTING THE THZ PEAK AT THE OPTICAL DELAY OF 2.8 PS. HERE,THZ RADIATION PENETRATES BELOW THE SURFACE AND REVEALS SUBSURFACE FEATURES INDICATING THE EXTENT OF THE TUMOR AT DEPTH (~ 250 ΜM). (D) THZ TIME-DOMAIN TRACE ILLUSTRATES THE THZ CONTRAST BETWEEN HEALTHY AND DISEASED TISSUE. (FIGURES ADAPTED FROM REFERENCE [54]) ... 19 FIGURE 1.16: CANCER CELL IMAGES WITH AND WITHOUT GNRS: (A) DIGITAL IMAGE. (B) THZ IMAGE WITHOUT IR IRRADIATION. (C) THZ IMAGE WITH IR IRRADIATION. THE THZ AMPLITUDE IS THE HIGHEST FOR THE SAMPLE CONTAINING GNRS UNDER IR LASER IRRADIATION. (FIGURE ADAPTED FROM REFERENCE [57]) ... 19 FIGURE 1.17: IN VIVO AND EX VIVO THZ IMAGES OF TUMORS AFTER INJECTION OF GNRS CONJUGATED WITH A TUMOR-CELL TARGETING RECEPTOR IN THE CIRCULATORY SYSTEM OF A MOUSE:(A) AND (B)DIGITAL IMAGES OF THE MOUSE WITH A TUMOR.(C)THZ MOLECULAR IMAGE OF (B).(D)DIGITAL IMAGES OF THE TUMOR, LIVER, SPLEEN, KIDNEY, AND BRAIN. (E) THZ IMAGES OF (D), THE GNRS AGGREGATED IN THE CANCER CELLS, LIVER, AND SPLEEN. (FIGURES ADAPTED FROM REFERENCE [59]) ... 20 FIGURE 1.18: TERAMOMETRY (TEMPERATURE MEASUREMENTS BY USING THZ RADIATION) FOR THERMAL IMAGING OF PORCINE SKIN IN VITRO: (A) DIGITAL IMAGE DEPICTING THE PORCINE SKIN, INCLUDING THE GNR AND IBUPROFEN INJECTION SITES AS WELL AS THE MARKED SCANNING AREA. (B) THERMAL MAP OBTAINED UNDER PLASMONIC
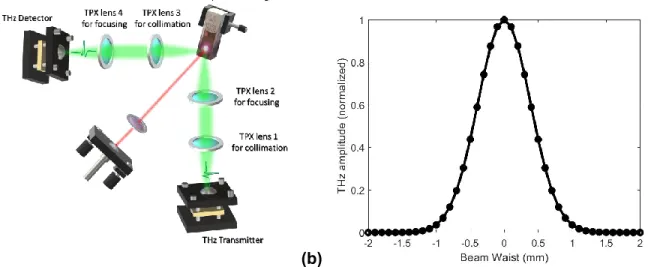
HEATING BY NIR LASER ILLUMINATION, PLOTTING THE THERMAL DISTRIBUTION AROUND THE INJECTION SITE.(C)THZ IMAGE OF THE SPECTRAL DISTRIBUTION OF AN IBUPROFEN DRUG COMPOUND SUBCUTANEOUSLY INJECTED INTO THE SKIN (FIGURES ADAPTED FROM REFERENCE [60]) ... 21 FIGURE 1.19: A) SCHEMATIC ILLUSTRATION OF THE LSPR ARISING FROM THE COHERENT OSCILLATION OF CONDUCTION BAND ELECTRONS IN RESONANCE WITH INCIDENT LIGHT FOR A SPHERICAL NP. B) A TYPICAL LSPR ABSORBANCE SPECTRUM OF A SPHERICAL NP. (FIGURES ADAPTED FROM REFERENCES [83], [86]) ... 23 FIGURE 1.20:THE SEQUENCE OF EVENTS AND TIME SCALES FOLLOWING THE ABSORPTION OF PHOTONS BY NPS. (FIGURE ADAPTED FROM REFERENCE [87]) ... 24 FIGURE 1.21: PLOT OF THE WAVELENGTH-DEPENDENT EFFECTIVE ATTENUATION COEFFICIENT OF BIOLOGICAL TISSUE HIGHLIGHTING THE TWO BIOLOGICAL WINDOWS.(FIGURE ADAPTED FROM REFERENCE [90]) ... 25 FIGURE 1.22: SCHEMATIC ILLUSTRATION OF THE (A) LONGITUDINAL AND TRANSVERSE LSPR OF A ROD-SHAPED NP. (B) A TYPICAL LSPR ABSORBANCE SPECTRUM OF A GNR EXHIBITING THE TRANSVERSE AND LONGITUDINAL LSPR PEAKS. (FIGURES ADAPTED FROM REFERENCES [83], [86]) ... 25 FIGURE 1.23: (A) – (F) TEM IMAGES OF GNRS HAVING AN ASPECT RATIO OF (A) 1.2 (B) 1.7 (C) 2.4 (D) 3.3 (E) 4.2 (F)5.3(G)EXTINCTION SPECTRA OF THE GNRS (A) TO (F) ILLUSTRATING THE EFFECT OF THE GNR’S ASPECT RATIO CHANGE ON THE POSITION OF THE LONGITUDINAL LSPR PEAK.(FIGURES ADAPTED FROM REFERENCE [91]) ... 26 FIGURE 1.24:EXPERIMENTAL SETUP FOR MEASURING THE TEMPERATURE PROFILE OF GOLD NP SOLUTIONS:(A) BY USING A THERMOCOUPLE (FIGURE ADAPTED FROM REFERENCE [8]).(B) BY USING IR THERMOGRAPHY (FIGURE ADAPTED FROM REFERENCE [9]) ... 27 FIGURE 1.25: WOUND CLOSING STUDY OVER 9 DAYS OF SEVERAL SKIN INCISIONS MADE IN MICE IN VIVO: (A) CONTROL SAMPLE (NO TREATMENT). INCISIONS WERE CLOSED BY USING: (B) LASER-ASSISTED TISSUE SOLDERING, (C) MEDICAL SUTURING,(D) LASER-ASSISTED TISSUE SOLDERING INVOLVING A NP-PROTEIN COMPOUND.(FIGURE ADAPTED FROM REFERENCE [14]) ... 30 FIGURE 2.1:(A)SKETCH OF THE THZ PART IN THE THZ-TDS SETUP CONFIGURED IN REFLECTION GEOMETRY USED TO CHARACTERIZE THE PHOTOTHERMAL EFFECT OF NP DISPERSIONS.(B)GAUSSIAN BEAM INTENSITY PROFILE OF THE THZ FOCUS SPOT. ... 33 FIGURE 2.2: DIGITAL IMAGE OF THE THZ PART IN THE THZ-TDS SETUP CONFIGURED IN REFLECTION GEOMETRY, SHOWN IN FIGURE 2.1(A). ... 34 FIGURE 2.3: THE THZ AMPLITUDES OF THE 1ST AND 2ND ECHOES BEFORE AND AFTER SIGNAL PROCESSING. (FIGURE
ADAPTED FROM REFERENCE [137]) ... 42 FIGURE 2.4:DIGITAL IMAGES OF THE SAMPLE CUVETTE CONTAINING THE DISPERSED GNRS WITH THE DIMENSIONS OF (A)10 NMX 41 NM,(B)25 NM X 90 NM, AND (C)50 NM X 150 NM, AS WELL AS THEIR REPRESENTATIVE TEM IMAGES. (D) VIS-NIR ABSORBANCE SPECTRA OF THE THREE GNR DISPERSIONS HIGHLIGHTING THE LASER
EMISSION LINE AT 786 NM AT WHICH THE GNRS WERE PLASMONICALLY EXCITED DURING THE EXPERIMENTS. (FIGURES ADAPTED FROM REFERENCE [137]) ... 46 FIGURE 2.5: (A) SCHEMATIC DIAGRAM OF THZ TEMPERATURE MEASUREMENTS BASED ON A THZ-TDS SYSTEM IN REFLECTION GEOMETRY DEPICTING AN ULTRAFAST LASER SYSTEM EMITTING A PULSE TRAIN THAT WAS SPLIT BY A BEAM SPLITTER (BS) INTO A PUMP AND PROBE BEAM AND SUBSEQUENTLY GUIDED TO THE THZ EMITTER AND DETECTOR, RESPECTIVELY. THE PROBE BEAM PASSED THROUGH A TEMPORAL DELAY IN ORDER TO PERFORM THZ-TDS.A786-NM CWNIR LASER BEAM USED TO PLASMONICALLY HEAT THE GNR DISPERSIONS WAS OVERLAPPED WITH THE THZ FOCUSING SPOT.THE POWER OF THE NIR ILLUMINATION TRANSMITTED THROUGH THE CUVETTE WAS RECORDED WITH A POWER METER.(B)SCHEMATIC DIAGRAM DEPICTING THE THZ RASTER-SCAN IMAGING PROCESS OF THE FRONT AND REAR WINDOW OF THE CUVETTE. DURING THE SCANNING PROCESS, THE THZ BEAM WAS RIGID, AND THE CUVETTE MOVED TOGETHER WITH THE NIR LASER PIXEL-BY-PIXEL. (FIGURES ADAPTED FROM REFERENCE [137]) ... 48 FIGURE 2.6: REPRESENTATIVE EXAMPLE OF A RECORDED THZ TRANSIENT REFLECTED OFF THE CUVETTE. THE SEPARATED 1ST AND 2ND ECHO AFTER APPLYING A SPARSE DECONVOLUTION ALGORITHM ARE ALSO DISPLAYED, IN
WHICH THE INFLUENCE OF THE “RINGING” EFFECT DUE TO THE AMBIENT WATER VAPOR IN THE AIR WAS ELIMINATED. (FIGURE ADAPTED FROM REFERENCE [137]) ... 49 FIGURE 2.7:TEMPERATURE-DEPENDENT REFLECTIVITY OF THE 2NDTHZ ECHO AS A FUNCTION OF TEMPERATURE
FOR GNR10.(A)TIME-DOMAIN TRACE OF THE THREE THZ ECHOES HIGHLIGHTING THE MODIFICATION ON THE 2ND
ECHO INTRODUCED BY THE PHOTOTHERMAL HEATING EFFECT. (B) CLOSE-UP OF THE 2ND ECHO HIGHLIGHTING ITS
MODIFICATIONS AS A FUNCTION OF THE STEADY-STATE TEMPERATURE VALUE OF THE NP DISPERSION. (FIGURES ADAPTED FROM REFERENCE [137]) ... 49 FIGURE 2.8:CALIBRATION CURVES FEATURING A LINEAR THERMOMETRIC RELATIONSHIP BETWEEN THZ AMPLITUDE AND TEMPERATURE FOR EACH OF THE GNR DISPERSIONS.(FIGURE ADAPTED FROM REFERENCE [137]) ... 51 FIGURE 2.9:TYPICAL TEMPERATURE TRANSIENTS MEASURED BY THZ-TDS.THE PROCEDURE AND PARAMETERS WERE THE SAME FOR EACH OF THE THREE GNR DISPERSIONS.A CONSTANT NIR LASER INTENSITY OF 31.8W/CM2 WAS EXERTED FOR 12 MINUTES TO RECORD THE HEATING CURVE. THEN, THE LASER WAS TURNED OFF TO OBTAIN THE COOLING CURVE. (FIGURE ADAPTED FROM REFERENCE [137])... 53 FIGURE 2.10: EXTRACTION OF THE HEAT DISSIPATION RATE 𝑩 AND THE ENERGY ABSORPTION RATE 𝑨 BY FITTING THE EXPERIMENTAL DATA (SYMBOLS) WITH EQUATION 2.24 FOR EACH OF THE THREE GNR DISPERSIONS. THE FITTING RESULTS (SOLID LINES) FOR THE COOLING CYCLES ARE SHOWN IN (A1), (B1), AND (C1), AND THE FITTING RESULTS (SOLID LINES) FOR THE HEATING CYCLES ARE SHOWN IN (A2), (B2), AND (C2), ACCORDINGLY. (FIGURES ADAPTED FROM REFERENCE [137]) ... 54 FIGURE 2.11: THZ IMAGING SETUP CONFIGURATION IN REFLECTION GEOMETRY. BOTH THE CUVETTE AND THE NIR LASER ARE ATTACHED TO THE SAME CAGE STRUCTURE THAT CAN BE MOVED BY AN X-Y TRANSLATION STAGE. THIS GEOMETRY ALLOWED THEM TO TRAVERSE TOGETHER ACROSS THE THZ BEAM. ... 54
FIGURE 2.12: THZ THERMOGRAPHS OF THE GNR10 DISPERSION TAKEN BY USING THZ-TDS RASTER-SCANS ILLUSTRATING THE THERMAL DISTRIBUTION WHEN THE STEADY-STATE LEVEL BY PLASMONIC HEATING WAS REACHED. (A) DIGITAL IMAGE OF THE FRONT SURFACE OF THE CUVETTE WITH THE LASER SPOT MARKED IN RED. THZ THERMOGRAPHS OF THE TEMPERATURE DISTRIBUTION 𝚫𝑻(RELATIVE TO THE AMBIENT VALUE) OF (B) THE FRONT AND (C) REAR WINDOW OF THE CUVETTE.(FIGURES ADAPTED FROM REFERENCE [137]) ... 55 FIGURE 2.13:EXPERIMENTALLY ATTAINED PCES 𝜼 (RED BARS) AND MHR(ORANGE BARS) OF THE THREE GNR DISPERSIONS WITH PARTICLE DIMENSIONS OF 10 NM X 41 NM,25 NM X 90 NM, AND 50 NM X 150 NM.FURTHERMORE, THE PCES APPROXIMATED BY THE THEORETICAL INTERACTION CROSS-SECTIONS ARE DISPLAYED AS WELL (PINK BARS).(FIGURE ADAPTED FROM REFERENCE [137]) ... 56 FIGURE 2.14: (A) SCHEMATIC ILLUSTRATION DEPICTING THE FUNDAMENTAL PROPERTIES PRESENTED IN FIGURE 2.13, ESPECIALLY THE RISE IN OVERALL EXTINCTION PER NP AND INCREASING SIGNIFICANCE OF SCATTERING AS THE NP VOLUME ENLARGES. (B) THEORETICAL EXTINCTION CROSS-SECTIONS 𝝈𝐞𝐱𝐭 OF THE THREE GNR DIMENSIONS AND THE RATIO BETWEEN THEIR SCATTERING CROSS-SECTIONS 𝝈𝐬𝐜𝐚𝐭 TO THE TOTAL EXTINCTION. (FIGURES ADAPTED FROM REFERENCE [137]) ... 57 FIGURE 2.15: THEORETICAL ASSESSMENT OF THE PCES 𝜼, CALCULATED BY USING EQUATION 2.32, CONSIDERING THE CALCULATED CROSS-SECTIONS AND THE ABSORPTION COEFFICIENT OF WATER 𝝁𝒘𝒂𝒕𝒆𝒓, ALSO SHOWN IN THIS PANEL.CHOOSING AN IRRADIATION WAVELENGTH OUTSIDE THE ABSORPTION LINES OF WATER IS CRUCIAL FOR EFFICIENT LOCALIZED HEAT DELIVERY. (FIGURE ADAPTED FROM REFERENCE [137]) ... 59 FIGURE 2.16: REPRESENTATIVE TEM IMAGES OF THE CUS NP DISPERSIONS WITH DIFFERENT CAPPING LIGANDS: (A) CUS CTAB. (B) CUS PAA. (C) CUS PEG. ... 61 FIGURE 2.17: VIS-IR SPECTROSCOPY ANALYSIS OF (A) THE STOCK DISPERSIONS. (B) DISPERSIONS ADJUSTED TO AN ABSORBANCE VALUE OF 0.8 AT 976 NM BY DILUTION WITH DEIONIZED WATER. ... 61 FIGURE 2.18:(A)THZ PROPAGATION IN REFLECTION GEOMETRY THROUGH THE INTERFACES AIR/PE AND PE/NP DISPERSION. (B) THE RESULTING TWO REFLECTED THZ PULSE ECHOES IN THE TIME-DOMAIN ARE STRONGLY OVERLAPPED. ... 63 FIGURE 2.19: TIME-DOMAIN PLOTS OF THE TEMPERATURE CALIBRATION MEASUREMENTS. THE DECONVOLVED 2ND
THZ REFLECTION ECHO ORIGINATING FROM THE PE/NP DISPERSION INTERFACE EXHIBITS A CHANGE IN THE AMPLITUDE DEPENDING ON THE TEMPERATURE VALUE. ... 64 FIGURE 2.20: (A) DECONVOLVED 1ST ECHO ORIGINATING FROM THE AIR/PE INTERFACE. (B) DECONVOLVED 2ND THZ
ECHO FROM THE PE/NP DISPERSION INTERFACE CLEANED FROM THE INTERFERENCE WITH THE 1ST THZ ECHO. . 64
FIGURE 2.21: CALIBRATION MEASUREMENTS: (A) DIGITAL IMAGE OF THE THERMOELECTRIC HEATING/COOLING ELEMENT ATTACHED TO THE CUSTOM-MADE CUVETTE. (B) CALIBRATION CURVES FOR THE THREE CUS NP DISPERSIONS BETWEEN 22 °C AND 40 °C ILLUSTRATING THE THERMOMETRIC RELATIONSHIP BETWEEN TEMPERATURE AND THZ AMPLITUDE. ... 65
FIGURE 2.22:DIGITAL IMAGE OF THE CUSTOM-MADE CUVETTE ATTACHED TO A SAMPLE HOLDER AND ILLUMINATED BY A NIR LASER BEAM OF 976 NM WAVELENGTH. ... 66 FIGURE 2.23: TIME-RESOLVED HEATING CURVES AT A NIR POWER INTENSITY OF 0.68 W/CM2: (A) CHANGE IN THZ REFLECTIVITY WITH TIME. (B) THZ REFLECTIVITY CORRELATION WITH TEMPERATURE USING THE CALIBRATION VALUES OF EACH CUS NP SYSTEM. (C) TEMPERATURE CHANGE NORMALIZED TO THE CU ION CONCENTRATION OF THE THREE DISPERSIONS. ... 67 FIGURE 2.24:NORMALIZED PARTICLE SIZE DISTRIBUTION OF THE THREE CUSNP DISPERSIONS DERIVED FROM A DLS ANALYSIS. ... 67 FIGURE 2.25:(A)FLOW DIAGRAM OF THE TWM PROCESS IN A NONLINEAR MEDIUM ILLUSTRATING THE INPUT AND OUTPUT LASER BEAMS HAVING DIFFERENT FREQUENCIES.(B)ENERGY DIAGRAM OF THE TWM PROCESS, WHICH CAN BE PERCEIVED AS STIMULATED EMISSION OF SIGNAL PHOTONS FROM A VIRTUAL ENERGY LEVEL EXCITED BY THE PUMP. (FIGURE ADAPTED FROM REFERENCE [158]) ... 69 FIGURE 2.26: A) SIMULATED CONVERSION EFFICIENCIES AS A FUNCTION OF WAVELENGTH FOR THREE TEMPERATURE DISTRIBUTIONS INSIDE AN LBO CRYSTAL. EXPONENTIAL (RED LINE) AND LINEAR (GREEN LINE) TEMPERATURE GRADIENTS HAVING A TEMPERATURE CONTRAST OF 60 °C(100°C–160°C) ARE COMPARED TO THE CONSTANT TEMPERATURE PROFILE OF 130°C(BLACK LINE). B)MODELED CONVERSION EFFICIENCIES AS A FUNCTION OF WAVELENGTH FOR DIFFERENT LINEAR TEMPERATURE DISTRIBUTIONS INSIDE AN LBO CRYSTAL. TEMPERATURE CONTRASTS OF 40°C(110°C–150°C) AND 60°C(100°C–160 °C) POSSESS THE HIGHEST CONVERSION EFFICIENCY AND BANDWIDTH. (FIGURES ADAPTED FROM REFERENCE [157]) ... 71 FIGURE 2.27: SCHEMATIC REPRESENTATION OF THE EXPERIMENTAL SETUP. A PUMP AND A SEED BEAM WERE GUIDED THROUGH THE LEFT FACET OF AN LBO CRYSTAL WITH AN APPLIED TEMPERATURE GRADIENT ALONG ITS LENGTH. AFTER EXITING THE CRYSTAL, THE RESIDUAL DEPLETED PUMP BEAM WAS BLOCKED BY A LONG-PASS FILTER, WHEREAS A PHOTODIODE MEASURED THE AMPLIFIED SIGNAL WAVE.(FIGURE ADAPTED FROM REFERENCE [157]) ... 72 FIGURE 2.28: A CUSTOMIZED CRYSTAL HOLDER FEATURING FOUR EQUIDISTANTLY SPACED THERMOELECTRIC HEATERS AND THEIR RESPECTIVE THERMISTORS FOR TEMPERATURE CONTROL DIRECTLY CONNECTED TO THE CRYSTAL SURFACE. (FIGURE ADAPTED FROM REFERENCE [157]) ... 73 FIGURE 2.29: MEASURED CONVERSION EFFICIENCIES AS A FUNCTION OF THE SEED BEAM WAVELENGTH: A) EXPONENTIAL AND LINEAR TEMPERATURE GRADIENTS (100 °C TO 160 °C). B) LINEAR TEMPERATURE GRADIENTS (EACH CENTERED AROUND 130 °C HAVING A DIFFERENT TOTAL TEMPERATURE CONTRAST) AND A CONSTANT TEMPERATURE OF 130°C.(FIGURES ADAPTED FROM REFERENCE [157]) ... 74 FIGURE 3.1:SCHEMATIC DEPICTION OF TISSUE EXCISED FROM PORCINE EAR SKIN PLOTTING DIFFERENT STAGES OF PHOTOTHERMAL REACTIONS DURING A NP-ASSISTED LASER TISSUE SOLDERING PROCESS.ADDITIONALLY, A THZ MULTIDIMENSIONAL IMAGING MODALITY IS DISPLAYED REPRESENTED BY AN INCOMING THZ REFERENCE PULSE BEING REFLECTED MULTIPLE TIMES OFF VARIOUS INTERFACES. THIS PRODUCES A TRAIN OF CONVOLVED THZ
ECHOES CONTAINING MULTIDIMENSIONAL INFORMATION THAT IS REQUIRED TO ASSESS THE DEPTH AND SEVERITY OF THE PHOTOTHERMAL DAMAGE, WHICH WAS INFLICTED ON THE SKIN INCISION AREA BY NIR LASER IRRADIATION. (FIGURE ADAPTED FROM REFERENCE [166]) ... 75 FIGURE 3.2: (A) SCHEMATIC DIAGRAM OF THE NP-ASSISTED LASER TISSUE INTERACTION PROCESS CREATED BY A FINITE ELEMENT MODEL ENCOMPASSING A TWO-LAYER STRUCTURE MADE OF SOLDER GEL AND SKIN TISSUE SURROUNDED BY AIR. (B) SIMULATED TEMPERATURE TRANSIENTS ON THE SURFACE OF THE SKIN, WITH AND WITHOUT MODELING THE RESULTING TISSUE DAMAGE. THE INSET SHOWS A ZOOM IN ON THE TEMPERATURE TRANSIENT OF THE BARE SKIN WITHOUT THE APPLICATION OF A SOLDER GEL.(C)SIMULATED THREE-DIMENSIONAL THERMAL DISTRIBUTION IN SKIN TISSUE COATED WITH SOLDER GEL AFTER A LASER EXPOSURE TIME OF 250 S. TEMPERATURE CONTOURS OF 60 ˚C AND 100 ˚C ARE HIGHLIGHTED IN WHITE AND BLACK, RESPECTIVELY. (D) THE THERMAL DISTRIBUTION AS A FUNCTION OF DISTANCE BELOW AND ABOVE THE SKIN TISSUE SURFACE. THE SURFACE WAS COATED WITH A NP CONTAINING SOLDER GEL. (E) ESTIMATED DAMAGE DISTRIBUTION IN THE SKIN WITH THE APPLICATION OF THE SOLDER GEL AFTER 250 S OF LASER EXPOSURE. (FIGURES ADAPTED FROM REFERENCE [166]) ... 77 FIGURE 3.3:EXPERIMENTAL THZ-TDS SETUP CONFIGURED TO REFLECTION GEOMETRY DEPICTING AN ULTRAFAST LASER EMITTING PULSES THAT ARE SPLIT BY A BEAM SPLITTER (BS) INTO A PUMP AND PROBE BEAM.BOTH BEAMS ARE GUIDED TO THE THZ EMITTER AND DETECTOR, RESPECTIVELY.THE PROBE BEAM PASSES THROUGH A DELAY LINE TO INTRODUCE A TEMPORAL DELAY TO PERFORM THZ-TDS.A786-NM NIRCW LASER BEAM PLASMONICALLY HEATED A GNR BLENDED SOLDER GEL, WHICH COVERED THE PORCINE EAR SKIN SAMPLE. (FIGURE ADAPTED FROM REFERENCE [166]) ... 81 FIGURE 3.4: (A) REPRESENTATIVE TEM IMAGE OF GNRS FEATURING A DIMENSION OF 10 NM X 41 NM. (B) VIS-NIR ABSORBANCE SPECTRUM OF THE GNR DISPERSION HIGHLIGHTING THE EXCITATION WAVELENGTH AT 786 NM, WHICH WAS USED TO EXCITE PLASMONICALLY THE GNRS DURING THE EXPERIMENT. ... 82 FIGURE 3.5DIGITAL IMAGES OF A PORCINE EAR SKIN SAMPLE COATED WITH A GNR BLENDED SOLDER GEL.(A) THINLY APPLIED ON THE SURFACE BEFORE NIRCW LASER ILLUMINATION.(B)AFTER PLASMONIC LASER HEATING FOR 250 S FEATURING A SKIN SURFACE DAMAGE IN THE FORM OF CARBONIZED SKIN AND SOLDER GEL. (FIGURES ADAPTED FROM REFERENCE [166]) ... 83 FIGURE 3.6: (A) DYNAMIC THZ SINGLE-POINT MEASUREMENT DEPICTING 250 REFLECTED THZ TRACES SUCCESSIVELY RECORDED AT A SAMPLING RATE OF ONE THZ TRACE PER SECOND DURING NIR LASER ILLUMINATION WITH AN INTENSITY OF 4.2 W/CM2. (B) DYNAMIC THZ SINGLE-POINT MEASUREMENT PRESENTING 250 DECONVOLVED THZ TIME-DOMAIN TRACES ATTAINED AFTER THE APPLICATION OF AN FWDD ALGORITHM.(FIGURES ADAPTED FROM REFERENCE [166]) ... 84 FIGURE 3.7: TYPICAL THZ RAW AND DECONVOLVED SIGNALS AT SPECIFIC TIME STEPS T DERIVED FROM THE DYNAMIC THZ SINGLE-POINT MEASUREMENT. (A1-A8) CORRESPOND TO THE RAW THZ SIGNALS RECORDED AT T = 1 S, 20 S, 40 S, 50 S, 70 S, 160 S, 200 S, AND 250 S, RESPECTIVELY. (B1-B8) CORRESPOND TO THE DECONVOLVED
SIGNALS AFTER APPLYING AN FWDD ALGORITHM TO THE RAW THZ SIGNALS. THE DECONVOLVED SIGNAL IS NORMALIZED TO ITS MAXIMUM PEAK LEVEL. (FIGURES ADAPTED FROM REFERENCE [166]) ... 85 FIGURE 3.8: DIGITAL CROSS-SECTIONAL IMAGE OF THE PORCINE EAR SKIN SAMPLE COATED WITH SOLDER GEL AFTER 250 S OF NIR LASER EXPOSURE. THE THERMAL DAMAGE SUBDIVIDED INTO DIFFERENT ZONES IS VISIBLE. THE SUPERFICIAL LAYER BULGED, CAUSING A BUMP ON THE SKIN. ... 87 FIGURE 3.9: (A) PORCINE EAR SKIN SAMPLE WITH A LINE-SHAPED INCISION OF 10-MM LENGTH WAS EVENLY COATED WITH A GNR BLENDED PROTEIN SOLDER GEL.(B)SOLDERED SKIN INCISION AFTER 250 S OF PLASMONIC NIRCW LASER HEATING ACHIEVED BY EXERTING A LASER INTENSITY OF 40W/CM2.(C) NIR LASER TISSUE SOLDERING PROCEDURE. THE SOLDER GEL COVERING THE SKIN INCISION WAS PLASMONICALLY HEATED BY NIR LASER RADIATION TO FUSE THE INCISION EDGES. A TWO-DIMENSIONAL TRANSLATION STAGE MOVED THE SKIN TO PERFORM THREE CONSECUTIVE LINE SCANS. ... 88 FIGURE 3.10: THZ REFLECTIVE IMAGING CONFIGURATION COMPOSED OF A THZ EMITTER, DETECTOR, 2D TRANSLATION STAGE, AND TPX LENSES TO GUIDE THE THZ RADIATION TO THE SAMPLE STAGE AND THE THZ DETECTOR. THE SAMPLE HOLDER COULD BE MOVED IN THE X-Y DIRECTION TO PERFORM THZ RASTER-SCANS. .. 89 FIGURE 3.11:(A1-A3) DIGITAL IMAGES OF THE PORCINE EAR SKIN SAMPLES AFTER NP-ASSISTED LASER SOLDERING WITH A 20 W/CM2,30W/CM2, AND 40W/CM2 LASER INTENSITY.(B1-B3)THZ C-SCAN IMAGES,(C1-C3)THZ CROSS -SECTIONAL IMAGES, AND (D) BINARY THZ CROSS-SECTIONAL IMAGES.THE CROSS-SECTIONAL IMAGES (C1-C3) AND (D1-D3) ARE TAKEN ALONG THE DASHED LINE MARKED IN (B1-B3).(FIGURES ADAPTED FROM REFERENCE [166]) 91 FIGURE 3.12: THZ THREE-DIMENSIONAL IMAGES OF THE PORCINE EAR SKIN SAMPLES AFTER NP-ASSISTED LASER TISSUE SOLDERING WITH AN INTENSITY OF (A) 20 W/CM2, (B) 30 W/CM2, AND (C) 40 W/CM2DEPICTING THE DEPTH OF THE PHOTOTHERMAL DAMAGE INFLICTED BY PLASMONIC HEATING EFFECT AFTER 250 S OF NIR CW LASER EXPOSURE.(FIGURES ADAPTED FROM REFERENCE [166]) ... 92
LIST OF TABLES
TABLE 2.1:PHYSICAL AND CHEMICAL PARAMETERS OF THE INVESTIGATED GNR DISPERSIONS. ... 47 TABLE 2.2:SPECIFICS OF THE STUDIED CUSNP DISPERSIONS. ... 62 TABLE 3.1: PHYSICAL AND CHEMICAL PARAMETERS OF THE GNR DISPERSION BLENDED WITH A BSA POWDER TO FORM A SOLDER GEL. ... 83 TABLE 3.2: DESCRIPTION OF THE PHOTOTHERMAL EFFECTS IN THE PORCINE EAR SKIN SAMPLE DURING THE SINGLE-POINT MEASUREMENT. ... 86
LIST OF EQUATIONS
𝐽(𝑡) = 𝑁(𝑡)𝑒𝜇𝐸b 1.1 𝐸THz= 1 4𝜋𝜀0 𝐴 𝑐2𝑧 𝜕𝐽(𝑡) 𝜕𝑡 1.2 𝐸THz= 𝐴𝑒 4𝜋𝜀0𝑐2𝑧 𝜕𝑁(𝑡) 𝜕𝑡 𝜇𝐸b 1.3 𝐽̅(𝜏) = 𝑁̅𝑒𝜇𝐸(𝜏) 1.4 𝛥𝑡 = 2𝑛𝑑 𝑐 cos𝜑 1.5 𝐸diff=Max(𝐸ref(𝑡)) − Max (𝐸pixel(𝑡)) Max(𝐸ref(𝑡)) 1.6 𝐴𝑉 = log10( 𝑃incident 𝑃transmitted ) 1.7
𝐷𝑅(𝑡) =maximum value of temporal amplitude
RMS of noise floor 2.1 𝑆𝑁𝑅(𝑡) =mean value of temporal amplitude STD of temporal amplitude 2.2 𝑟(𝑡) = 𝑖(𝑡) ⊗ 𝑓(𝑡) = ∫ 𝑖(𝜏)𝑓(𝑡 − 𝜏)𝑑𝜏 +∞ −∞ 2.3
𝑟𝑛= ∑ 𝑖𝑚𝑓𝑛−𝑚+ 𝑒𝑛 𝑀−1 𝑚=0 2.4 𝑟 = 𝐴𝑓 + 𝑒 2.5 min 𝑓 1 2‖𝐴𝑓 − 𝑟‖2 2+ 𝜆‖𝑓‖ 0 2.6 min 𝑓 1 2‖𝐴𝑓 − 𝑟‖2 2+ 𝜆‖𝑓‖ 1 2.7 min f ‖𝑓‖1= ∑ |𝑓𝑛| 𝑁−1 𝑛=0 2.8 𝑓𝑖+1= 𝑆𝜆𝜏(𝑓𝑖− 𝜏𝐴𝑇(𝐴𝑓𝑖− 𝑟)) 2.9 𝜏 < 2 ‖𝐴𝑇𝐴‖ 2 2.10 𝑆𝜆𝜏(𝑓[𝑛]) = { 𝑓[𝑛] + 𝜆𝜏 0 𝑓[𝑛] − 𝜆𝜏 𝑓[𝑛] ≤ −𝜆𝜏 𝑓[𝑛] < 𝜆𝜏 𝑓[𝑛] ≥ 𝜆𝜏 2.11 𝑓(𝑡) = FFT−1[FFT(𝑟(𝑡)) FFT(𝑖(𝑡))] 2.12 𝑓(𝑡) = FFT−1[FFT(𝑔(𝑡)) ×FFT(𝑟(𝑡)) FFT(𝑖(𝑡))] 2.13 𝑓′(𝑡) = 𝑔(𝑡) ⊗ 𝑓(𝑡) 2.14
𝐺(𝜔) = {𝑒 𝑖𝜔𝑡0cos2( 𝜔 4𝑔𝑐 ) |𝜔| ≤ 2𝜋𝑔c 0 |𝜔| > 2𝜋𝑔c 2.15 𝐸𝑥corrth = 𝐸1constst 𝐸1st 𝐸𝑥th 2.16 𝑄abs− 𝑄diss= ∑ 𝑚𝑖𝐶𝑖 𝑖 𝑑𝑇 𝑑𝑡 2.17 𝑄abs = 𝑃(1 − 10−𝐴𝑉𝜆)𝜂 2.18 𝑄diss= ℎ𝑆[𝑇(𝑡) − 𝑇0] 2.19 𝑑𝑇 𝑑𝑡 = 𝑃(1 − 10−𝐴𝑉𝜆)𝜂 ∑ 𝑚𝑖 𝑖𝐶𝑖 − ℎ𝑆 ∑ 𝑚𝑖 𝑖𝐶𝑖 [𝑇(𝑡) − 𝑇0] 2.20 𝐴 =𝑃(1 − 10 −𝐴𝑉𝜆)𝜂 ∑ 𝑚𝑖 𝑖𝐶𝑖 2.21 𝐵 = ℎ𝑆 ∑ 𝑚𝑖 𝑖𝐶𝑖 2.22 𝑑𝑇 𝑑𝑡= 𝐴 − 𝐵[𝑇(𝑡) − 𝑇0] 2.23 𝑇(𝑡) = 𝑇0+ 𝐴 𝐵(1 − 𝑒 −𝐵𝑡) + (𝑇 initial− 𝑇0)𝑒−𝐵𝑡 2.24 𝜂 = 𝐴 ∑ 𝑚𝑖 𝑖𝐶𝑖 𝑃(1 − 10−𝐴𝑉𝜆) 2.25
𝑀𝐻𝑅 =𝐴 𝑐 2.26 𝐼 = 2𝑃 𝜋 (𝑑2) 2 2.27 𝑇(𝑡) = 𝑇0+ (𝑇max− 𝑇0)𝑒−𝐵𝑡 2.28 𝐵𝑡 = −ln[(𝑇(𝑡) − 𝑇0) (𝑇⁄ max− 𝑇0)] 2.29 𝑚effdis=∬ 𝑇(𝑥, 𝑦)𝑑𝑥𝑑𝑦 𝑆A 𝑚dis 2.30
𝑚effcuv=𝑚effdis 𝑚dis
𝑚cuv 2.31
𝜂 =𝑄dispersion− 𝑄solvent 𝑄extinction
=𝑒
−𝜇water𝐿− 𝑒−(𝜎abs𝑛GNR+𝜇water)𝐿
(1 − 𝑒−𝜎ext𝑛GNR𝐿) 2.32 𝜀broad= 𝜀gold,experimental+ 𝜔P2 𝜔(𝜔 + 𝑖Γ)− 𝜔P2 𝜔(𝜔 + 𝑖2Γ) 2.33 𝑗𝜕𝐴1,2 𝜕𝑧 + 𝜔1,2 𝑛1,2𝑐 𝜒𝑒𝑓𝑓𝐴2,1𝐴3exp [+𝑗 ∫ Δ𝑘(𝜁)𝑑𝜁 𝑧 0 ] = 0 2.34 𝑗𝜕𝐴3 𝜕𝑧 + 𝜔3 𝑛3𝑐 𝜒𝑒𝑓𝑓𝐴1𝐴2exp [−𝑗 ∫ Δ𝑘(𝜁)𝑑𝜁 𝑧 0 ] = 0 2.35 Δ𝑘(𝑧) = 𝑘3(𝑧) − 𝑘1(𝑧) − 𝑘2(𝑧), 𝑘1,2,3(𝑧) = 2𝜋 𝜆1,2,3 𝑛1,2,3(𝑧) 2.36
𝑄ext= 𝜌𝐶p 𝜕𝑇 𝜕𝑡+ 𝛻(−𝑘𝛻𝑇) 3.1 𝑄laser= − 𝜕𝐼(𝑟, 𝑧) 𝜕𝑧 |abs = 𝜇abs𝐼(𝑟, 𝑧) 3.2 𝐼(𝑟, 𝑧) = 𝐼0(𝑟)𝑒−(𝜇abs+𝜇scat)𝑧 3.3 𝑄conv= −ℎ(𝑇 − 𝑇0) 3.4 𝑄rad= −𝜀𝜎(𝑇4− 𝑇04) 3.5
LIST OF ABBREVIATIONS
2D two-dimensional
3D three-dimensional BSA bovine serum albumin
CTAB hexadecyltrimethylammonium bromide
Cu copper
CuS copper sulfide
CV coefficient of variation
CW continuous wave
DC direct current
DLS dynamic light scattering
DR dynamic range
FWDD frequency-wavelet domain deconvolution GNR gold nanorod
ICP-MS inductively coupled plasma mass spectrometry
IR infrared
LBO lithium triborate
LSPR localized surface plasmon resonance LT-GaAs low-temperature grown gallium arsenide MHR molar heating rate
NETS nanoantenna enhanced terahertz spectroscopy NIR near-infrared
NP nanoparticle
NPs nanoparticles
PAA polyacrylic acid
PCA photoconductive antenna
PCE photothermal conversion efficiency
PE polyethylene
PEG polyethylene glycol PMMA poly(methylmethacrylate) PTT photothermal therapy RMS root-mean-square
SEIRAS surface-enhanced infrared absorption spectroscopy SERS surface-enhanced Raman scattering
SNR signal-to-noise ratio STD standard deviation
TEM transmission electron microscopy THz terahertz
THz-TDS terahertz time-domain-spectroscopy THz-ToF terahertz time-of-flight
1 Introduction
1.1 Motivation and Objectives
Heat describes the energy that a system exchanges with the environment. Exchanged heat, in turn, changes the average kinetic energy of the particles in a system, which is measured by means of temperature. Comprehensively understanding the properties of heat diffusion according to the properties of nanostructures, not just on a macroscale but also on a micro- and nanoscale, will augment the capability of new modern-day heating applications in which optical-to-thermal energy conversion in aqueous systems is required, such as photothermal therapy, nano-chemistry, nanosurgery, photoacoustic imaging, optofluidics, and photothermal imaging [1], [2]. Plasmonic systems open the route to nano-photonics due to their unique ability to confine electromagnetic energy down to ultra-small volumes that enable nanometer-scale light manipulation. Localized heating through the irradiation of metal nanostructures, so-called thermo-plasmonics, has thrived in recent years because it uniquely provides remotely controllable nanometer-scale heat sources to control temperature on the nanoscale. Under illumination with intense electromagnetic fields at its plasmonic resonance, such as those originating from light-emitting laser sources, a metal nanoparticle (NP) possesses enhanced light absorption properties, turning it into an ideal remotely controllable nano-source of heat in aqueous systems [3], [4]. These properties allow to significantly increase the temperature in and around NPs by using low-intensity irradiation, which will not heat the overall system, thus conferring spatial control over the energy deposition. Recent research efforts have been directed towards optimizing the NP’s photothermal conversion efficiency (PCE) [5]–[8], meaning its capacity to convert light into heat. The higher the PCE, the lower is the necessary laser power and the dose of NPs that are required to induce the desired heating effects, which is especially relevant for biomedical applications within tissue. However, even nowadays, it is still difficult to accurately measure the temperature of NP dispersions under obstructed conditions. The measurement of the precise temperature and thermal distribution during heating and cooling procedures of NP dispersions is crucial for the determination of the PCE to be able to benchmark NPs differing, for instance, in material properties, composition, size, and morphology. Conventional contact and non-contact methods to quantify the PCE of NP dispersions are inconvenient and inaccurate. Contact methods, for instance, thermocouples [8], are invasive, influence the measurement, and do not work when the aqueous system is closed or otherwise inaccessible. Non-contact measurement methods like infrared (IR) thermometers [9] determine only the surface temperature of a vessel, which houses the aqueous system in a direct
line of sight. The measured result does not necessarily represent the temperature value of a liquid inside this vessel. Moreover, the NP dispersion must be consistently homogenized by a magnetic stir bar to achieve an equal temperature distribution within the vessel, a process that is both invasive and can lead to contamination.
The work in this thesis utilizes recently developed pulsed radiation sources at terahertz (THz) frequencies (30 μm to 3 mm wavelength range) [10], [11] to measure the temperature inside vessels housing aqueous systems in a time- and spatially- resolved manner. THz radiation has low photon energy and therefore is non-ionizing. Additionally, it is highly sensitive to the refractive index changes of water-based systems as a function of temperature. Moreover, pulsed THz radiation can be coherently detected, which means time-resolved amplitude and phase information are accessible for spectroscopy and THz time-of-flight (THz-ToF) evaluations [12]. The ToF analysis allows determining the temperature directly at the interface between an aqueous system and its vessel if the vessel is made of a non-metallic low THz absorbing material such as plastic. THz radiation can penetrate, for example, polymers, as they consist of non-polar molecules that do not feature a permanent dipole moment to which THz radiation could couple to.
In this thesis, a novel method has been devised (chapter 2), which combines spatial and time-resolved information of pulses at THz frequencies to quantify the PCE of NP dispersions in vessels without the need for stirring. The technique harnesses various intrinsic physical parameters of pulsed THz radiation, such as amplitude, frequency, ToF, as well as spatial information for the accurate determination of the PCE of NPs in aqueous dispersions. As a well-studied reference to corroborate the novel method, rod-shaped gold NPs, so-called gold nanorods (GNRs), were used as a benchmark test. Among many applications, GNRs have been used for photothermal conversion-based biomedical therapies [13], due to their chemical inertness and well-known synthesis recipe. This recipe enables the GNRs to be produced reliably in size- and morphological uniformity, with high extinction cross-section, and tunable longitudinal localized surface plasmon resonance (LSPR) in the near-infrared (NIR). In this wavelength range, light can penetrate deeply in biological tissue.
Three different GNR volumes were investigated, having the same longitudinal LSPR peak and approximately the same aspect ratio, but different dimensions. Both experimental measurements and theoretical simulations were used to elucidate the effect of the GNR volume on the PCE. The novel method devised in this thesis and its capabilities can be extended to other situations in which temperature modifies the refractive index of aqueous systems, including tissue water in the
skin. As a proof of concept, the temperature-induced changes in a multilayer biological model system containing a high water content were studied by using THz light (chapter 3). Specifically, a new and promising medical procedure named “laser-assisted tissue soldering” [14] was used, wherein contrast to conventional sutures, a NP containing solder gel aids the approximation of incision edges. Because this laser tissue bonding method is a non-contact and non-mechanical technique, it is ideally suited for surgeries where suturing and stapling is hard or even impossible to apply, for example, in endoscopic and laparoscopic procedures. This procedure’s side effect is localized thermal damage that is inflicted on the tissue surrounding the incision due to the intense laser radiation. This thermal damage forms a multilayer structure inside the tissue with different refractive indices. The evolution of the thermal damage during the soldering procedure was monitored employing a THz radiation source, while its spatial distribution was mapped to unveil the extent of the surface and subsurface structural changes within the tissue. The experimental results were complemented by theoretical simulations of the temperature dynamics inside the tissue showing the extent of the photothermal damage incurred by the laser heating procedure. The new method has the potential to be employed in medical procedures like photothermal therapy (PTT) to monitor the treated tissue in order to minimize or even prevent further thermal damage. Therefore, the new method could be an essential factor in making these promising medical treatments more relevant in clinical applications.
1.2 Scope of the Thesis
This thesis covers several disciplines and comprises investigations combining multiple fields of ongoing research. The goal herein is to exploit recently developed pulsed laser sources operating at THz frequencies in conjunction with nanoscale materials to both alter, as well as accurately map, the temperature within the framework of a wide range of water-based systems. The results can be used to glean more information about the properties of nanoscale materials under laser illumination, as well as to quantify heat dissipation, even in biological contexts where the temperature changes in water and tissue play a key role.
The introductory chapter gives a theoretical background and the state-of-the-art of all relevant topics within this thesis. The THz related subjects are described in subchapter 1.3, including the characteristics of THz radiation, its generation and detection via photoconductive antennas (PCAs), as well as terahertz time-domain-spectroscopy (THz-TDS) as a coherent detection technique, which can retrieve the amplitude and phase information of THz radiation resolved in time. Additionally, the concept of THz-ToF and its application for THz tomography is presented,
concentrating on state-of-the-art THz biomedical imaging. Within this context, plasmonic gold NPs will be discussed in subchapter 1.4, with a focus on GNRs. The phenomenon of LSPR is described, and the concept of PCE, as well as existing methods for its quantification, will be introduced. Moreover, a new medical treatment procedure for wound closure is presented, which is based on NP-assisted laser tissue soldering.
Thus far, it is still challenging to precisely determine the PCE of plasmonic NPs in a convenient, and reliable way, in order to identify the most efficient NP composition and morphology for laser-based localized heating applications, such as PTT. Therefore, a new method for the non-invasive, non-contact, and non-destructive characterization of the photothermal effect of plasmonic NPs within aqueous dispersions utilizing pulsed THz radiation is introduced in Chapter 2.
First, subchapter 2.1 describes the THz setup that I built and deployed to perform all experiments in this thesis. Then, subchapter 2.2 explains the algorithms that I applied to post-process the experimental data. These algorithms, namely sparse and THz frequency-wavelet domain deconvolution (FWDD), as well as self-referencing, were recently developed and optimized to post-process THz signals. Moreover, subchapter 2.3 introduces a theoretical model that I applied to calculate the PCE and molar heating rate (MHR) based on the recordings of the heating and cooling cycles. Then, I fully characterized and experimentally determined the PCE and MHR of three standard gold nanorod (GNR) dispersions as a benchmark test for the new method (subchapters 2.4-2.6). Moreover, the fidelity of the achieved results was corroborated by carrying out numerical simulations that were performed in collaboration with Prof. Alexander O. Govorov (Ohio University). Notably, the proposed technique can be extended to the characterization of any nanomaterial that features a temperature-dependent change of its refractive index in the THz regime.
Additionally, I studied three differently capped but equally sized copper sulfide (CuS) NPs, dispersed in aqueous solutions by using THz-TDS (subchapter 2.7). The time-resolved thermal measurements compared their photothermal heating performance. The CuS NPs were synthesized by the group of Prof. Fiorenzo Vetrone (INRS-EMT). In this study, I characterized the NPs, designed, and built the THz setup and sample vessels, performed the experiment, as well as analyzed the experimental data.
Due to an increased demand for tunable lasers to excite NPs in the second biological window (1000 nm to 1350 nm), this thesis presents in subchapter 2.8 a method to optimize the parametric gain of optical parametric amplifiers (OPA) by performing a quasi-phase-matched wavelength conversion based on a three-wave mixing (TWM) process in a lithium triborate (LBO) nonlinear
crystal. The presented method optimizes the conversion efficiency and bandwidth of standard OPA systems and could be used, for example, for time-resolved pump-probe experiments involving THz sources based on organic crystals as well as the photoexcitation of NP samples in the second biological window. My contribution to this study lies in its experimental realization by building the setup, aligning, and operating it.
In chapter 3, I applied the THz-TDS method to a multilayer biological model system to investigate a NP-assisted laser tissue interaction process in real-time and in depth. A theoretical simulation was performed in collaboration with the group of Prof. Alexander O. Govorov (Ohio University), predicting the temperature increase in the laser illumination area and estimating the photothermal damage incurred to the skin tissue (subchapter 3.1). I experimentally showed that THz-TDS is a versatile tool to reveal the photothermal damage during the process of NP-assisted laser tissue soldering for wound closures (subchapter 3.2). Specifically, I designed and built the THz-TDS setup, prepared the skin samples and solder gel, and performed the soldering as well as experimental measurements. Besides, I traced the photothermal damage evolution by THz-TDS and subsequently evaluated the experimental data by using a deconvolution algorithm that was also recently adapted for THz signal post-processing. Moreover, I performed the experimental work to image the extent of the photothermal damage in three dimensions (subchapter 3.3) within the skin tissue by using a raster-scan imaging modality that I designed and constructed.
The non-ionizing photon energy level renders THz radiation a suitable diagnostic tool for in vivo imaging of laser-assisted incision soldering. The new method can enable clinicians to receive instant feedback regarding the photothermal damage inside the tissue while performing the medical procedures. The approach can be easily extended and applied across a broad range of clinical applications involving laser tissue interaction, like laser ablation and photothermal therapies. Consequently, the presented method can complement and even extend conventional skin imaging methods, which currently lack imaging contrast and resolution in depth.
In all experiments, I designed, built, aligned, and operated the THz setups as well as prepared the samples, vessels, and holders. The research directions and outcomes were discussed with my supervisors and the co-authors of the respective publications.
1.3 Terahertz Radiation
THz radiation covers the electromagnetic spectrum from 0.1x10¹² to 10x1012 Hz, corresponding to a wavelength range of 3 mm to 30 µm, which positions it between the IR and microwave frequency regimes (Figure 1.1).
Dielectric non-polar materials, such as fabric, paper, and plastic, which are opaque to visible and NIR waves, are transparent in the THz frequency range. This property enables non-contact and non-invasive sensing under obstructed conditions, including measurements inside of enclosures and vessels made of these materials. Due to this property, THz radiation can have a high-impact in applications ranging from biomedicine to sensing, for example, under medical gauzes, inside of cuvettes or capillaries, as well as microfluidic lab-on-chip devices [15].
Figure 1.1: Electromagnetic spectrum highlighting the THz frequency section. (adapted from the National Institute of Information and Communications Technology (NICT))
THz radiation exhibits strong absorption by polar molecules, such as water. Therefore, it is highly sensitive to the humidity of the environment and the hydration level of samples, such as biological tissue [16]. This unique property is heavily used for biomedical applications to, for example, accurately discriminate between healthy and cancerous tissue as well as for burn wound evaluations [17] due to the different or changing water content [18]. Moreover, aqueous solutions experience a significant temperature-dependent refractive index and absorption coefficient change in the THz regime (Figure 1.2), which in turn enables accurate temperature determination. This fundamental principle was used to develop a new method for the photothermal characterization of NPs, as described in chapter 2.
THz radiation has non-invasive and non-ionizing properties due to its low photon energy (0.4 meV to 40 meV) that ensures the physicochemical integrity of a sample without influencing the measurement. These properties make THz waves suitable for medical imaging since its non-invasive nature can be utilized for in vivo real-time diagnosis without causing ionization damage, unlike X-rays, for example. Moreover, scattering losses of THz radiation in biological tissue are negligible due to its long wavelength, which is in contrast to visible and IR light [19].
The photon energy of THz radiation coincides with the energy levels of low-frequency motions, such as the vibration, rotation, and translation of various molecules [12]. These motions are
molecule-specific and allow to identify materials, especially biomolecules, by measuring their characteristic spectral signatures in the THz frequency range. Additionally, THz radiation can reveal time-resolved dynamics on a sub-picosecond to picosecond temporal resolution to, for example, monitor the dynamics of transient photoconductivity in semiconductors [20]. Many industries exploit the described merits of THz radiation for numerous applications, such as non-destructive quality control [21], security [11], spectroscopy, and imaging [22]. Since THz radiation is harmless to biological tissue, much research attention has been directed [23] towards high impact applications in biomedicine and biochemical sensing [19], [24].
Figure 1.2: Temperature-dependent (a) refractive index and (b) absorption coefficient of water in the THz frequency regime. (Figure adapted from references [25], [26])
1.3.1 THz Generation by using Photoconductive Antennas (PCAs)
Several methods can be deployed for the generation and detection of THz pulses featuring a broad bandwidth. The most widespread generation techniques are transient photo-induced currents in PCAs and optical rectification in second-order nonlinear media [27], [28], whereas, for detection, photoconductive sampling [29]–[34] and electro-optic sampling [35], [36] are typically employed. In our case, a THz system, based on PCAs as a THz transmitter and detector, was used to perform the studies described in chapters 2 and 3 of this thesis. Therefore, the fundamental mechanism of PCAs is explained in detail hereafter.
A PCA consists of two metal electrodes that can have various geometries (e.g., a bow-tie, strip-line, or simply Hertzian dipole). The electrodes are deposited over a semiconductor substrate, which is commonly made of low-temperature grown gallium arsenide (LT-GaAs) due to its bandgap around 1.45 eV or 850 nm wavelength. This wavelength is well matched to excitation pump lasers that emit femtosecond pulses such as Ti:sapphire laser systems (radiating at a
center wavelength around 800 nm) or wavelength-duplicated (via second harmonic generation) erbium-doped fiber lasers (emitting at a center wavelength of 1550 nm). A PCA is a fast “optically-activated” switch utilizing the rise in electrical conductivity of semiconductors when they are exposed to light. This photoconductivity is caused by a surge in the number of free charge carriers (electrons and holes) created by the absorbed photons [37]. The working principle of PCAs is that first, a direct (DC) voltage is applied across the two electrodes, and since the substrate is semi-insulating, electric energy is stored in the gap area.
Femtosecond long laser pulses focused into the gap between the two electrodes act like transient switches (Figure 1.3(a)) and create electron-hole pairs in the semiconductor, which open a reservoir of electric energy (Figure 1.3(b)). The static bias field across the gap accelerates the free photo-generated charge carriers and produces a transient photocurrent, which is described as [12], [37]:
𝐽(𝑡) = 𝑁(𝑡)𝑒𝜇𝐸b 1.1
where 𝑁is the density of photocarriers, 𝑒denotes the elementary charge, 𝜇is the mobility of the carriers, 𝑡represents the time, and 𝐸bis the bias electric field.
(a) (b)
Figure 1.3: Schematic representation of (a) The working principle of a photoconductive switch in which a photocurrent flows through the circuit when light generates free electrons and holes. (Figure adapted from reference [37]). (b) A PCA biased with a DC voltage and illuminated by a femtosecond laser pulse generates sub-picosecond THz transients. (Figure adapted from reference [38])
The photocurrent, arising from the acceleration and decay of free carriers, is the source of the sub-picosecond THz pulses, whose electric field is the derivative of the time-variant photocurrent and can be described by:
𝐸THz= 1 4𝜋𝜀0 𝐴 𝑐2𝑧 𝜕𝐽(𝑡) 𝜕𝑡 1.2 𝐸THz= 𝐴𝑒 4𝜋𝜀0𝑐2𝑧 𝜕𝑁(𝑡) 𝜕𝑡 𝜇𝐸b 1.3
where 𝐴 is the area in the gap between the two electrodes illuminated by the laser light, 𝜀0 is the vacuum permittivity, 𝑐 is the speed of light, and 𝑧 is the penetration of the laser pulse into the semiconductor.
The recombination of the electron-hole pairs causes a subsequent decrease in photocurrent on a picosecond timescale that depends on the semiconductor carrier lifetime, which is around 100 fs for LT-GaAs [39]. The photo-carrier density declines primarily due to carrier trapping in defect sites. Therefore, the first half-cycle of the THz electric field is mostly governed by the pulse duration of the optical pulse, whereas the second half-cycle is affected by the electron recombination time of the semiconductor material. Thus, to achieve broadband THz pulses, a short recombination time in the semiconductor is required together with a short femtosecond laser pulse. The polarization of the radiated THz wave is parallel to the bias field, which is perpendicular to the two electrodes. Usually, THz pulses in free space are immediately guided by a high resistivity silicon lens typically attached directly to the output of the semiconductor substrate (Figure 1.4).
Figure 1.4: Illustrative example of a PCA for broadband generation and detection of THz pulses. (Figure adapted from reference [25])
The THz pulse variations occur on a picosecond time scale, which makes it impossible to measure them with electronic equipment like oscilloscopes. Thus, a common way to coherently detect such broadband THz pulses is by using PCAs as THz detectors. The underlying mechanism of THz field detection in PCAs is almost identical to that of the THz emission in PCA emitters.
The slowly varying THz electric field can be considered when compared to the optical pulse as constant over the time duration of an optical pulse cycle. This allows measuring the THz electric field using the ultrafast probe laser, assuming that the carrier creation and recombination are much faster than the slowly varying THz electric field. Thereby, the impinging THz electric field acts as a bias field and, thus, drives a current in the photoconductive gap between the two
electrodes when photocarriers are created by the optical probe pulse (Figure 1.5) [37]. The THz field induced current 𝐽̅ in a first approximation can be calculated as:
𝐽̅(𝜏) = 𝑁̅𝑒𝜇𝐸(𝜏) 1.4
where 𝑁̅represents the average electron density, 𝐸(𝜏) denotes the amplitude of the THz electric field at time delay 𝜏 between the probe and the THz pulse. The induced current is proportional to the THz field amplitude. The full THz transient can be reconstructed as a function of 𝜏 by varying the optical temporal delay between the THz pulse and the probe beam. The THz power typically emitted is below 1 µW; thus, the measurement is non-invasive since there is no thermal strain on samples.
(a) (b)
Figure 1.5: (a) Schematic diagram for a time-resolved measurement of THz electric fields by using a PCA receiver. (b) The side view of a PCA shows a high resistivity silicon lens attached in front of the semiconductor chip to strongly focus the incident THz radiation into the gap between the two electrodes. (Figures adapted from reference [37])
1.3.2 THz Time-Domain Spectroscopy (THz-TDS)
THz-TDS is based on pulsed THz radiation generated, for example, by using PCAs. It has been used for numerous applications, including THz imaging, which is described in more detail in subchapter 1.3.3. Figure 1.6(a)-(b) shows the basic experimental THz-TDS setup for THz generation and detection based on PCAs in transmission and reflection configuration.
A beam splitter splits pulses from a femtosecond laser. One portion, which is referred to as “pump beam,” is directed towards the THz emitter to generate THz pulses. The generated THz beam is collimated either by off-axis parabolic mirrors or polymer lenses and sent to the sample. Depending on the design of the setup, either in transmission (Figure 1.6(a)) or reflection (Figure
1.6(b)) configuration, the transmitted or reflected THz radiation is guided towards and focused on a THz receiver.
A beam splitter splits pulses from a femtosecond laser. One portion, which is referred to as “pump beam,” is directed towards the THz emitter to generate THz pulses. The generated THz beam is collimated either by off-axis parabolic mirrors or polymer lenses and sent to the sample. Depending on the design of the setup, either in transmission (Figure 1.6(a)) or reflection (Figure 1.6(b)) configuration, the transmitted or reflected THz radiation is guided towards and focused on a THz receiver.
Figure 1.6: THz time-domain spectroscopy setups based on PCAs in (a) transmission and (b) reflection configuration. Femtosecond long pulses emanated from a laser system are split at a beam splitter and guided to the THz transmitter and receiver. The probe pulse beam is optically delayed by a translation stage to alter its arrival time with respect to the THz pulse beam at the THz receiver.
The other portion of the femtosecond pulse beam referred to as “probe beam” travels through a variable time delay, before being focused on the THz receiver. By varying the time delay and recording the detector value according to this delay, it is possible to trace the THz electric field coherently as a function of time. Thus, the measurement records not only amplitude but also phase information of the THz pulse that can subsequently be used to compute spectral information by using Fourier transformation. An example of a THz transient and its spectrum is shown in Figure 1.7.
In order to enhance the signal-to-noise (SNR) ratio, the signal is processed by a lock-in amplifier synchronized with an optical intensity modulator, such as an optical chopper or the bias voltage of the PCA emitter modulated by a square wave generator [12], [37].
A sample introduced into the THz beam path either in transmission or reflection geometry affects both the phase and amplitude of THz pulses. By comparing the THz pulses with and without a sample present in the setup, it is possible to characterize the sample and obtain its THz absorption spectrum and dispersion properties. Thus, coherent detection permits a complete
characterization of the optical properties of the sample, i.e., its complex dielectric function [40], [41]. This coherent detection technique of broadband THz pulses is called THz-TDS.
Figure 1.7: a) Representative reference THz transient and its b) spectrum of the THz time-domain spectroscopy system used to perform the experiments in chapters 2 and 3.
1.3.3 THz Imaging
THz-TDS, in combination with a raster-scan imaging technique enabled by an X-Y translation stage, can perform two- and three-dimensional THz imaging. Figure 1.8 plots a THz trace and its spectrum highlighting specific parameters, for example, amplitude, phase, or spectral features. Spatial differences in these parameters are used to confer contrast in two-dimensional THz images pixel by pixel using transmitted or reflected THz beams.
Figure 1.8: (a) THz transient in the time-domain and its Fourier transformation in the (b) frequency domain. The plots highlight specific features, which can be chosen to generate contrast in order to construct a two-dimensional THz image pixel by pixel. (Figures adapted from reference [42])
This imaging method is limited by a slow image acquisition rate, which is not suitable for many applications, such as for biomedical imaging, when the sample is deteriorating quickly. Due to the single-point raster scan technique, the image acquisition rate depends on the size of the image and its resolution.

![Figure 1.11: 0.1 THz transmission image of a computer bag containing two guns (Figures adapted from reference [42])](https://thumb-eu.123doks.com/thumbv2/123doknet/5002825.124460/43.918.129.789.209.424/figure-transmission-image-computer-containing-figures-adapted-reference.webp)


![Figure 1.24: Experimental setup for measuring the temperature profile of gold NP solutions: (a) by using a thermocouple (Figure adapted from reference [8])](https://thumb-eu.123doks.com/thumbv2/123doknet/5002825.124460/54.918.123.800.599.897/figure-experimental-measuring-temperature-profile-solutions-thermocouple-reference.webp)