HAL Id: pastel-00939232
https://pastel.archives-ouvertes.fr/pastel-00939232
Submitted on 30 Jan 2014HAL is a multi-disciplinary open access archive for the deposit and dissemination of sci-entific research documents, whether they are pub-lished or not. The documents may come from teaching and research institutions in France or abroad, or from public or private research centers.
L’archive ouverte pluridisciplinaire HAL, est destinée au dépôt et à la diffusion de documents scientifiques de niveau recherche, publiés ou non, émanant des établissements d’enseignement et de recherche français ou étrangers, des laboratoires publics ou privés.
under ionizing irradiation
V. Pukhkaya
To cite this version:
V. Pukhkaya. Influence of Yb3+ and Er3+ ions environment on the evolution of its’ luminescent properties in oxide glasses under ionizing irradiation. Materials Science [cond-mat.mtrl-sci]. Ecole Polytechnique X, 2013. English. �pastel-00939232�
Thèse
pour l’obtention du grade de Docteur de l’Ecole Polytechnique
Influence of Yb
3+
and Er
3+
ions environment
on the evolution of its’ luminescent properties
in oxide glasses under ionizing irradiation
par
Vera Pukhkaya
Soutenue le 29 novembre 2013 Nadège Ollier Sylvain Girard Jean-Luc Adam Thierry Gacoin André Monteil Simonpietro Agnello Philippe Goldner Directrice de thèse Rapporteur Rapporteur Examinateur Examinateur Examinateur InvitéTout d'abord je tiens remercier ma directrice de thèse Nadège Ollier. C'est elle qui a apporté les plus belles choses dans mon travail scientifique et dans ce manuscrit. Merci Nadège pour accepter ma candidature à la thèse. Merci pour me supporter dans mes essais au cours de cette recherche. Merci aussi pour m’encourager apprendre français.
Je remercie mes rapporteurs Sylvain Girard et Jean-Luc Adam pour s’engager évaluer ce manuscrit. Je remercier ainsi tous les membres de jury. J’étais heureuse vous tous voir et vous parler à ma soutenance de thèse. Vos commentaires et remarques étaient intéressants et précis.
Enfin je dis grand merci à Philippe Goldner et Alban Ferrier. Votre apport dans ce travail est considérable. Merci pour votre aide dans l’étude de luminescence des terres rares. Merci pour votre accueil chaleureux dans votre labo durant mes visites.
Je remercie toute l’équipe d’accélérateur SIRIUS pour des irradiations aux électrons. Notamment Vincent Métayer, Bruno Boizot, Thierry Pouthier et Gaultier Brysbaert. Je vous tous remercie pour votre travail avec moi, pour votre sens d’humeur et pour la résolution des problèmes au SIRIUS.
Merci à Ludovic Bellot-Gurlet pour son aide à la spectroscopie Raman et Thibault Charpentier pour la Résonance Magnétique Nucléaire. J’étais heureuse apprendre des nouvelles techniques.
Pour gamma-irradiations je dis merci à Arbi Mejri et François Trompier. La collaboration avec François est une de choses surprenantes dans ma thèse. Je suis très contente de se retrouver François.
Enfin je remercie beaucoup mes collègues au laboratoire et en particulier Jéléna Sjakste pour son support aux moments durs dans mon travail.
Le dernier mais le plus important dans toute l’idée de mon travail en France. Merci Vitaly pour être d’accord venir ici. Merci pour ton aide, c’est inestimable. Il n’y a pas de mots français ni russes pour te dire ce que je sens. Merci.
I.
Introduction 1
II.
Sample preparation and experimental methods
71. Glass synthesis and glass compositions 7
1. a. Aluminosilicate glasses ... 7 1. b. Phosphate glasses ... 9 2. Irradiation conditions 10 2. a. Electron irradiation ... 10 2. b. Gamma irradiation ... 11 3. EPR spectroscopy 13 3. a. Theoretical aspects ... 13 3. a. 1 Zeeman effect ... 13 3. a. 2 Relaxation times ... 14 3. a. 3 g-factor ... 15
3. a. 4 Constants of hyperfine structure... 16
3. b. Experimental aspects ... 17
4. b. 1 EPR spectrometer principle ... 17
4. b. 2 Parameters used for point defects study ... 18
4. b. 3 Parameters used for Yb3+ ions study ... 21
4. Optical measurements 24
4. a. IR-luminescence of Yb3+ ... 24
4. b. Cooperative luminescence of Yb3+ (CL) ... 26
4. c. Absorption ... 28
4. d. Photoluminescence of defects (LSI) 30
III.
Yb-doped Na-aluminosilicate glasses
38
1. Glass structure 38
1. a. Bibliographic part ... 38
1. b. AS22-AS26 glass structure... 41
1. d. 2 EPR spectroscopy ... 47 1. d. 3 Cooperative luminescence ... 49 1. d. 4 AS24_Ybx glasses ... 51 Raman spectroscopy 51 Cooperative luminescence 52 2. Point defects 53
2. a. Paramagnetic defects assignation ... 53
2. a. 1 E’-centers ... 53
2. a. 2 Peroxy radicals ... 54
2. a. 3 Non-Bridging Oxygen Hole Centers (NBOHC) ... 54
2. a. 4 HC defects ... 54
2. a. 5 Al-OHC defects ... 56
2. b. Formation of paramagnetic defects in AS22-AS26 glasses ... 56
2. b. 1 Influence of glass composition ... 56
2. b. 2 Influence of Yb-doping ... 58
2. c. Relaxation of paramagnetic defects ... 60
2. c. 1 Analysis of relaxation curves ... 62
2. c. 2 Recovery of individual defect type ... 64
2. d. Effect of irradiation dose and dose rate ... 65
2. d. 1 Total amounts of defects ... 65
2. d. 2 Relative amounts of defects ... 69
3. Luminescent properties of Yb3+ 73
3. a. Cooperative luminescence (CL) ... 73
3. a. 1 CL in AS glasses with high content of Yb clusters ... 73
3. a. 2 CL in AS glasses with less content of Yb clusters ... 76
3. b. Lifetime of Yb3+ 2F5/2 excited state measurements... 76
3. b. 1 Before irradiation ... 77
3. b. 2 Dose and dose rate effects ... 77
3. c. Analysis of the role of defects in CL and lifetime evolution under the irradiation ... 82
3. c. 1 Post-irradiation evolution in time ... 82
3. c. 2 Annealing treatments ... 83
4. Conclusions 89
IV. Phosphate glasses
981. Structure of phosphate glasses ... 98
1. a. Bibliographic part ... 98
1. b. Analysis by Raman spectroscopy ... 100
2. Structure of P-related point defects (bibliography part) ... 102
2. a. POHC defects ... 102 r-POHC ... 102 l-POHC ... 103 2. b. P1 defects (PO32-) ... 103 2. c. P2 defects (PO44-) ... 104 2. a. P3 defect ... 104 2. a. P4 defect (PO22-) ... 104
3. Analysis of paramagnetic point defects formed under ionizing irradiation 105 3. a. Formation of paramagnetic defects ... 105
3. a. 1 Hole centers ... 105
3. a. 2 P centers ... 106
3. b. Relaxation of paramagnetic defects ... 108
3. b. 1 Relaxation of hole centers ... 108
3. b. 2 Relaxation of P centers ... 111
3. c. Dose and dose rate effect ... 113
3. c. 1 Dose effect ... 113
3. c. 2 Dose rate effect ... 118
4. Diamagnetic defect ... 121
4. a. Attribution of the defect ... 121
4. b. The diamagnetic defect in irradiated glasses ... 122
5. The lifetime of 2F 5/2 excited state evolution under e¯ -irradiation ... 125
5. a. Dose and dose rate effect ... 125
5. b. Relation with point defects ... 127
5. b. 1 Evolution in time ... 127
V.
Yb/ Er- and Er-doped AS glasses ... 137
1. Spectroscopy of Er3+ ... 137
1. a. Transitions of Er3+ ion in IR-region ... 137
1. b. Up-conversion ... 138
1. c. Yb → Er energy transfer ... 139
1. d. Experimental details ... 140
1. e. The samples ... 142
2. Link between the Er3+ environment and its luminescent properties ... ... 141
2. a. The samples ... 141
2. b. Characterization of Er3+ environment by EPR spectroscopy ... 141
2. b. 1 Er-doped glasses ... 141 2. b. 2 Yb/Er-codoped glasses ... 143 2. c. Er-doped glasses ... 144 2. c. 1 IR-luminescence ... 144 2. c. 2 Up-conversion process ... 145 2. d. Yb/Er-codoped glasses ... 146 2. d. 1 IR-luminescence ... 146 2. d. 2 Up-conversion ... 147
3. Effect of irradiation on Er3+ luminescent properties... 149
3. a. Er3+ lifetime τIR ... 149
3. b. Er3+ luminescence in Yb/Er-codoped glasses ... 151
3. c. Up-conversion ... 152
4. Conclusions ... 154
VI. Conclusions and Perspectives 158
VII. Appendix 162
1
I.
Introduction
The glass materials are used widely in many optical applications. The silica glass SiO2 is an attractive matrix for producing the optical fibers, lenses (telescopes). It is used in semiconductor industry and in photolithography due to its high transparency (nD = 1,4584) and chemical durability. Incorporation of alkali ions drives it easier to synthesize the glass because of lower melting temperature. Alkali-aluminosilicate glasses are even more rigid than alkali-silicates and they are used in various optical applications.
Phosphate glasses are based on phosphorus pentoxide (P2O5), usually with some added chemical components. They are used as laser gain media – both in bulk lasers and in the optical fibers. Phosphate glasses have a very low glass transition temperature (≈ 365 °C). That makes easier producing the devices based on phosphate glasses. Phosphate glasses exhibit a much lower optical damage threshold than silica glasses. Moreover, their primary advantages are the favorable transition cross sections and upper-state lifetimes of rare earth ions in phosphate glasses. The very high solubility of rare earth ions (erbium (Er3+), ytterbium (Yb3+)) is well known. This means that higher concentrations of laser-active rare earth ions can be incorporated into phosphate glasses without harmful effects such as clustering, which could degrade the performance of the glass via quenching effects.
Yb-containing glasses are implied efficiently in fiber lasers production where Yb3+ ion is used as a dopant. In fiber lasers emitting at ~1.06-1.07 µm and in amplifiers (Yb/Er-codoping) the simplicity of Yb3+ energy levels structure is attractive. It is represented with only 2 energy levels 2F
5/2 and 2F7/2 separated by 10000 cm-1 energy. This advantage is one of the reasons for achieving significant powers in IR-lasers [1].
For many optical applications of Yb3+, with Yb concentration increase one should expect the increase of positive features such as Yb-laser’s power. This is not the case; the doping content of Yb3+ ions is strongly limited by Yb-cluster formation, which is observed as concentration quenching. The doping concentration of Yb3+ in silica-based matrices maintains in range of 1-1000 ppm because of higher tendency of Yb clusters formation [2].
Studying the behavior of aluminosilicate (AS) or phosphate glasses doped with Yb under ionizing irradiation is attractive for different fields.
2 The aluminosilicate Yb-doped glasses under fibers form are exposed to ionizing irradiation while being used in space for satellite communication (doses ~103 Gy). Among the applications of irradiated phosphate glasses is their participation in vitrification process of radioactive waste in long-term storage [7]. Moreover, phosphate glasses are applied as dosimeters due to its sensitive response to low dose irradiation [8].
The irradiation can have a strong impact on luminescent properties of Rare-Earth Elements (REE) in oxide glasses via radiation-induced point defects whereas the REE doping brings some particular modifications into electronic structure of irradiated glass [9] [10] [11] [12]. In my Ph.D. the central question is around the role of cluster in the glass evolution under irradiation. It is thus essential to understand the way of charge trapping by well-diluted Yb3+ ions and those in clusters and their interactions with point defects, to predict the response of Yb3+ luminescent properties under ionizing irradiation treatment.
In present work, the characterization of the effect of Yb3+ environment under irradiation in oxide glass matrices on the evolution of luminescent properties is aimed. In order to compare role of glass chemical composition, 4 different aluminosilicate (AS) and 4 phosphate glasses were chosen. The cluster formation in those AS and phosphate glasses was carefully studied by B. Schaudel in her Ph.D. dissertation [13]. In AS glasses increasing of Al content (decreasing of Non-Bridging Oxygens number) leads to more Yb cluster formation whereas in phosphate glasses there is less Yb cluster due to structural difference between PO4 and SiO4 tetrahedra. In phosphate PO4 group on Oxygen is always Non-Bridging leading to better dissolution of RE3+ ions in phosphate matrices.
One of the direct probes of Yb cluster can be cooperative luminescence of Yb3+ [3] [4]. It is observed as Yb3+ emission in 450-580 nm region under 970-980 nm excitation. Electronic Paramagnetic Resonance (EPR) of RE3+ ions is used as a probe of Yb clusters, too [5] [6]. Yb cluster exhibits its characteristic signal at higher g-values than isolated Yb3+ ions [5].
Our purpose is to compare these glasses in terms of irradiation effects. To follow that, irradiation with electrons of 2.5 MeV (SIRIUS facility, LSI) was carried out in vast achieved dose variation (105-2·109 Gy). Moreover, the question of dose rate cannot be neglected, and thus electron irradiation was in comparison with γ-rays in possible dose range. Investigation of radiation-induced point defects in glasses, their evolution within time and temperature and their correlations with
3 luminescent properties of Yb3+ ions under the conditions mentioned above is the general approach in this work.
The work is presented in 6 chapters including Introduction (Chapter I) and Conclusions (Chapter VI). In the second chapter, experimental details can be found: the synthesis and precised chemical compositions of the samples are given. They are followed by the irradiation conditions. The basic principles and experimental details of EPR spectroscopy and optical spectroscopy, used in this work, complete the Chapter II.
The third chapter reports the results obtained for the Yb-doped AS glasses. The aluminosilicate glass structure is presented. The point defects are analyzed as a function of irradiation dose, dose rate and glass composition. Moreover, we will analyze the evolution of radiation-induced point defects and Yb3+ luminescence properties in time after irradiation. Finally, the particular relations between the defects and Yb3+ luminescence are discussed.
In the forth chapter, Yb-doped phosphate glasses are examined. A big part of the chapter concerns the attribution and characterization of point defects.
The fifth chapter is shorter and dedicated to Er- and Yb/Er-doped AS glasses. The Er and Yb/Er glasses are associated with its wide application in the optical field. Er-doped glasses are used in telecommunications as Er-doped amplifiers, optical fibers and lasers [14] due to its 1.54 µm emission, but up-conversion process is harmful for the applications where high efficient 1.54 µm emission required [15].
This study was carried out at the end of my Ph.D. period and consists more on preliminary results. The aim was to extract more information on Yb3+ local environment by comparing with Er3+. The main used distinction between Yb and Er is the absence of divalent state of Er contrary to Yb. Nevertheless, as we have obtained a few interesting result on the link between the glass structure and luminescent properties and the evolution under irradiation, we decided to add this small chapter.
4 [1] G. Liu et B. Jacquier, Spectroscopic Properties of Rare Earths in Optical
Materials, New York: Springer Series in Materials Science, 2005.
[2] B. Schaudel, P. Goldner, M. Prassas et F. Auzel, J. Alloys and Comp., vol. 300, p. 443, 2000.
[3] F. Auzel et P. Goldner, Opt. Mater., vol. 16, p. 93, 2001.
[4] E. Nakazawa et S. Shionoya, Phys. Rev. Lett., vol. 25, p. 1710, 1970.
[5] S. Sen, R. Rakhmatullin, R. Gubaidullin et A. Pöppl, Phys. Rev. B, vol. 74, p. 100201, 2006.
[6] T. Deschamps, N. Ollier, H. Vézin et C. Gonnet, J. Chem. Phys., vol. 136, p. 01453, 2012.
[7] M. I. Ojovan et W. E. Lee, Met. Mater. Transactions A, vol. 42, p. 837, 2011. [8] N. Z. Andreeva, N. N. Vil'chinskaya, A. V. Dmitryuk, A. S. Perminov, G. T.
Petrovskii et O. C. Savvina, Atom. Energiya, vol. 58, p. 132, 1985.
[9] A. V. Amossov et A. O. Rybaltovsky, J. Non-Cryst. Solids, vol. 179, p. 75, 1994. [10] L. Skuja, J. Non-Cryst. Solids, vol. 239, p. 16, 1998.
[11] E. Malchukova, B. Boizot, G. Petite et D. Ghaleb, J. Non-Cryst. Solids, vol. 354, p. 3592, 2008.
[12] N. Ollier, J.-L. Doulan, V. Pukhkaya, T. Charpentier, R. Moncorgé et S. Sen, J.
Non-Cryst. Solids, vol. 357, p. 1037, 2011.
[13] B. Schaudel, Ph.D. dissertation, Paris: Université Paris VI, 2000. [14] M. Van Uffelen, S. Girard, F. Goutaland, A. Gusarov, B. Brichard et F.
Berghmans, IEEE Trans. Nucl. Sci., vol. 51, p. 2763, 2004.
[15] J. F. Philipps, T. Töpfer, H. Ebendorff-Heidenpriem, D. Ehrt et R. Sauerbrey,
Chapter II
Sample preparation and
experimental methods
6
II. Sample preparation and experimental methods ... 7
1. Glass synthesis and glass compositions ... 7
1. a. Aluminosilicate glasses ... 7 1. b. Phosphate glasses ... 9 2. Irradiation conditions ... 10 2. a. Electron irradiation ... 10 2. b. Gamma-irradiation ... 11 3. EPR spectroscopy ... 13 3. a. Theoretical aspects ... 13 3. a. 1 Zeeman effect... 13
3. a. 2 Relaxation times and EPR line’s shape ... 14
3. a. 3 g-factor ... 15
3. a. 4 Constants of hyperfine structure ... 16
3. b. Experimental aspects ... 17
3. b. 1 EPR spectrometer principle ... 17
3. b. 2 Parameters for point defects study ... 18
3. b. 3 Parameters for Yb3+ ions study ... 21
4. Optical measurements ... 24
4. a. IR-luminescence of Yb3+ ... 24
4. b. Cooperative luminescence of Yb3+ (CL) ... 26
4. c. Absorption ... 28
7
II.
Sample preparation and
experimental methods
Choice of Glass composition
One aim of the Ph.D. was to study the impact of Yb cluster on the defect formation and relaxation, and the evolution of Yb3+ luminescent properties under irradiation. So, we wanted to study glass samples with contrasted Yb cluster amount, but doped with same Yb content. Such aluminosilicate and phosphate glasses were carefully studied in B. Schaudel’s Ph.D. [1]. We based our choice on the chemical compositions presented by B. Schaudel [1].
Two different kinds of oxide glasses were studied: aluminosilicate (Chapter III) and phosphate (Chapter IV). Finally, four aluminosilicate glass compositions with different Al content and four phosphate glasses with different P content were chosen. For more facility, same sample names than in [1] were used.
Concerning Er- and Yb/Er-codoped samples (Chapter V), the aim was, first, to compare the behavior of Yb and Er glasses (where no Er3+ reduced to Er2+ can be found) and, secondly, to evaluate the impact of irradiation on up-conversion and Yb→Er energy transfer. The number of studied samples in this Chapter was reduced: only 2 aluminosilicate glass compositions giving contrasted results on Yb clusters were studied.
1.
Glass synthesis and glass
compositions
1. a.
Aluminosilicate glasses
Aluminosilicate (AS) glass samples were prepared with the appropriated amounts of preliminary dried powders of SiO2, Al2O3, Na2CO3 and Yb2O3 and/or Er2O3. The initial chemicals were mixed and heated slowly (10 hours) in Pt-Au crucible up to 1600°C in a furnace under air oxygen. The slow heating was necessary for decarbonization (eliminate all CO2 gas that takes place at ~800°C). Once the melting temperature 1600°C was reached, the dwell was 4 hours. Afterwards the glass was quenched rapidly at room temperature via putting the crucible into the water when the mixture’s viscosity was too high (AS23-AS26
8 glasses). Otherwise, the glass was quenched rapidly between two copper plates (AS22 glasses). All the glasses were afterwards annealed at 580°C (below Tg) that in order to allow releasing the mechanical tensions.
The nominal glass compositions are presented in Table II-1. Glass compositions were refined with microprobe analysis giving <1 mol. % of average error (Appendix 1). For Yb the average error is ~0.05 mol. %.
Sample name SiO2, mol. % Al2O3, mol. % Na2O, mol. % ASI Al/Na AS22 74 6 20 0.3 + 5 wt. % Yb2O3 AS23 68 12 20 0.6 AS24 62 18 20 0.9 AS26 58 22 20 1.1 AS22_0 74 6 20 0.3 Yb-free AS24_0 62 18 20 0.9 AS24_005 + 0.05 wt. % Yb2O3 AS24_02 + 0.2 wt. % Yb2O3 AS24_05 + 0.5 wt. % Yb2O3 AS24_1 + 1 wt. % Yb2O3 AS24_2 + 2 wt. % Yb2O3 AS24_8 + 8 wt. % Yb2O3 AS22_Er 74 6 20 0.3 + 0.5 wt. % Er2O3 AS22_YbEr 74 6 20 0.3 + 0.5 wt. % Er2O3 + 5 wt. % Yb2O3 AS24_Er 62 18 20 0.9 + 0.5 wt. % Er2O3 AS24_YbEr 62 18 20 0.9 + 0.5 wt. % Er2O3 + 5 wt. % Yb2O3 Table II-1. Nominal compositions of aluminosilicate glasses
In Table II-1 in glass series AS22-AS23-AS24-AS26, the concentration of Yb2O3 oxide is fixed. The content of SiO2 decreases with increase of Al2O3 content. The Na2O content is fixed in all the glasses at 20 mol. %. Thereafter, in AS22-AS23-AS24-AS26 glass series the ASI (Aluminum Saturation Index) varies. It characterizes molar ratio Al2O3/Na2O, it is the lowest in AS22 glass and the highest in AS26 glass.
AS24 glass composition is chosen for Yb concentration variation from 0.05 wt. % of Yb2O3 to 8 wt. % of Yb2O3. There are also 2 RE-free glasses: AS22_0 and AS24_0.
For Er-doping AS22 and AS24 glasses are chosen. In all four obtained glasses Er concentration is 0.5 wt. % of Er2O3. In Yb/Er-codoped glasses molar ratio Yb:Er is ~10:1 (9.6:1).
9
1. b.
Phosphate glasses
Phosphate glass samples were prepared with the appropriated amounts of NH4H2PO4, MgO, Na2CO3 and Yb2O3 (5 wt. %). To avoid the interactions between P2O5, forming at high temperature, with Pt-Au crucible, the initial chemicals were mixed and melted in silica crucible and then heated slowly to follow degasation processes: NH3 is evaporated at 250°C and CO2 at 800°C. The melting temperature of phosphate glasses is lower than for AS glasses, 900°C. The glass transition temperature Tg of such phosphate glasses is in 370-400°C range [2] [3]. The cooling temperature must be not seriously lower then Tg otherwise the glass becomes less stable [2]. The melted glass was quenched rapidly into Pt-Au crucible on an electric plate at 300°C and immediately annealed at 350°C to release mechanical tensions and to avoid high cooling rate. To revoke the interaction with silica crucible at high temperature, the glasses were analyzed by microprobe where it was demonstrated the absence of Si in all the samples.
The nominal glass compositions are presented in Table II-2. Sample name P2O5, mol. % MgO, mol. % Na2O, mol. %
2743 66.7 11.1 22.2 + 5 wt. % Yb2O3 2742 50 16.7 33.3 2745 45.4 18.2 36.4 2746 40 20 40 2743_0 66.7 11.1 22.2 Yb-free 2745_0 45.4 18 .2 36.4
Table II-2 . Nominal compositions of phosphate glasses
Keeping fixed concentration of Yb, phosphorus content decreases from 2743 to 2746 glass. The total amount of MgO and Na2O consequently increases. The phosphate glass structure can be described by ratio R=(MgO+Na2O)/P2O5 which varies as a function of network type. There are also 2 non-doped glasses: 2743_0 and 2745_0 samples.
The glass compositions is checked by Raman spectroscopy in Chapter IV (see section 1)
10
2.
Irradiation conditions
2. a.
Electron irradiation
The “Laboratoire des Solides Irradiés” has a high energy electron Pelletron NEC accelerator, named SIRIUS (Figure II-1). The energy of available electron is between 200 keV and 2.5 MeV. The accelerator is equipped with 2 irradiation lines, CRYO1 cell is for low temperature irradiations (20K), and CIRANO is for 16-350°C irradiations. We used CIRANO cell.
Massive glass samples (5×5 mm) were continuously irradiated with 2.5 MeV electron beam of 20 mm beam size with dose rate close to 25 MGy/h. To obtain homogeneous integrated dose, we had to take care about the sample thickness. Slices of 500-700 µm thickness were prepared in order to consider as negligible the energy loss of 2.5 MeV electrons. The sample holder was maintained around 40°C with a water cooling system by measuring 12-14 µA current at the sample (Figure II-1).
The achieved integrated doses were 105Gy, 106 Gy, 3·106Gy, 107 Gy, 108 Gy and 1.5·109Gy (Table II-3).
Unfortunately, some current instability (±20%) faced us to use precise irradiation conditions. Moreover, few interruptions took place during long-term dose collecting – >109 Gy. During the interruption time some relaxation processes should occur and thus the final result may be different. Problems of current instability and lack of proper irradiated at strong doses samples drive some difficulties into results analysis.
We have also irradiated some samples under powder form to measure the cooperative luminescence. To be precise in optical measurements, the glasses were grounded into powders of 100-125 µm particle size. For powders, the achieved integrated doses were 105 Gy, 3·106 Gy and 108 Gy.
Moreover, we irradiated slice samples with 3·106 Gy by using a 2.5 MeV electron beam of 200 nA current which gives 300 kGy/h dose rate of (2 orders of magnitude lower).
Figure II-1. SIRIUS accelerator
source where electron beam is created, photo of two
2. b.
Gamma-To investigate the effect of
well as powders were also irradiated with γ Sciences et Technologies Nucléaires
accelerator in LSI: from top to down. Photo of irradiation source where electron beam is created, photo of two irradiation cells
CIRANO and sample holder.
-irradiation
To investigate the effect of irradiation dose rate, the samples
irradiated with γ-rays of 1.25 MeV in “Centre National des Sciences et Technologies Nucléaires” in Tunisia (CNSTN). The dose rate in this case
11 : from top to down. Photo of irradiation
irradiation cells, zoom at
radiation dose rate, the samples under slices as Centre National des ose rate in this case
12 was 5.64 kGy/h. The energy of γ-rays more than 1.022 MeV implies high probability of electron-positron pair induction that can result point defect creation [4]. Comparison of electron irradiation with gamma-rays can be carried out also because of low mass of electrons. Its lower mass leads to lower losses through material penetration in comparison to other particle irradiations such as protons or α particle.
The achieved doses were 104, 105, 106 and 3·106 Gy (Table II-3). It was possible therefore to compare 3 same irradiation doses (105, 106 and 3·106 Gy) of 2 different dose rates.
Electron
Dose rate, MGy/h Beam energy, MeV Dose, Gy
25 2.5 105 106 3·106 107 108 1.5·109 Comment: Er-serie 2·109 0.3 2.5 3·106 Gamma
Dose rate, kGy/h Beam energy, MeV Dose, Gy
5.64 1.25 104
105
106
3·106 Table II-3 . Irradiation conditions
More details on the irradiated series and on irradiation conditions are given in Appendix 2.
After the irradiation the samples were stored in dark at room temperature to limit the impact of photobleaching of the paramagnetic point defects [5].
13
3.
EPR spectroscopy
3. a.
Theoretical aspects
Electronic Paramagnetic Resonance (EPR) or Electronic Spin Resonance (ESR) spectroscopy is a powerful tool of analysis of atoms, ions, molecules or elements with non-zero electron’s spin moment (e.g. with unpaired electron). Paramagnetic particles that are analyzed with EPR can be of various origins such as: free radicals in gas, liquid and solid state; point defects in materials; transition ions and rare earth element. In 1944 E. K. Zavoisky discovered this phenomenon [6]. Most of theoretical aspects presented in this section are consulted with A. Abragam and B. Bleaney [7]
3. a. 1
Zeeman effect
Without any magnetic field, all the magnetic momenta of unpaired electrons are of random direction, e.g. the system consists of degenerated energy states. Once the magnetic field B is applied (Figure II-2), the degeneracy of the system disappears (Zeeman effect) and the gap between electrons’ energy levels is
∆ =
where
1) g is Landé factor, g of free electron ge=2.0023 2) µB (Bohr magneton) is 9.274·10-24 J/T
Figure II-2. Energy levels splitting under applied magnetic field
The parameter B can also be used where the permeability of free space is µ0=1.257·10-6 H/m. The distribution of the electrons between the sublevels obeys to the Boltzmann law n1/n2=exp(-∆E/kT) with k is Boltzmann constant and T is the
14 absolute temperature. If a sample is under an alternating perpendicular magnetic field of frequency ν, it induces the transitions between the sublevels with absorption or emission of energy ∆E=hν, where
ℎ =
h=6.6262·10-34J·sec is Plank constant
3. a. 2
Relaxation times and EPR line’s shape
To maintain the Boltzmann distribution of energy levels’ populations the relaxation processes are essential. The relaxation processes are electron transitions from excited states to ground states with energy exchanges with lattice, so-called spin-lattice relaxation, and with other electrons, so-called spin-spin relaxation. The relaxation times are noted, respectively, T1 and T2. They characterize the system recovery after the magnetic field has been applied.
Intensity – the area under the absorbance curve (integral) is proportional to unpaired spin number in the sample. Therefore, the driven integrals are efficient to compare the detected paramagnetic species.
One can register usually the first, more rarely the second, derivatives of absorption that increases the sensitivity and the resolution of the spectra (Figure II-3). Sometimes, the integral Sint is estimated obeying the equation
=
(Δ
)
where ∆Bmax is line’s full width at half max. Both the first and the second derivatives are strongly sensitive to the absorbance shape.
15 The shape of the EPR line can be fitted either with Lorenz equation = or with Gauss equation = × exp (−"# ). The Lorenz’s lines are usually observed in materials with low concentration of unpaired spins. Once the line is a superposition of many other lines (unresolved hyperfine structure), it is of Gauss type.
Experimentally, the EPR lines are partly Lorentz partly Gauss types. Full with at half maximum $ is an important EPR parameter. It is in connection with both relaxation times T1 and T2
Δ
≈
1
'1
+
1
'2
The value T1 is Zeeman level population relaxation time. T1 is the constant which characterizes the decay of the z component of the magnetization vector. According to uncertainty principle, EPR line broadens at low T1. T1 value of the paramagnetic ions is of 10-7 – 10-9 s order, it is the basic relaxation channel responsible for many broad lines. In some cases, helium temperatures allow carrying out EPR spectra due to higher T1 (Rare-Earth Elements). When the lifetime T1 is high(~10-6 s), the parameter $ depends mostly on T2 value.
3. a. 3
g-factor
Landé’s g-factor is
= 1 +
*(* + 1) + ( + 1) − +(+ − 1)
2*(* + 1)
Where L, S and J are orbital, spin and full momenta numbers, consequently. In case of spin magnetism, L=0 (free electron case) and g=2.0023. Any deviation from g=2.0023 indicates additional orbital magnetism (spin-orbit coupling) leading to dispersion of resonance field. Once there is a strong spin-orbit interaction, which is an efficient sensor to the ligand surroundings, it is linked to crystal field. For ions g-factor is
= 2(1 − , Δ- ) λ – spin-orbit coupling constant
∆ – splitting in ligand’s field
In case of high ∆ and low negative λ, g-factor is close to that of free electron and the dispersion of g-value can be in the 0.001 order.
16 Generally, all the interactions in spin system are anisotropic which comes from wave functions’ anisotropy except unpaired s-electrons. The value of resonance field and g-factor thus depend on relative magnetic field direction and crystal axes orientation in case of single crystal samples. In amorphous phase anisotropic interactions equalize bringing an isotropic effect on g-factor value: the signal does not depend on sample’s orientation. In a crystalline phase the symmetry is either cylindrical or inferior as a function of the structure.
In a cubic symmetry of g-tensor all three components are equal gx=gy=gz. In an axial symmetry the g-factor is represented with g││ (parallel to z axe field) and g┴ (perpendicular to z axe field). In a lower symmetry (rhombic) one can detect all three g-components gx, gy and gz.
Fine structure is detected when there are more than 1 unpaired electrons (S>½). In case for example of S=3/2, 4 equidistant MS sublevels are created. The only resonance peak is observed at hν= gµBB. In real systems the energies between the sublevels are not equal anymore because of crystal field inhomogeneity. Therefore, the absorption can be registered at various magnetic field values giving rise to 3 resonance lines.
3. a. 4
Constants of hyperfine structure
The hyperfine structure of EPR spectra comes from interactions between unpaired electron and nuclei momenta. When nuclei momentum is I≠0 one can observe 2I+1 lines instead of one. For example, 23% of natural abundance of Er is 167Er isotope with I=7/2. Thus 8 supplementary lines are detected by EPR (Figure II-4).
17
3. b.
Experimental aspects
3. b. 1
EPR spectrometer principle
Radiation source in EPR spectrometer is provided by a klystron giving a monochromatic radiation (Figure II-5). The attenuator allows controlling the power at the sample. The cuvette with the sample is of parallelepiped or cylindrical shape. The cuvette’s size is enough to form a static wave. The static magnetic field is provided by an electromagnet.
Figure II-5. The principal scheme of EPR spectrometer
After the signal of the sample comes through the detector with an amplifier, it is being registered. An important point is that they work with a fixed frequency (X band or Q band…) and a variable magnetic field. The amplification is executed with modulations of the high-frequency magnetic field. For technical reasons, the recorded common EPR signal corresponds to the absorption’s derivatives.
In this work, the EPR experiments were carried out with a Bruker X-band EMX spectrometer. The frequency was 9.8 GHz. The signal was normalized afterwards by attenuator’s gain and by sample’s mass.
18
3. b. 2
Parameters for point defects study
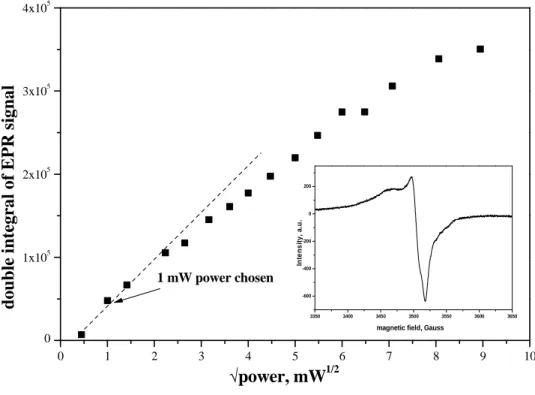
All the paramagnetic point defects were observed at room temperature. For each type of defect in AS and phosphate glasses, we determined the microwave power by establishing the power saturation curve. In aluminosilicate glasses the analysis of hole centers gave the curve in Figure II-6.
The intensities brought from double integration were plotted versus power’s square root. 0 1 2 3 4 5 6 7 8 9 10 0 1x10⁵ 2x10⁵ 3x10⁵ 4x10⁵ 3350 3400 3450 3500 3550 3600 3650 -600 -400 -200 0 200 In te n s it y , a .u .
magnetic field, Gauss
d o u b le i n te g ra l o f E P R s ig n a l √power, mW1/2 1 mW power chosen
Figure II-6. Power saturation of hole centers in AS glasses
The chosen power for hole centers in aluminosilicate glasses was 1 mW which was under linear law presented above (Figure II-6), therefore, it was in proportional range and could be applied to intensity comparison.
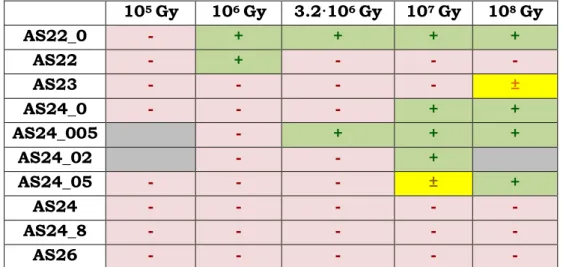
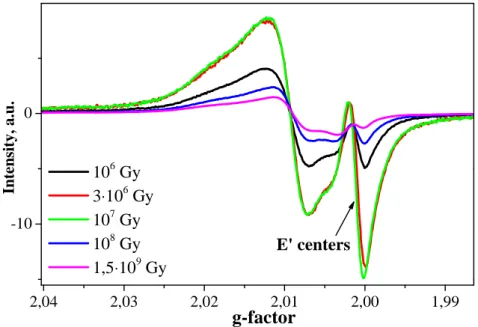
At doses higher than 3·106 Gy, some E’ centers were induced (Figure II-7). It is well-known that E’ signal saturates at low powers [9] [10] [11]. Since E’ centers are observed together with hole centers, the double integration technique did not promise to be as efficient as in previous case. The solution was the absolute difference between the maxima of E’ signal (Figure II-7). It was proportional to the integrated value because of very narrow shape.
19 0 2 4 6 8 10 12 14 16 0,00 0,02 0,04 0,06 0,08 0,10 0,12 0,14 3350 3400 3450 3500 3550 3600 3650 -8000 -6000 -4000 -2000 0 2000 4000 6000 In te n si ty , a .u .
Magnetic field, Gauss
∆Int ∆ In t, a .u . √power, µW1/2 5 µW power chosen
Figure II-7. Power saturation curve for E' centers in AS glasses
Point corresponding to 5 µW power was in the linear region and, consequently, was chosen for further experiments (Figure II-7).
Concerning microwave power in P-containing glasses and fibers, the information in literature is too various. The microwave power, announced in literature, varies from 0.01 to 20 mW. D. Griscom et al. [12] recorded all the defects in P-doped silica at 100K, but there is no information on saturation power. Working also with P-doped silica fibers at room temperature, G. Origlio et al. [13] used 0.19 mW and 1.9 mW powers for POHC and P defects, respectively. H. Hosono et al. [14] analyzed phosphate glasses at 77 K using 0.01 mW power to avoid signal saturation. Contrary to that, P. Ebeling et al. [15] observed paramagnetic defects in phosphate glasses at room temperature at 20 mW to have the whole signal visible. There is no principle agreement in this information neither in working temperature nor in saturation power. Therefore, it is important to attenuate carefully the microwave power to detect paramagnetic defects in our phosphate glasses.
In phosphate glasses, P centers were detected as well as POHC centers (Figure II-8). For each type, the power saturation laws were realized.
20 2500 3000 3500 4000 4500 -1000 0 1000 In te n si ty , a .u .
magnetic field, Gauss electron centers hol e ce nte rs ∆ Int
Figure II-8. EPR spectrum of P centers in phosphate glasses
The defects in phosphates were presented with double resonances due to hyperfine interaction. Its intensity was estimated as the absolute difference between 2 vertical maxima indicated in Figure II-8. The spectra were registered in vast microwave power range in 2500-4500 Gauss. The value of 1 mW was in linear region and thus chosen for P centers.
The narrow part in 3350-3650 Gauss corresponds to POHC defects (Figure II-9). Its intensity was estimated in common way as for P defects.
0 1 2 3 4 5 6 7 8 9 10 0 40000 80000 120000 3450 3475 3500 3525 3550 -6000 -4000 -2000 0 2000 In te n si ty , a .u .
magnetic field, Gauss
In te n si ty , ∆ m a x √power, mW1/2 1 mW power chosen
Figure II-9. EPR spectrum of POHC defects in phosphate glasses (inset) and its power saturation
21 At the common plot (Figure II-9) same power of 1 mW was chosen for POHC centers in phosphate glasses.
Thereafter, all the EPR spectra of paramagnetic defects in irradiated phosphate glasses were recorded at 1 mW power as it was driven from the power saturation experiment above.
3. b. 3
Parameters for Yb
3+ions study
Yb is a 4f-element with electronic structure 4f14 5s2 5p6 6s2 (Figure II-10). The +3 charge can be reached by leaving out 3 electrons (Figure II-10 red spins). At first, 2 electrons leave 6s orbital. The 5s and 5p orbitals are complete and screen the internal 4f shell with 13 electrons. It is worth to point out here that 4f14 configuration is stable and it is thus possible to detect Yb2+ ions. Nevertheless, the ionization potential of Yb2+ ion (-2.8 V) is higher than that of Yb3+ (-2.22 V) which is formed by leaving of 1 4f electron. Yb3+ ions have therefore 13 f-electrons.
Figure II-10. The orbitals in Yb atom and Yb3+ ion formation
We can now calculate the term symbols of Yb3+ ion. The term is represented as 2S+1LJ. In our case spin angular momentum S=∑ /0 where si is electron’s spin +½ or -½. Consequently, S=±½ and spin multiplicity 2S+1 is 2 or 0 which means a doublet of energy levels. Orbital angular momentum L=∑32 1 where li is the azimuthal quantum number and n is the principal quantum number, 4 in our case. L=3 (0, 1, 2, 3, 4, 5 … are S, P, D, F, G, H …) and it is written thus F. The total angular momentum quantum number values are J=│L-S│. Spin angular momentum of Yb3+ ion is either +½ (ground state because of positive spin projection) or -½ (excited state because of negative spin projection), and J can be 7/2 and 5/2, consequently. There are finally 2 energy levels of Yb3+ ions 2F7/2 and 2F5/2 (Figure II-11).
22 Figure II-11. Energy levels of Yb3+ ion
The f-electrons of lanthanides can be regarded as in weak crystal field due to 5s and 5p screen. The number of f-electrons of Yb3+ ion is odd. The levels described above can be thus degenerated into J+½ sublevels, 4 for 2F7/2 and 3 for 2F5/2 (Figure II-11). Each sublevel is a Kramers doublet. These transitions can be detected with EPR at low temperature only because of short T1 value at room temperature.
Yb is represented with 7 stable isotopes, 2 of them have non-zero nuclear momentum: 171Yb (14.31% natural abundance) has I=½ and 173Yb (16.31% natural abundance) has I=5/2. Thereafter, the EPR hyperfine signal of Yb3+ ions derives from 2 isotopes 171Yb and 173Yb. Yb3+ ions in various crystallized compounds occupy sites of various symmetry types. The parameters of g-tensors of Yb3+ paramagnetic ions in various compounds are given below (Table II-4).
Composition Symmetry of Yb site g-parameters Source
YbB12 Oh, cubic g=2.52, slight anisotropy [16]
β-PbF2 cubic g=3.434 [17] KMgF3 C4v, tetragonal │g║│=1.070, │g⊥│=4.430 [18] LuVO4 D2d, tetragonal D2, C2v, rhombic g║=6.464,│g⊥│=0.59 │g║│=2.75, │g⊥│=0.89 │g║│=2.84, │g⊥│=0.89 --- [19] BaY2F8 C2, monoclinic Isolated g║=4.91, g⊥=5.09 Pairs g║=2.216, g⊥=2.241 [20] KYb(WO4)2 C2, monoclinic gx=1.039, gy=0.997, gz=6.62 [21] CsCdBr3 D3d, trigonal g║=2.503 g⊥=2.619 [22]
Table II-4. The symmetry of Yb sites and g-tensors parameters in various compositions
23 EPR was carried out quite a lot to characterize the Yb3+ ion symmetry and obtain some information on pairs in crystals [16] [20] [23] but less results could be found on glasses in literature [24] [25] [26] due to the broad signal. The intensity of Yb3+ EPR line is extremely sensitive to the temperature: it decreases crucially when T≥20 K due to the quick relaxation time T1 of rare earth element (except 4f7 element). The relaxation time T1, some distortion of Yb sites in glassy network and the multisite presence bring the Yb3+ line broadening in glass.
The EPR signal of Yb3+ in AS glasses at 4 K is a broad resonance at g=4.1 because it is not observed in glasses without Yb (Figure II-12). It was thus attributed to Yb3+ ions. 0 1000 2000 3000 4000 5000 6000 7000 8000 9000 10000 -0,6 -0,4 -0,2 0,0 0,2 0,4 0,6 0,8 1,0 In te n si ty , a .u .
magnetic field, Gauss
g=4,1
Figure II-12. EPR spectra of non-irradiated AS24 glass at 4K.
The dominant resonance position corresponds to g=4.1. It is close to the g-values in irradiated Yb-doped aluminoborosilicate (ABS) glasses [25].
For power saturation curve, the intensity estimated as ∆max and plotted is given in Figure II-13. The power optimal at 4K is 3mW (Figure II-13).
24 0 2 4 6 8 10 0 5 10 15 20 25 In te n s it y , ∆ m a x √power, mW1/2 3mW
Figure II-13. Power saturation for Yb3+ ions in non-irradiated AS24 glass at 4K For phosphate glasses microwave power saturation was recorded as well. The value 1mW at 4K was chosen.
4.
Optical measurements
The Yb3+ spectroscopic properties were studied by carrying out absorption, lifetimes τIR and τCL and cooperative emission measurements. This part of work was executed in fruitful collaboration with Philippe Goldner and Alban Ferrier (ENSCP, Paris).
4. a.
IR-luminescence of Yb
3+Yb3+ emission 2F5/2→2F7/2 in the IR-region was recorded in LSI by HORIBA Jobin Yvon spectrofluorimeter under Xe lamp excitation with a 1200 gr/mm grating. The studied glasses were in powders of controlled particle size, 100-125 µm.
To follow the post-irradiation relaxation processes, the lifetimes τIR were recorded as well using the same equipment. The non-irradiated AS24_8 powder was chosen as reference. The established absolute error was estimated to 0.02 ms.
By reason of complexity and lack of time to irradiate all the samples under powders form as well as under slices form, the dose and dose rate effects were studied on slice samples only. The results from slices and powder irradiated in the same conditions were compared to exclude the serious deviation due to different physical substances. Besides, the powders were analyzed in ENSCP (with friendly
25 participation of P. Aschehoug) under 975 nm laser excitation in order to eliminate the error originating from equipment change (Table II-5, Table II-6). In all analyzed samples the decay curves were single-exponential indicating the absence of other processes. Sample My results B. Schaudel powders [1], ms Spectrofluorimeter in
LSI Laser excitation in ENSCP, powder, ms Slice, ms Powder, ms AS22 2.45 2.55 2.14 1.90 AS23 1.80 2.17 1.97 1.70 AS24 1.41 1.31 1.15 1.00 AS26 1.13 0.87 0.94 0.90
Table II-5. Lifetimes τIR recorded in non-irradiated AS glasses
In aluminosilicate glasses the lifetimes were similar between powders and slices (Table II-5). The results obtained in LSI and in ENSCP were in good agreement, too. The lifetimes from B. Schaudel’s work are shorter than in this work. This can come from small variations in synthesis methods: losses of Na at glass melting temperatures can affect the network structure and, consequently, Yb3+ environment.
The lifetimes τIR observed in phosphate glasses are given in Table II-6.
Sample My results B. Schaudel powders [1], ms Spectrofluorimeter in
LSI Laser excitation in ENSCP, powder, ms Slice, ms Powder, ms 2743 0.82 0.73 0.68 1.00 2742 0.84 0.84 0.81 0.95 2745 1.16 1.22 1.15 1.00 2746 1.43 1.34 1.40 1.15
26 Despite the values obtained in slices and in powder either in LSI or in ENSCP are in good correlation, the lifetimes τIR in B. Schaudel’s work were different. With high probability it was generated by deviation in the phosphate glass synthesis.
4. b.
Cooperative luminescence of Yb
3+(CL)
A weak green emission of Yb3+ in YbPO4 was first observed by E. Nakazawa et al. in 1970 [27] where they proposed the term “cooperative luminescence”.Pairs of Yb3+ ions absorb simultaneously radiation of energy to excite 2F5/2 state with consequent emitting of one photon which energy is twice higher than in case of common IR luminescence (Figure II-14). That is the mechanism leading to an emission in the visible region (480-530 nm). The lifetime value in this case is 2 times shorter than τIR. In different matrices it varies in the 300-550 µs range [27] [28] [29] [30].
Figure II-14. Scheme of Yb3+ ions pairs energy levles
The quantitative theoretical interpretation of the experiments on cooperative luminescence is not yet well developed [31]. It concerns the cases of Yb cluster formation. However, in [32] the authors demonstrated the importance of cooperative emission probability in study of Yb-Yb pair interactions. After some particular calculations, the probability of cooperative luminescence X was given with formula that was applied to compare the intensities of cooperative emission probability [1]
4 ∝ 6778 9 :;
27 Taking into account that the sample consists on equi-dimensional particles, the absorbance power was transformed into the coefficient αD2that was calculated by multiplying the absorption spectrum of the sample and emission spectrum of the diode (normalized at maximum). The coefficient αD was the area under the result curve.
4 ∝ 6778 <=;
One more reference was AS24_8 sample that was analyzed each time of experiments. Taking into account that its cooperative emission intensity was stable, its spectra recorded in all days of measurements were used to normalize the intensity as well.
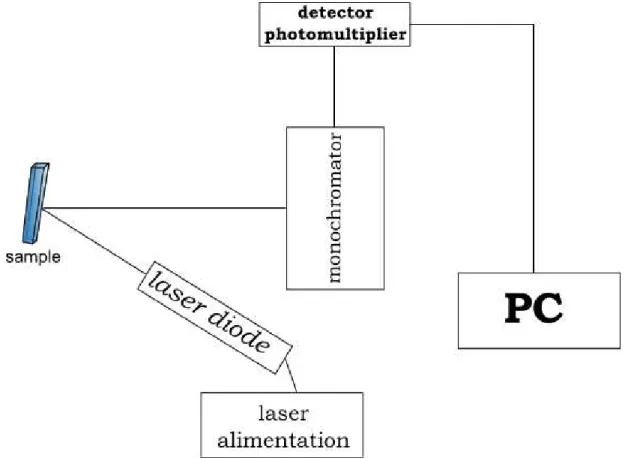
To measure the cooperative emission, the same approach than B. Schaudel [1] was followed (Figure II-15) with the same laser diode [29]. The limited power allowed us first to study efficiently the samples with strong Yb3+ cooperative emission only (AS23, AS24, AS24_8, AS26). It was applied to follow the evolution in time of cooperative emission in these samples. Afterwards, we obtained the possibility to use a new laser diode to study the stabilized samples with low Yb3+ cooperative emission, too (AS22, AS24_05, phosphates).
Figure II-15. The scheme of experimental setup for cooperative emission measurements
28 880 900 920 940 960 980 1000 1020 1040 0,2 0,4 0,6 0,8 1,0 977.71 nm In te n si ty , n o rm al iz e d a t m ax wavelength, nm
Figure II-16. Laser emission spectrum normalized at maximum
The spectrum of laser emission was implied to normalize the probability of cooperative luminescence (Figure II-16, Figure II-17). The spectrum was multiplied with absorption spectrum giving absorbance power Pabs in laser excitation region. It was reasonable in case of variable absorption for different Yb concentrations [1].
460 480 500 520 540 560 580 0,0 0,1 0,2 0,3 0,4 0,5 In te n si ty , a. u . wavelength, nm
Figure II-17. Cooperative emission of Yb-Yb pairs under 975 nm excitation (aluminosilicate glass AS24_8)
4. c.
Absorption
Absorption measurements were carried out with Cary 6000i UV-Vis-NIR spectrofluorimeter and InGaAs detector. The wavelength resolution was 0.5 nm. The
29 maximum range was 300-1200 nm. It was mainly useful for cooperative luminescence normalization.
The measurements were performed with powder sample of 100-125 µm particles. The measured parameter was Reflectance, after that it was derived into Absorbance using Kubelka-Munk formula
>(?) =(1 − ?) 2? = @ /= A"/ × B /
F(R) – derived value of Kubelka-Munk function
R – reflectance
k – absorption coefficient s – scattering coefficient
c – concentration of absorbing species Abs – absorbance
Taking into account that the concentration of absorbing species was the same in most of the samples – 5 wt. % of Yb2O3, it was supposed that c/s is identical in the samples. Therefore, the comparison of derived from reflectance k/s could be used effectively.
The question of reference was of high importance. Since the interest was concentrated on Yb3+ absorption, the non-doped samples were used as the reference. Same principle was applied to study the irradiated samples: irradiated non-doped samples were used as the references. In Kubelka-Munk formula given above the parameter R was presented from
? =?: 8CD ?EDFDE
To exclude the effect of Yb-clusters on Yb3+ absorption, the experiment was calibrated as a function of the Yb concentration. The polished transparent non-irradiated slices were analyzed. The normalization by the thickness was implied to the results.
30 0 1 2 3 4 5 6 7 8 9 10 0,00 0,05 0,10 0,15 0,20 0,25 0,30 0,35 0,40 0,45 0,50 800 850 900 950 1000 1050 1100 1150 0,00 0,04 0,08 0,12 A b so rb a n ce f ro m K u b el k a -M u n k f o rm u la wavelength, nm m a x im u m a t 9 7 5 n m Yb2O3 concentration, wt. %
Figure II-18. Maxima of absorption in AS24_Ybx non-irradiated polished slices. Normalization by thickness. Absorption spectrum of AS24 glass is in inset
Yb3+ absorption obeyed to linear dependence within Yb concentration (Figure II-18) in the sample except the sample AS24_Yb5, the most used Yb concentration in this work. Stronger absorption could take place in case of cooperative effects, in particular, cooperative absorption.
4. d.
Photoluminescence of defects (LSI)
In some particular cases, the radiation-induced point defects were analyzed by time-resolved photoluminescence in slices at room temperature. We used 266 nm and 532 nm laser excitations (pulsed Nd:YAG laser). For the detection Shramrock SR-303i spectrometer is associated to an ANDOR ICCD camera.
The beam energy of 266 nm excitation at the sample was 1.3 mJ. This technique was applied to investigate some diamagnetic defects in phosphate glasses which lifetime was estimated 5-6 ms. The power of the laser was optimized to detect the signal with the best signal/noise ratio without inducing photobleaching or defect creation.
The 532 nm excitation has been used to investigate NBOHC defects in aluminosilicate glasses. The delay was 500 ns and the gate width was 100 µs. The estimated lifetime of the defect was ~10 µs. The signal of Sm3+ emission was taken as reference to control the stability of experimental conditions (wavelength and intensity).
31 [1] B. Schaudel, Ph.D. dissertation, Paris: Université Paris VI, 2000.
[2] N. A. Bokov, Glass Phys. Chem., vol. 31, p. 734, 2005.
[3] M. Abid, A. Shaim et M. Et-tabirou, Materials Research Bulletin, vol. 36, p. 2453, 2001.
[4] C. Bourgeois, Interaction particules-matière, Techniques de l'Ingénieur, traité Sciences fondamentales.
[5] N. Ollier et V. Pukhkaya, Nucl. Instr. and Meth. in Phys. Res. B, vol. 277, p. 121, 2012.
[6] E. K. Zavoisky, State Register of Discoveries of the USSR, №85 Electronic
Paramagnetic Resonance.
[7] A. Abragam et B. Bleaney, Electron Paramagnetic Resonance of Transition Ions, Oxford: Clarendon Press, 1970.
[8] J. Vincent, O. Guillot-Noël, L. Binet, P. Aschehoug et Y. Le Du, J. Appl. Phys., vol. 104, p. 033519, 2008.
[9] E. J. Friebele, D. L. Griscom, M. Stapelbroek et R. A. Weeks, Phys. Rev. Lett., vol. 42, p. 1346, 1979.
[10] L. Nuccio, S. Agnello et R. Boscaino, Phys. Rev. B, vol. 79, p. 12505, 2009. [11] H. Nishikiawa, E. Watanabe, D. Ito et Y. Ohki, J. Non-Cryst. Solids, vol. 179, p.
179, 1994.
[12] D. L. Griscom, E. J. Friebele, K. J. Long et J. W. Fleming, J. Appl. Phys., vol. 54, p. 3743, 1983.
[13] G. Origlio, F. Messina, M. Cannas, R. Boscaino et S. Girard, Phys. Rev. B, vol. 80, p. 205208, 2009.
[14] H. Hosono, Y. Abe et H. Kawazoe, J. Non-Cryst. Solids, vol. 71, p. 261, 1985. [15] P. Ebeling, D. Ehrt et M. Friedrich, Opt. Mater., vol. 20, p. 101, 2002.
[16] T. S. Altshuler, Y. V. Goryunov, M. S. Bresler, F. Iga et T. Takabatake, Phys.
Rev. B, vol. 68, p. 014425, 2003.
[17] K. I. Gerasimov, A. M. Leushin et M. L. Falin, Phys. Solid State, vol. 43, p. 1675, 2001.
[18] M. L. Falin, V. A. Latypov, B. N. Kazakov, A. M. Leushin, H. Bill et D. Lovy,
Phys. Rev. B, vol. 61, p. 9441, 2000.
[19] O. Guillot-Noël, P. Goldner, M. Bettinelli et E. Cavalli, J. Phys.: Condens.
Matter, vol. 17, p. 3061, 2005.
[20] S. M. Kaczmarek, G. Leniec, J. Typek, G. Boulon et A. Bensalah, J. of Lumin., vol. 129, p. 1568, 2009.
[21] M. C. Pujol, M. Aguilo, F. Diaz, M. T. Borowiec, A. D. Prokhorov, V. P.
Dyakonov, A. Nabialek, S. Piechota et H. Szymczak, Physica B, vol. 388, p. 257, 2007.
[22] V. Mehta, O. Guillot-Noël, D. Simons, D. Gourier, P. Goldner et F. Pellé, J. All.
Comp., vol. 323&324, p. 308, 2001.
[23] T. Bodziony, S. M. Kaczmarek et C. Rudowicz, Physica B, vol. 403, p. 207, 2008.
32 [24] D. L. Smith, H. J. Stapleton et M. B. Weissman, Phys. Rev. B, vol. 33, p. 7417,
1986.
[25] N. Ollier, R. Planchais et B. Boizot, Nucl. Instr. and Meth. in Phys. Res. B, vol. 266, p. 2854, 2008.
[26] G. Dantelle, M. Mortier, P. Goldner et D. Vivien, J. Phys. Condens. Matter, vol. 18, p. 7905, 2006.
[27] E. Nakazawa et S. Shionoya, Phys. Rev. Lett., vol. 25, p. 1710, 1970. [28] T. G. Ryan et S. D. Jackson, Opt. Commun., vol. 273, p. 159, 2007. [29] B. Schaudel, P. Goldner, M. Prassas et F. Auzel, J. Alloys and Comp., vol.
300&301, p. 443, 2000.
[30] P. Barua, E. H. Sekiya, K. Saito et A. J. Ikushima, J. of Non-Cryst. Solids, vol. 354, p. 4760, 2008.
[31] F. Auzel et P. Goldner, Opt. Mater., vol. 16, p. 93, 2001.
[32] P. Goldner, F. Pellé, D. Meichenin et F. Auzel, J. Lumin., vol. 71, p. 137, 1997.
List of Figures
Figure II-1. SIRIUS accelerator in LSI: from top to down. Photo of irradiation source where electron beam is created, photo of two irradiation cells, zoom at CIRANO and sample holder. ... 11 Figure II-2. Energy levels splitting under applied magnetic field ... 13 Figure II-3. Curves recorded with EPR spectroscopy ... 14 Figure II-4. ERP spectra of Er3+ in β-Ga2O3 [7] ... 16 Figure II-5. The principal scheme of EPR spectrometer ... 17 Figure II-6. Power saturation of hole centers in AS glasses ... 18 Figure II-7. Power saturation curve for E' centers in AS glasses ... 19 Figure II-8. EPR spectrum of electron centers in phosphate glasses ... 20 Figure II-9. EPR spectrum of hole centers in phosphate glasses (inset) and its power saturation ... 20 Figure II-10. The orbitals in Yb atom and Yb3+ ion formation ... 21 Figure II-11. Energy levels of Yb3+ ion ... 22 Figure II-12. EPR spectra of non-irradiated AS24 glass at 4K and 10K. show ∆max on the picture ... 23 Figure II-13. Power saturation for Yb3+ ions in non-irradiated AS24 glass at 4K .... 24 Figure II-14. Scheme of Yb3+ ions pairs energy levles ... 26 Figure II-15. The scheme of experimental setup for cooperative emission
measurements ... 27 Figure II-16. Laser emission spectrum normalized at maximum... 28 Figure II-17. Cooperative emission of Yb-Yb pairs under 975 nm excitation
(aluminosilicate glass AS24_8) ... 28 Figure II-18. Maxima of absorption in AS24_Ybx non-irradiated polished slices. Normalization by thickness ... 30
33 List of Tables
Table II-1. Nominal compositions of aluminosilicate glasses ... 8 Table II-2 . Nominal compositions of phosphate glasses ... 9 Table II-3 . Irradiation conditions ... 12 Table II-4. The symmetry of Yb sites and g-tensors parameters in various
compositions ... 22 Table II-5. Lifetimes τIR recorded in non-irradiated AS glasses ... 25 Table II-6. Lifetimes τIR recorded in non-irradiated phosphate glasses ... 25
Chapter III
Yb-doped Na-aluminosilicate
glasses
36
III.
Yb-doped Na-aluminosilicate glasses ... 38
1. Glass structure ... 38 1. a. Bibliographic part ... 38 1. b. AS22-AS26 glass structure ... 41 1. c. Effect of irradiation at strong doses on glass structure... 44 1. d. Yb environment ... 47 1. d. 1 IR-luminescnce ... 47 1. d. 2 EPR spectroscopy ... 47 1. d. 3 Cooperative luminescence ... 49 1. d. 4 AS24_Ybx glasses ... 51 Raman spectroscopy ... 51 Cooperative luminescence ... 52 2. Point defects ... 53 2. a. Paramagnetic defects assignation... 532. a. 1 E’-centers ... 53 2. a. 2 Peroxy radicals ... 54 2. a. 3 Non-Bridging Oxygen Hole Centers (NBOHC) ... 54 2. a. 4 HC defects ... 54 2. a. 5 Al-OHC defects ... 56
2. b. Formation of paramagnetic defects in AS22-AS26 glasses ... 56
2. b. 1 Influence of the glass composition... 56 2. b. 2 Influence of Yb-doping ... 58
2. c. Relaxation of paramagnetic defects ... 61
2. c. 1 Analysis of relaxation curves ... 63 2. c. 2 Recovery of individual defect type ... 64
2. d. Effect of irradiation dose and dose rate ... 65
2. d. 1 Total amounts of the defects ... 65 2. d. 2 Relative amounts of defects (dose effect) ... 69
37 3. Luminescent properties of Yb3+ ... 73 3. a. Cooperative luminescence (CL) ... 73
3. a. 1 CL in AS glasses with high content of Yb clusters ... 73 3. a. 2 CL in AS glasses with less content of Yb clusters ... 76
3. b. Lifetime of Yb3+2F5/2 excited state ... 76
3. b. 1 Before irradiation ... 77 3. b. 2 Dose and dose rate effects ... 77
3. c. Analysis of the role of defects in CL and lifetime evolution under irradiation ... 82
3. c. 1 Post-irradiation evolution in time ... 82 3. c. 2 Thermal annealing treatments ... 83 AS22_10e8 glass ... 83 AS24_10e8 glass ... 86
38
III.
Yb-doped Na-aluminosilicate
glasses
In this Chapter III aluminosilicate glasses doped with Yb are discussed. Yb cluster content is different from one glass to another in this series AS22-AS26 [1]. Therefore, it is interesting to study in aluminosilicate glasses the role of Yb cluster on point defects formation which has an impact on the Yb3+ luminescent properties. After analysis of differences in glass structure and Yb3+ environment, we discuss the evolution of glass properties under irradiation.
The point defects are investigated as a function of irradiation dose rate, dose and time. Yb cooperative luminescence and the lifetime of excited 2F5/2 state are studied in a vast dose range. The role of Yb cluster will be discussed.
We tried to understand the role of point defects in the decrease of the lifetimes τIR and τCL.
1.
Glass structure
1. a.
Bibliographic part
Glass network-forming SiO4 polyhedra are usually corner-linked via Bridging Oxygens (BO). They form a three-dimensional extended connected network according to Continuous Random Network model of Zachariasen (CRN) (Figure III-1 a) [2]. Modifying cations, such as alkalis, destroy the connectivity of the oxide network and create Non-Bridging Oxygens (NBO) that are linked to only one network-forming cation. The structure of a modified glass can be pictured as a combination of a partly depolymerized network and an ionically packed modifying oxide according to the Modified Random Network (MNR) model (Figure III-1 b) established by Greaves [3]. When tetrahedral network-formers like Al3+ ions are incorporated into a modified silicate glass composition they form negatively charged (AlO4)- units that must be compensated by the modifying cations and the concentration of NBOs is thus reduced proportionally (Figure III-1 c). The structure