1 Introduction
Biochar, a solid by-product of waste biomass pyrolysis, has recently attracted interest for both environmental protection and agricultural applications due to its unique physicochemical properties (Oleszczuk et al., 2016). Beneficial properties include high surface area, porosity, and capability of adsorbing and exchanging different compounds such as organic contaminants, nutrients, and some gases (Yargicoglu et al., 2015). The advantages of using biochars and especially activated biochars, in wastewater treatment processes have already been reported (Zhang et al., 2013). Furthermore, a recent study showed that biochars have superior binding capacity toward engineered nanoparticles compared to commercial activated carbons (Inyang et al., 2014). Biochars can also improve soil fertility, productivity, increase nutrients content and water holding capacity, and reduce emissions of other greenhouse
A green method for production of nanobiochar by ball milling- optimization and characterization
Mitra Naghdia Mehrdad Taherana Satinder Kaur Brara, ∗ [email protected] Tarek Rouissia Mausam Vermab Rao Yadagiri Surampallic Joseph Rene Valeroa aINRS-ETE, Université du Québec, 490, Rue de la Couronne, Québec G1K 9A9, Canada, bCO2 Solutions Inc., 2300, rue Jean-Perrin, Québec, Québec G2C 1T9 Canada cDepartment of Civil Engineering, University of Nebraska-Lincoln, N104 SEC PO Box 886105, Lincoln, NE 68588-6105, USA ∗Corresponding author. Abstract Environmental considerations along with the technological challenges have led to search for green and energy-efficient processes for advanced nanostructured materials. In this study, nanobiochar was produced from pine wood biochar using a planetary ball mill. A central composite experimental design and response surface methodology was employed to optimize the ball milling parameters including time, rotational speed and ball to powder mass ratio to obtain nanoparticles in short time and at lower energy consumption. ANOVA results showed that the linear and quadratic effect estimates of time and the interaction effect of time and rotational speed were significant contributors to the size of particles during milling (p < 0.05). Based on the developed statistical model, the optimum conditions for obtaining the smallest particles, around 60 nm, were found to be 1.6 h, 575 rpm and 4.5 g/g. However, the size measurements indicated that particles had a great tendency to agglomerate. Further study showed that the conditioning of biochar at cryogenic temperatures prior to milling inhibits the agglomeration of nanoparticles which is essential in industrial processes. The adsorption test proved that the nanobiochar produced using green method is promising in the removal of micropollutants from aqueous media by removing up to 95% of carbamazepine from water. At the optimum milling parameters and conditioning for 24 h at −80 °C, nanobiochar with the average size of around 60 nm was obtained. The produced nanobiochar was characterized by Brunauer-Emmett-Teller (BET) gas porosimetry, scanning electron microscopy (SEM) and Fourier transform infrared spectroscopy (FTIR). Also, physical and chemical properties, such as water holding capacity, organic matter, oxidation-reduction potential (ORP), elemental composition, polycyclic aromatic hydrocarbons (PAHs) and heavy metals were analyzed.gasses (Yao et al., 2011). Production of biochar in large scale for environmental applications is feasible due to the abundance of low-cost feedstock materials. Combining biochar technology with emerging technologies, such as biotechnology and nanotechnology, might result in the creation of novel materials with enhanced capabilities for environmental applications (Yao et al., 2011; Zhang et al., 2012).
Depending on the pyrolysis technology, the particle size of the produced biochars varies in the range of hundreds of micrometers to several centimeters (Lehmann and Joseph, 2015). Reducing the particle size of biochars down to nanosized range can improve their properties for particles smaller than 100 nm, higher surface to volume ratio enhances the surface energy and hence biological effectiveness (Kesavan and Venkatraman, 2014; Sulaiman et al., 2013).
There are top-down methods, such as arc discharge and laser ablation and bottom-up methods, such as chemical precipitation and microwave pyrolysis for production of carbonaceous nanoparticles. However, most of these methods require high energy input, expensive precursors and sophisticated processes (Xiao et al., 2013). Therefore, it is still essential to design a cheap, effective and green method to produce carbonaceous nanoparticles. Ball milling is a top-down approach for production of nanoparticles in which mechanical forces are used to reduce the size of particles (Deguchi et al., 2006). This method has been widely studied in recent years and it has the potential for green, reproducible, low-cost and large-scale production of different classes of nanopowders (Charkhi et al., 2010). For example, Awasthi et al. studied the ball milling of graphitic carbon at different times and constant rotational speed and reported the formation of different forms of carbon nanoparticle, such as nanotubes and nanofibers. They concluded that the formation of small and thin graphitic sheets depends on milling time and the structure can be destroyed, if the ball-milling is done for a very long time (Awasthi et al., 2002). In a similar study, Huang et al. reported the production of nano arches or highly curled carbon nanostructures in ball milling of graphite (Huang et al., 1999). Also Chen et al. used Hexagonal graphite to produce nanoporous carbon by ball milling process at various times. Their transmission electron microscopy (TEM) micrographs confirmed the formation of the turbostatic and amorphous structures with the size around 100 nm after ball milling for 15 h. According to their observations, long milling times caused a high level of iron contamination so that the iron content in the sample was found to be about 3.5 wt % after milling for 150 h (Chen et al., 1999). In another study, Pierard et al. investigated ball milling of multi-wall carbon nanotubes with the average length of 0.7–0.9 μm. Their TEM micrographs showed that the nanotube length decreased with increasing milling time. They also found the proper time for obtaining narrow distribution (Pierard et al., 2001).
As per the results so far obtained by the researchers, there are several parameters including time, rotational speed and ball to powder mass ratio that influence the size of particles and their surface energy (Shah et al., 2015). However, according to the literature review, there is no study on simultaneous investigation and optimization of these parameters on ball milling for the production of carbonaceous nanoparticles.
There are 12 principles in green chemistry metrics (Naghdi et al., 2015), among which the proposed method satisfies half of these metrics including prevention of wastes generation, high atom economy, avoiding harmful chemical process, using less toxic solvents and auxiliaries, using renewable sources and biodegradability of the product.
In this study, nanobiochars was produced using ball milling process. Considering time, rotational speed and ball to powder mass ratio, a set of experiments were planned by central composite design and the results were analyzed by response surface methodology to optimize the conditions for obtaining nanobiochar in a shorter time and at lower energy consumption rate. In fact, rather than just being optimization study, this manuscript reports about the production of nanobiochar from biochar which is a complex carbonaceous material as compared to the uniform SWCNT or MWCNT carbonaceous materials reported in the literature. The physico-chemical properties of produced nanobiochar at optimum conditions were characterized to signify its agricultural and environmental applications. Also, adsorption of carbamazepine, as a model micropollutant, was investigated on raw and nanobiochar to evaluate the effect of size reduction on adsorption capability of biochar.
2 Materials and methods
2.1 Materials
Pinewood Biochar (BC-PW) was purchased from Pyrovac Inc. (Quebec (QC), Canada). BC-PW was derived from pine white wood (80% v/v, 3 mm) obtained from Belle-Ripe in Princeville and the rest included spruce and fir (20%). The production of BC-PW was carried out at 525 ± 1 °C in the presence of nitrogen under atmospheric pressure for 2 min and was used as obtained from the reactor outlet. Tween 80, sodium hydroxide and ethanol was purchased from Fisher scientific (Ottawa, Canada). Milli-Q water was used throughout the work.2.2 Sample preparation
In a typical procedure, solid biochar and balls were weighed according to statistical plan, placed in a jar and ground until the desired time. A 5-min rest interval was considered after each 5-min grinding to prevent temperature build-up. Sampling was performed at the end of grinding.
2.3 Ball milling of biochar and optimization
performed at room temperature. Ball milling was performed in a planetary ball mill (PM100; Retsch Corporation) using a 500 mL stainless steel jar and stainless steel balls of 2.4 mm in size. Also, the time intervals were set to 5 min ON and 5 min OFF and this value were obtained in preliminary experiments in order to prevent overheating of biochar and balls. To optimize the milling conditions in order to reduce the size of biochar to the lowest possible value, the remaining parameters including rotational speed, ball to powder ratio and grinding time were manipulated in different experiments. The number of balls was fixed to 800 which was equal to 45 g ball, and the mass of biochar was changed accordingly to obtain the required ball to powder mass ratio.
2.4 Design of experiments
Experiments were designed using a central composite design method with 6 replicates in the center and the dependent variable was the size of biochar. Independent parameters and corresponding levels are listed in Table 1. According to these levels, 20 experiments were designed which are listed in Table 2. The levels of each parameter were selected according to the preliminary experiments performed prior to design of experiments. Optimization was carried out by applying response surface methodology (RSM) which is widely used for bioprocess optimization. RSM was known to be useful in studying of parameter interaction which allowed building models and finding optimum working ranges (Derringer, 1980). Independent parameters that affect the size include a period of time (h), ball to powder mass ratio (g/g) and milling speed (rpm).Table 1 Independent variables used for grinding optimization. alt-text: Table 1 Codes and values of independent variables of experimental designs for screening using response surface methodology Levels −2 −1 0 +1 +2 Period of Time (hr) 1.6364 3.3182 5 6.6818 8.3636 Powder of Biochar (g) 4.9546 7.4773 10 12.5227 15.0454 Milling Speed (rpm) 516.1373 545.56865 575 604.43135 633.8627 Table 2 Variable parameters and their level in designed experiments. alt-text: Table 2
No. Powder of Biochar (g) (Ball to Powder Mass Ratio (g/g))a Period of Time (hr) Milling Speed (rpm) Volume Mean (nm)
1 7 (6.43) 3 540 343.8 2 7 (6.43) 3 610 369.1 3 7 (6.43) 7 540 385.6 4 7 (6.43) 7 610 347.1 5 13 (3.46) 3 540 257.9 6 13 (3.46) 3 610 371.8 Fig. 1 Factors affecting the size of ground biochar. alt-text: Fig. 1
7 13 (3.46) 7 540 453.1 8 13 (3.46) 7 610 296.8 9 4.96 (9.07) 5 575 348.1 10 15.01 (3.0) 5 575 391 11 10 (4.5) 1.64 575 212.4 12 10 (4.5) 8.37 575 436.1 13 10 (4.5) 5 516 414.6 14 10 (4.5) 5 634 386.4 15 (C) 10 (4.5) 5 575 414.1 16 (C) 10 (4.5) 5 575 414.9 17 (C) 10 (4.5) 5 575 410.2 18 (C) 10 (4.5) 5 575 414.9 19 (C) 10 (4.5) 5 575 410.2 20 (C) 10 (4.5) 5 575 410.2 aFor convenience, the mass of balls was fixed to 45
g and the mass of biochar was changed in experiments.
2.5 Nanobiochar characterization
2.5.1 Particle size distribution
Particle size distribution and average particle size of the ground samples were analyzed by laser beam scattering technique using a Zetasizer Nano S90 apparatus (Malvern Instruments, UK). Sample preparation was performed using two methods. In the first method, 1 mg of samples was dispersed in 200 mL of distilled water containing 1% ethanol using magnetic stirrer for 60 min. In the second method, 1 mg of samples were dispersed in 200 mL of distilled water containing 1% ethanol and 0.5% Tween 80, using Vibra-Cell VCX-130 Ultrasonic Processor (Sonics & Materials, USA) for 60 min. The samples were kept cold by an external ice bath during the sonication.2.5.2 Water holding capacity (WHC)
Prior to measuring WHC for optimized sample, it was dried in an oven overnight at 60 ± 1 °C to remove absorbed water. A known amount of sample was placed in a ceramic Buchner funnel lined with Whatman filter paper. A known amount of deionized water was poured over the sample slowly and the water was drained after saturation. Considering the relative proportion of water passing through the sample and the moisture absorbed by the filter paper, the WHC was quantified by determining the moisture content of the soaked sample.2.5.3 Surface area measurements
The BET specific surface areas were obtained from the N2 adsorption isotherms recorded at 77 K ((Autsorb-1, Quantachrome Instruments) at the relative pressure range from 0.05 to 1. In this method, the sample was first degassed for 12 h by increasing the temperature to 60 ± 1 °C and applying vacuum. Later, the amount of adsorbed N2 gas onto the surface of a known amount of sample is measured as a function of relative pressure. Finally, from the obtained isotherm, the amount of the required N2 gas for covering the external and the accessible internal pore surfaces of the sample with a complete monolayer of N2 gas was determined using the BET equation.
2.5.4 Electron microscopy
The optimized sample was gold-coated using a sputter coater prior to scanning electron microscopy (SEM). The micrograph was captured using an EVO® 50 (Zeiss, Germany) at 10 kV accelerating voltage. One mg of sample was dispersed in 200 mL distilled water. Five small droplets of the mixture were placed on a thin aluminum foil and dried by heating at 100 ± 1 °C. Finally, the sample was gold coated with the thickness of 15 nm and used for SEM imaging. For transmission electron microscopy (TEM) imaging, one mg of nanobiochar was dispersed in methanol and a small drop was placed on a copper grid to dry at room temperature. The micrograph was captured on a JEM-1230 (JEOL, Japan) operated at 80 kV.2.5.5 Organic matter, ash, volatile matter, and fixed carbon contents
The moisture content of the sample was determined gravimetrically according to ASTM D2216 prior to each test. A crucible was weighed and approximately 1 g of sample was placed in it. The crucible was then heated in the oven at 105 ± 1 °C for 2 h and placed in a desiccator for 1 h prior to weighing. Moisture was determined as a loss in weight of the sample before and after oven drying. Organic matter content was quantified according to ASTM D 2947 by measuring loss on ignition (LOI) at 440 ± 1 °C in presence of oxygen for 16 h. According to ASTM D 1762–84 volatile matter of air-dried biochar samples was determined by keeping them at 950 ± 1 °C for 8 h and similarly, the ash content was measured by keeping the samples at 750 ± 1 °C. The fixed carbon content was determined by subtraction of organic matter from the initial weight of the sample.2.5.6 pH, oxidation-reduction potential (ORP) and electrical conductivity (EC)
One g of biochar sample was mixed with 10 mL of 0.01 M CaCl2 aqueous solution for 3 h. Then pH, ORP (Fisher Scientific brand, accumet AR25) and EC (S230 Seven Compact™ conductivity) were measured according to ASTM D4972. All analyses were carried out in triplicate and the average results are reported. Prior to each measurement, the probes were calibrated according to the instructions provided by the manufacturer and were rinsed with distilled water before placing it in the sample. The probes were placed in the sample and readings were taken when the meter equilibrated.
2.5.7 Zeta potential measurements (ZP)
Zeta potential was determined in duplicate using a Zetasizer Nano S90 apparatus (MALVERN Instruments). One mg of biochar was dispersed in 50 mL deionized water with a magnetic stirrer for 60 min. A small amount of the mixture was transferred to the sample well in the ZP measurement System. For computing ZP, the velocity at which particles move toward a positive electrode is measured. The measurement was taken 15-16 times for each trial and then the average of duplicate samples was reported for nanobiochar.
2.5.8 CHN elemental analysis
Fig. 2 Characterization tests carried out for nano-biochars. alt-text: Fig. 2
To determine the elemental concentration of Carbon, Hydrogen, and Nitrogen, the samples was first dried at 60 ± 1 °C for 8 h and placed into a glass vial. Two sub-samples (2.0–3.0 mg each) were analyzed using a Leco-932 CHNS Analyzer in CHN mode. In CHN mode, samples are combusted in the presence of pure O2 and the combustion gases are measured to determine initial elemental concentrations of C, H and N. The average results of each duplicate sample were reported.
2.5.9 Polycyclic aromatic hydrocarbons (PAHs) analysis
PAH analysis was performed by gas chromatography coupled with mass spectroscopy (GC-MS) (Perkin Elmer, model Clarus 500, with column type DB-5, 30 mm × 0.25 mm × 0.25 μm) according to the CEAEQ method. Samples were extracted with the ultrasonic technique in methylene chloride over a period of 30 min, followed by purification with silica (Reynier et al., 2013).2.5.10 Trace metal analysis
Trace metal analysis of the sample was performed by atomic emission spectrometry -inductively coupled plasma (ICP-AES). The employed device was a Vista AX Model CCO Simultaneous ICP-AES (Varian, USA). Most of the metals (Al, As, Ba, Ca, Cd, Cr, Cu, Fe, K, Mg, Mn, Mo, Na, Ni, Pb, Se, Sn and Zn) were analyzed simultaneously after complete sample mineralization . In brief, one g of sample was placed in a 50-mL beaker and dried at 105 ± 1 °C. Later, 4 mL of nitric acid 50% (v/v) and 10 mL of hydrochloric acid 20% (V/V) were added and the beaker was covered with a watch glass and refluxed for 30 min without stirring. Afterward, the sample was allowed to cool down. Finally, the sample was filtered in a 100-mL volumetric flask and the mixture volume was increased to 100 mL with deionized water.2.5.11 Fourier transform infrared (FT-IR) spectroscopy
FT-IR spectra were recorded using a Nicole IS50 FT-IR Spectrometer (Thermo Scientific, USA) through attenuated total reflectance (ATR) using 4 cm−1 resolution and 32 scans per spectrum in the range of 400–4000 cm−1. For taking the spectra, enough sample was placed on the diamond crystal and the gripper plate was placed on the sample to ensure that consistent contact was achieved between the crystal and the sample. The measurement was taken 16 times for each trial and their average was plotted.
2.5.12 Cation exchange capacity (CEC)
CEC describes the holding capacity of the sample for positively-charged elements (cations). The CEC is calculated from the levels of potassium, magnesium, calcium and sodium which were measured using ICP analysis (Ross, 1995).
2.5.13 Specific gravity
The specific gravity of the optimized sample was measured according to ASTM D 854. An empty clean and dry pycnometer were weighed (WP) and 10 g of dry sample was placed in the pycnometer and weighed again (WPS). Distilled water was added to fill about half to three-fourth of the pycnometer and the sample was soaked for 10 min. Later, the pycnometer was filled with distilled water and the contents were weighed (WB). An empty, clean and dry pycnometer was filled with distilled water and weighed (WA). Finally, the specific gravity of the solid sample was calculated using the following equation: where: W0 = weight of sample (g) = WPS−WP WA = weight of pycnometer filled with water WB = weight of pycnometer filled with water and sample
2.5.14 X-ray diffraction (XRD)
Powder X-ray diffraction patterns of ground biochar with and without precooling (at −80 °C) were collected using a D5000 diffractometer (Siemens, Germany). The diffractometer was operated at 40 kV and 40 mA using Cu Kα radiation source. Diffractograms were in the range of 4°–70° (2θ scale) at a step size of 0.02° and a counting time of 1.2 s per step.2.6 Statistical analyses
The design of experiments and statistical analysis were performed using STATISTICA, STAT SOFT trial version 10 (StatSoft Inc.., USA). Analysis of variance (ANOVA) was used to test the significance of the difference between according to the method detailed in 3030I (APHA, 1999) (1)average sizes of biochar samples. The difference was considered significant at p < 0.05 (significance level or α was fixed to 0.05).
2.7 Adsorption study
Adsorption study of carbamazepine on produced nanobiochar was performed to evaluate the performance of nanobiochar in one of the promising applications i.e. removal of micropollutants from water and wastewater. For this test, 5 mg of nanobiochar was added to flasks containing 100 mL of 5 ppb carbamazepine in Milli-Q water. During 24 h, samples were taken at different intervals and after centrifugation at 11,000× g for 20 min, the concentration of carbamazepine in supernatants were quantified using LDTD-MS-MS (Laser Diode Thermal Desorption-Mass Spectroscopy) method. The details of the method were explained elsewhere (Mohapatra et al., 2012). For comparison, the same procedure was performed for raw biochar and commercial activated carbon.
3 Results and discussion
3.1 Particle size distributions
RSM was used along with a central composite design to model ball milling. Statistical analysis was done by ANOVA with the regression models are given below in Eq. (2).
where: Y, β0, Xi (or Xj). βi, βii, and βij are the predicted responses of the dependent variable, second-order reaction constant, independent variables, linear regression coefficient, the quadratic regression coefficient, and regression coefficient of interactions between two independent variables.
In order to evaluate the effect of different ball milling parameters on the average size of biochar samples, the volume mean size was selected as the input parameter for data analysis. The average of the three samples corresponding to each experiment are listed in Table 2. The volume means size values indicated that planetary ball mill can be used for the production of fine powders of biochar and at different ball milling conditions this value varied between 212.4 nm and 453.1 nm for biochar with an initial size of around 3 mm. The biggest particles were obtained in experiment 7 (7 h, 540 rpm, and 13 g), while the finest particles were observed in experiment 11 (1.6 h, 575 rpm and 10 g).
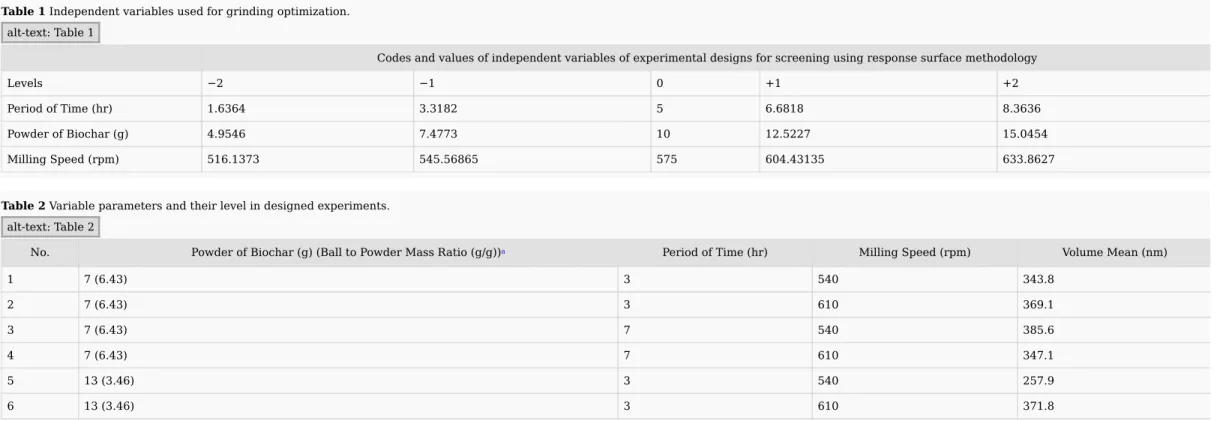
The effects of the independent variables (time, rotational speed and weight of powder) were analyzed according to the polynomial model. The standardized effects of these variables are illustrated in Fig. 3. Accordingly, the time and rotational speed have a significant influence on volume mean size. The linear effect estimate of time was positive (P = 0.004887) and its quadratic effect estimate was negative (P = 0.008973). Also, the effect estimate of interaction between time and rotational speed was significant and negative (P = 0.012327). It seems logic to have an interaction between these two parameters because increasing the rotational speed results in increasing the collision energy and frequency and finally decrease the required time for grinding. The weight of powder did not significantly affect the model since corresponding linear and quadratic effect estimate coefficients showed p values higher than the limit of probability acceptance (0.05). The statistical analysis of the regression coefficients showed an acceptable value (R2 = 0.78259) which meant that more than 78% of the variability can be explained by the developed model. Thus, the general model presented in Eq. (2) can be simplified considering only the significant effects (P < 0.05) and their regression coefficients and interactions into Eq. (3):
(2)
(3)
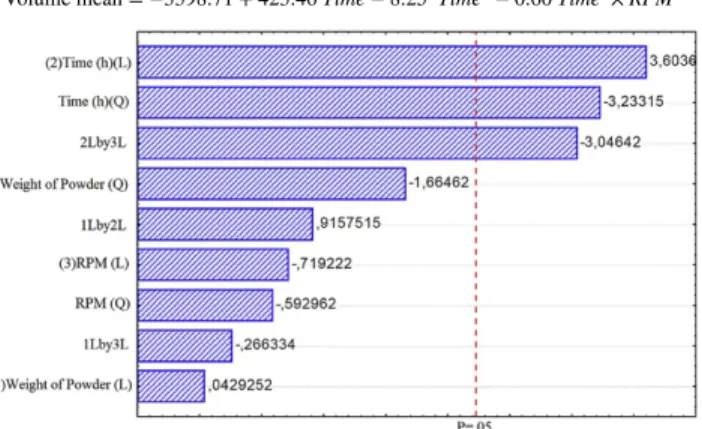
The two-dimensional response surfaces are plotted in Fig. 4 (a) and (b) based on the regression model given in Eq. (3). In Fig. 4 (a), a fitted response profile based on time is illustrated against rotational speed. Comparing the results of experiment 11 (1.6 h, 575 rpm and 10 g) and experiment 12 (8.4 h, 575 rpm and 10 g) in Table 2, at constant powder weight of 10 g and rotational speed of 575 rpm, the particles size increased from 212 nm to 436 nm when time increased from 1.6 h to 8.33 h. This trend was confirmed statistically in Fig. 4 (a) indicating that shorter grinding time led to a finer particle which could be due to the agglomeration in experiments in longer grinding time. Generally, the crystalline structure of materials undergoes considerable changes, such as amorphization due to high energy input in ball milling (Deguchi et al., 2006). Amorphization arises from defects accumulation in milled crystals which results in a highly defective crystalline phase. This phase is not physically stable and transforms into amorphous phase spontaneously. Increasing the amount of amorphous contents is reported to increase the surface energy which is the main reason for agglomeration. Therefore, agglomeration of particles with increasing milling cycles can be attributed to increasing surface energy of particles during milling (Shah et al., 2015). On the other hand, according to Fig. 4 (b) and comparing the results of 9 (5 h, 575 rpm, and 4.95 g) and 10 (5 h, 575 rpm and 15.1 g), it was observed that varying powder weight, had insignificant effect on particle size at shorter milling times. As a conclusion, Fig. 1
illustrated the possible important parameters responsible for the size of ball milling products. These parameters were investigated separately (not all of them together) in the literature. However, in this research, three parameters that we were able to vary simultaneously, were selected. From these three parameters, time and speed were found to be very important, but the ball/powder ratio showed lower variation in size compared to others. However, the selected range was still appropriate to obtain sub-micron particles as there are reports in the literature which indicated the importance of selecting an appropriate range for ball/powder ratio. For example, Munkhbayar et al. reported that increasing the rotational speed from 200 rpm to 500 rpm in dry grinding shortened the lengths of the multi-walled carbon nanotubes. In the range of 300–400 rpm, the plastic deformation originated from the impact of the milling balls that broke the particles and formed rough surfaces. However, at 500 rpm, dense agglomerates were observed in multi-walled carbon nanotubes that were attributed due to the high energy grinding process. (Munkhbayar et al., 2013). In another study, Munkhbayar et al. synthesized silica nanoparticles from the remaining ash of rice husk by using high energy planetary ball mill at room temperature. The average particle size of the silica powders was around 70 nm which decreased, as milling time or rotational speed increased. However, they reported that increasing the particle sizes by milling at higher speeds (500 rpm) which indicated the start point of agglomeration (Salavati-Niasari et al., 2013).
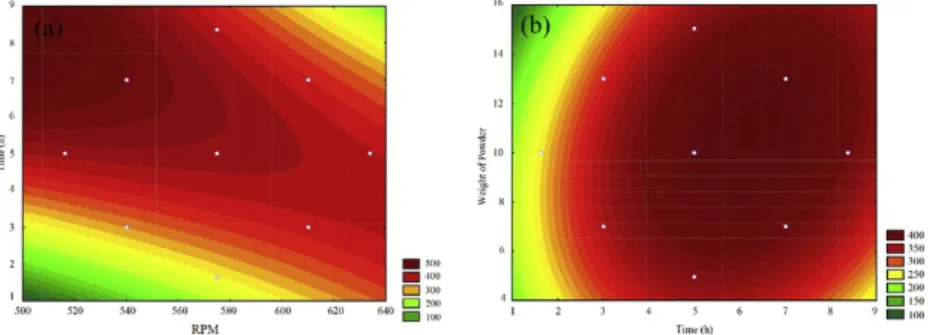
To confirm the possibility of agglomeration, samples were prepared prior to size measurement via two methods (with and without sonication). According to Fig. 5, the smaller particles obtained after sonication led to the agglomeration of biochar nanoparticles after grinding. The applied energy by ultrasonic apparatus caused the nanoparticles to separate from each other. However, repeating measurements in a short while (Data not shown) indicated that nanoparticles tend to agglomerate gradually again after sonication. This behavior was also reported for other nanomaterials. For example, Hong et al. investigated the thermal conductivity of Fe nanofluids and found that the thermal conductivity was reduced after stopping sonication which was due to agglomeration of nanoparticles. In another study, Mandzy et al. used ultrasonication to prepare stable dispersions of titania nanopowders. They observed that after sonication was stopped, nanoparticles reagglomerated back to 3-4 μm range (Hong et al., 2006; Mandzy et al., 2005). To the best of authors' knowledge, there is no reported study so far on the carbon nanoparticles and their aggregation.
alt-text: Fig. 3
Fig. 4 Effect of: (a) time of grinding and rotational speed and, (b) weight of powder and time, on the volume mean (nm) of nanobiochar. alt-text: Fig. 4
According to Shah et al., the surface energy of particles milled at cryogenic temperatures is lower than that of room temperature milling due to the inhibitory effect of low temperature on the formation of amorphous regions (Shah et al., 2015). In other words, amorphous regions have more surface energy and caused nanoparticles to agglomerate after milling.
Therefore, to assess the possibility of avoiding agglomeration, two experiments were performed at same conditions as an optimum sample (experiment 11, 1.6 h, 575 rpm and 10 g) except that biochar samples were kept at −20 °C and −80 °C for 24 h prior to milling. The conditions of experiment 11 were close to those of optimum sample offered by the software. Therefore, the subsequent experiments were performed on experiment 11. As observed in the XRD patterns of biochar sample ground with and without preconditioning (at −80 °C) in Fig. 6, both samples have turbostratic structure (Taheran et al., 2016). According to the analysis of diffractograms, the ratio of area under two characteristic peaks of graphitic crystallites (2θ = 6.4° and 2θ = 26.5°) to the total area of peaks for preconditioned sample was 64% higher than that of the sample without preconditioning. This indicated that preconditioned sample maintained its crystallinity when compared to the sample without preconditioning.
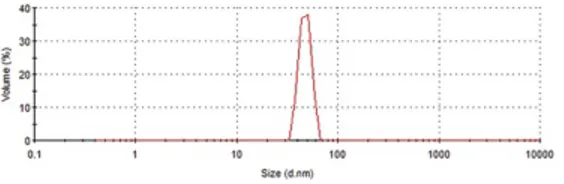
The size measurements were performed without sonication step and the results were listed in Table 3. According to this table the particle size of samples, kept at −20 °C and −80 °C prior to milling process, were 102.5 and 60.1 nm. In Fig. 7, the volume-based particle size distribution for the sample obtained in experiment 11 (1.6 h, 575 rpm, and 10 g) (preconditioned at - 80 °C) is illustrated. According to this histogram, almost all of the particles were in the range of 30–80 nm.
Table 3 Grinding with different condition. alt-text: Table 3
Level Volume mean (nm) Condition
11 212.4 Grinding 11 102.5 - 20
°
C+
Grinding Fig. 5 Volume mean diameter (nm) after grinding (black bars) and after grinding with sonication (gray bars). alt-text: Fig. 5 Fig. 6 XRD patterns of ground biochar with and without preconditioning (pattern for preconditioned sample is shifted by +200 counts for better discrimination). alt-text: Fig. 6
11 60.1 - 80
°
C+
Grinding
It indicates that cryogenic conditioning of samples followed by ball milling process is an efficient method for production of nanosized biochar. Due to increasing stringent laws for environmental protection, a combination of cryogenic treatment and ball milling can evolve into a green and robust method for production of different nanoparticles in a top-down approach. However, more investigation is needed to obtain knowledge for tuning and standardization of the whole process.
3.2 Physical and hydraulic properties
Water-holding capacity was determined for nanobiochar and shown along with the initial moisture content and specific gravity of the sample in Table 4. Most of the characteristics of produced nanoparticle are within the ranges reported in the literature (Ghani et al., 2013; Yargicoglu et al., 2015). However, several parameters such as water holding capacity were superior to the reported range which is important for agricultural applications.
Table 4 Chemical, Physical and hydraulic properties for biochars. alt-text: Table 4
Property Nanobiochar (This study) Data from Literature (Ghani et al., 2013; Yargicoglu et al., 2015)
Specific gravity 0.40
±
0.02 0.59 to 1.65Moisture content (%) 2.11
±
0.07 1.98 to 66.2WHCa (g H
2O/g biochar) 9.75
±
0.45 0.005 to 6.64LOIb organic matter content (%) 96.9
±
3.4 32.3 to 97.5Volatile matter content (%) 96.9
±
4.2 28.0 to 74.1 Ash content (%) 2.0±
0.1 1.5 to 65.7 Fixed C content (%) 1.06±
0.07 0 to 40.3 pH 6.61±
0.35 6.24 to 8.86 ORPc (mV) 132±
4 −120.8 to 74.2 ECd (μ
scm−1) 1737±
28 7 to 4150 Zeta potential (mV) −31.3±
2.6 −31.0 to −15.4∑
PAHse (mg kg−1) 26.837±
3.291 0.68 to 83 CECf meq/100 14.8±
1.2 15–
25 Elemental analysis: C (%) 83.1±
2.5 23.5 to 78.1 Fig. 7 Size distribution by volume. alt-text: Fig. 7H (%) 3.5
±
0.11 0.4 to 3.8 N (%) <1 0.01 to 0.4 H:C (Molar ratio) 0.5 0.12 to 0.63 C:N (Molar ratio) >96.9 143.4 to 5513.9 aWater holding capacity. bLoss on ignition. cOxidation-reduction potential. dElectrical conductivity. ePolycyclic aromatic hydrocarbons. fCation Exchange Capacity.3.3 Surface area
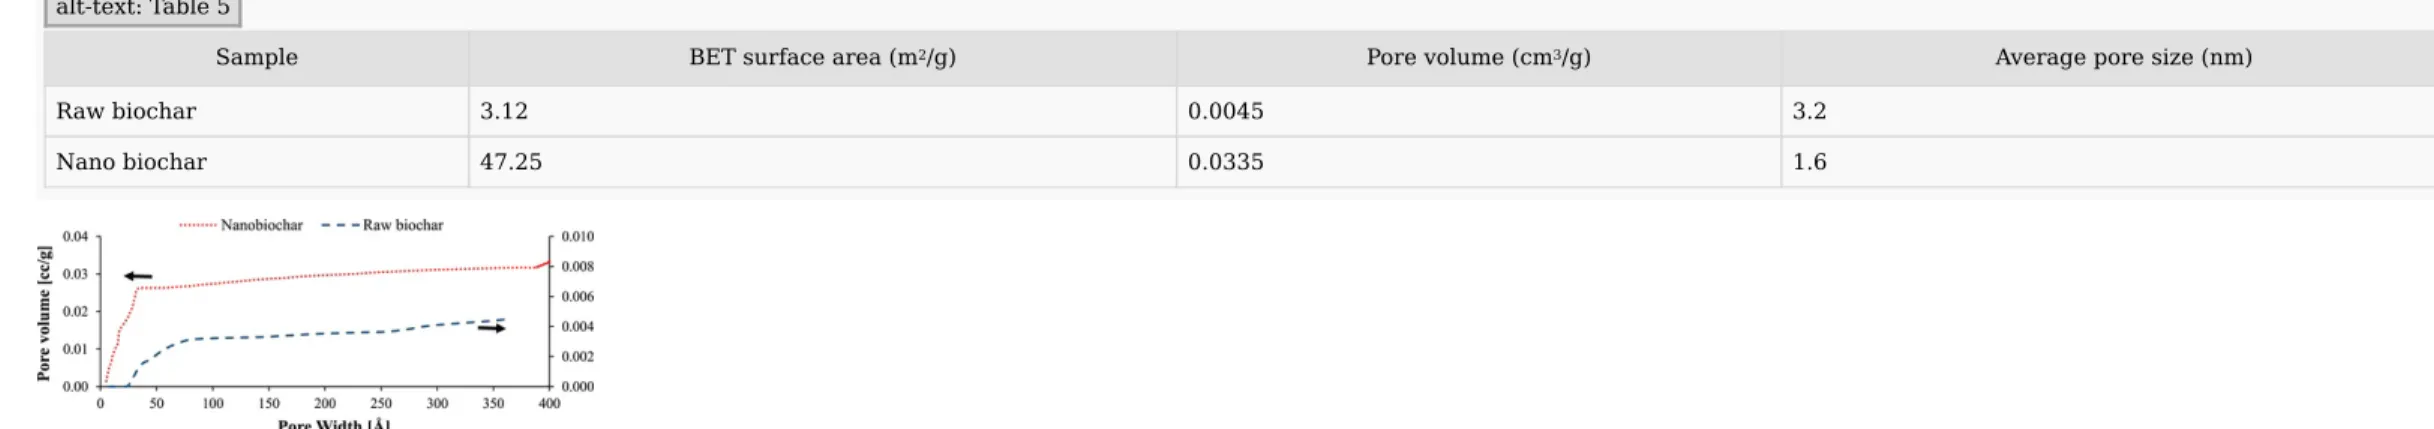
A detailed BET analysis consisting of the specific surface area, average pore size and pore volume is summarized in Table 5. According to these results, the milled biochar particles showed higher surface area and pore volume compared to raw biochar. The adsorption isotherms plotting cumulative pore volume versus pore diameter and cumulative surface area versus pore diameter for raw biochar and nanobiochar are shown in Figs. 8 and 9.
Table 5 Comparison of BET analysis of pinewood biochars. alt-text: Table 5
Sample BET surface area (m2/g) Pore volume (cm3/g) Average pore size (nm)
Raw biochar 3.12 0.0045 3.2 Nano biochar 47.25 0.0335 1.6 Fig. 8 Cumulative pore volume vs. Pore diameter for raw biochar (blue line) and nanobiochar (red line). (For interpretation of the references to colour in this figure legend, the reader is referred to the web version of this article.) alt-text: Fig. 8 Fig. 9 Cumulative surface area vs. Pore diameter for raw biochar (blue line) and nanobiochar (red line). (For interpretation of the references to colour in this figure legend, the reader is referred to the web version of this article.) alt-text: Fig. 9
Higher surface area of nanobiochar was contributed by its micropores area (pore with a diameter of less than 2 nm) and it has a significant effect on water adsorption capacity (Ghani et al., 2013). Also, a higher surface area in biochar was shown to improve the sorption affinity for a variety of organic materials including phenolic compounds, polyaromatic hydrocarbons, pesticides, herbicides and humic acids (Kasozi et al., 2010). Furthermore, microporosity and high specific surface area of biochar are suggested to play a role in the inhibition of mineralization of the soil organic matter. The suggested mechanism is the diffusion and sorption of organic matters into the micropores, where they are protected against mineralization (Ameloot et al., 2013).
The raw biochar had fewer pores in the full test range of 0–400 Å pore size and therefore, it showed a lower cumulative pore volume. Nanobiochar possessed uniform pores with relatively small sizes below 35 Å and the average pore size was 16.3 Å. In contrast, raw biochar showed pores with sizes up to 85 Å and the average pore size of 31.6 Å. It indicated that the milling process removed large pores that existed in the original biochar. It is noteworthy that a small number of random macropores also existed in both samples. Hence, cumulative pore volume was used in Fig. 8 to facilitate the comparison of pore distribution over the pore size range.
The N2 adsorption isotherms (Fig. 10) indicated that raw biochar had significantly lower N2 adsorption capacity than nanobiochar so that at 0.99 P/Po the total pore volume of raw biochar was 0.0062 mL/g while for nanobiochar, it was 0.0385 mL/g.
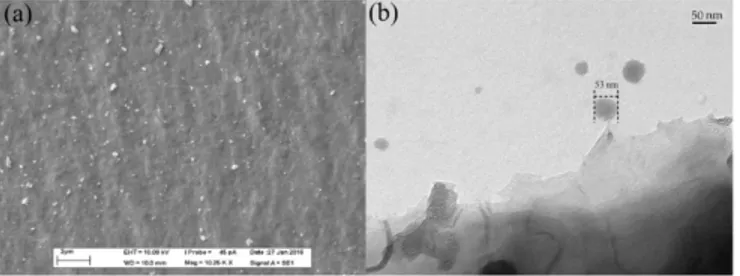
3.4 Electron microscopy analysis
SEM and TEM micrographs of produced nanobiochar at 10 KX and 40 KX magnifications are depicted in Fig. 11. These micrographs indicated that biochar nanoparticles are polygonal in shape and most of them were less than 100 nm in size though there were few agglomerates with several hundred nanometers in size (Not shown in the figure). Similarly, Gnaneshwar and Sabarikirishwaran reported the irregular morphologies of sub-micron carbon particles obtained from crushing of burnt coconut shell in a mortar (Gnaneshwar and Sabarikirishwaran, 2015).
3.5 Organic matter, volatile matter, ash and fixed carbon content
Percentages of volatile matter, ash, fixed carbon and organic carbon of nanobiochar are given in Table 4. As shown in Table 4 the amount of volatile matter is higher than reported range in literature. Consequently, ash content is low which is an advantage because it causes lower pollution to the environment (Ghani et al., 2013).
3.6 pH, ORP, EC and zeta potential
Table 4 presents pH, ORP, EC, and zeta potential values of produced nanobiochar. EC and pH are dependent on the utilized feedstock and also the carbonization temperature. Bagreev et al. showed that for biochars produced
Fig. 10 Nitrogen adsorption isotherms at 77 K for raw and nano-biochar (P/P0 is the partial pressure of nitrogen and the adsorbed gas onto nanobiochar is measured as a function of P/P0).
alt-text: Fig. 10
Fig. 11 a: SEM and b: TEM micrographs of nanobiochar at 10 KX and 40 KX magnification, respectively. alt-text: Fig. 11
between 400 °C and 600 °C, the pH and EC increased with increasing production temperature (Bagreev et al., 2001). Typical feedstock, such as coal, wood and coconut shells produce more acidic carbons, however, biochars obtained from plant or animal waste generally possess higher pH which reflect the presence of salts of base metals (Mullen et al., 2010). The higher pH biochars have been proved to provide a positive liming effect on acidic soils and to release base cations to the soil (Fryda and Visser, 2015; Mullen et al., 2010). The positive ORP value of the nanobiochar indicated that it tended to gain electron and act as an oxidizing agent. The zeta potential reflects the surface charge of the particles and the higher magnitude of this parameter is in favor of preventing agglomeration. The zeta potential of nanobiochar was −31.3 ± 2.6 mV which falls on the border of instability (10-30 mV) and moderate stability (30-40 mV) (Dixit, 2011).
3.7 Elemental composition
The elemental composition of nanobiochars was evaluated through measuring C, N and H in the sample and the weight percentages of C, H and N are given in Table 4. Also, the molar ratios of C:N and H:C are presented in this table as they represented the extent of biomass carbonization. Biochars with lower H:C ratios and higher C:N underwent higher thermal alteration as a result of greater outgassing of H and N comparing to C.
3.8 PAH and metal content
The total content of PAHs was 26.837 mg kg−1 in nanobiochar. Naphthalene, a highly volatile and low-weight PAH, accounted for the majority (around 68%) of detected PAHs in the nanobiochar with a concentration of 18.204 mg kg−1 of the sample. It was consistent with the results obtained in previous studies, in which naphthalene was the dominant PAH in wood-based chars, especially with shorter times of pyrolysis (Hale et al., 2012; Kloss et al.,
2012). The total concentration of metals in nanobiochar was measured to be 5.92 g kg−1 among which 89% was for non-toxic and 11% was for toxic metals. Fig. 12 depicted the concentrations of toxic and non-toxic metals, and Fig. 13 showed the PAH concentrations for nanobiochars. Generally, the least amounts of PAH and metals are desirable because of their leaching potential into the environment. Note: Content of Naphthalene consists of Naphthalene, 2- Methyl Naphthalene, 1- Methyl Naphthalene, 1, 3 Dimethylnaphthalene and 2, 3, 5-Trimethyl Naphthalene.
3.9 FTIR analysis
Fig. 12 Toxic (black bars) and non-toxic (gray bars) metal concentrations of nanobiochar in mg kg−1. alt-text: Fig. 12 Fig. 13 Polyaromatic hydrocarbons (PAHs) concentrations detected in nanobiochars in mg kg−1. alt-text: Fig. 13FTIR spectra for the raw biochar and also for the nanobiochar samples are shown in Fig. 14. Generally, the FTIR spectra of the two sample were same in pattern and intensity indicating that ball milling did not affect the chemical structure of biochar. In the two spectra, there were four significant bands at 3324 cm−1 (alcohol, O
H stretching), 1582 (alkene/aromatic, C C stretching), 1185 (phenolic, C O stretching), and 872 (aromatic, C
H out of plane bending) cm−1. The presence of phenolic groups in biochar suggests that the alkalinity of biochar was low since phenolic groups enhance the acidity in the biochar (Lopez-Ramon et al., 1999). These results were consistent with pH measurements (pH 6.61).
3.10 Cation exchange capacity (CEC)
CEC was calculated to be 14.8 meq/100 g and calcium was the major contributor. Biochar with higher CEC will be able to increase the nutrient holding capacity and exchange properties of soils (Inyang et al., 2010). The CEC of produced nanobiochar is almost in the same range reported by other researchers. The CEC value is strongly dependent on type and content of functional groups such as hydroxyl, carboxyl, phenol and carbonyl. However, reducing the size of particles down to nano-region can facilitate the exchange of cations by increasing the surface area and also reducing the mass transport resistance (Liang et al., 2006).
3.11 Energy consumption calculation
Energy consumption for production of 10 g nanobiochar was calculated for experiment 11 (1.6 h, 575 rpm) since the best result was obtained for these conditions. The sample was examined for three different scenarios: 1) only grinding; 2) grinding plus 60 min sonication and; 3) conditioning at −80 °C plus grinding. The power of grinding was calculated by Eq. (4) (Magini et al., 1998).
where Pcal is the power consumption during milling predicted by the collision model, mb and nb are the mass and number of balls used in a given experiment, wp and Rp the speed and the radius of the planetary mill disk. P* is a dimensional coefficient depending on the geometry of mill and on the elasticity of collisions. P∗ was obtained from the graph provided by Magini et al. (1998). For the freezer, it was assumed that the whole freezer was filled with biochar and the average energy consumption reported by the manufacturer (17 KWh/day) was divided by the mass of biochar (79 kg) to obtain the required energy for reducing the temperature of 1 g biochar from ambient to −80 °C and keeping it at this temperature for 24 h. For sonication system, the nominal power consumption of instrument (provided by the manufacturer) was multiplied by amplitude ratio (30%) and working time (60 min) to obtain the required energy. The details of the assumptions, equations and calculations are explained in supplementary material (S1).
Results from Table 6 showed that production of nanobiochar through cryogenic pre-conditioning not only led to more stable nanoparticles but also saved a considerable amount of energy compared to when using ultrasonic post-treatment. Table 6 Energy consumption for different scenarios of biochar nanoparticle production. alt-text: Table 6 No Description Energy consumption (KJ/g) Fig. 14 FT-IR spectra of raw and nano biochar (AU: Arbitrary unit). alt-text: Fig. 14 (4)
1 Grinding 71
2 Grinding
+
Sonication 198
3 Freezing
+
Grinding 72
3.12 Adsorption study
The adsorption curves for raw biochar, nanobiochar and commercial activated carbon are illustrated in Fig. 15. Raw biochar did not adsorb more than 14% of dissolved carbamazepine even after 24 h of contact time at room temperature while nanobiochar could adsorb more than 98% after 3 h which showed the effect of size reduction and surface area enhancement. Same adsorption efficiency was obtained for activated carbon in a shorter time. Yu et al. studied the effectiveness of two granular activated carbons (coal-based and coconut-based) for the removal of carbamazepine from water and reported up to 97% removal efficiency after 12 days (Yu et al., 2005). In another work, Cai et al. investigated graphene oxide powders for adsorption of carbamazepine and obtained 95% of removal efficiency after 24 h (Cai and Larese-Casanova, 2014). Also, Oleszczuk et al. employed multi-walled carbon nanotube for removal of carbamazepine from water and obtained up to 90.6% removal after 24 h (Oleszczuk et al., 2009). Comparing the removal efficiency of nanobiochar with the data reported by other researchers, it can be implied that nanobiochar with its green origin is capable of competing with activated carbon or other carbonaceous materials where their production involves using chemical reagent.
4 Conclusion
In this study, green production of nanobiochar by using a planetary ball mill was statistically investigated. A central composite design along with response surface methodology was employed to analyze the results. The ANOVA indicated that among studied parameters, linear and quadratic effects of time and also the interaction effect of time and rotational speed were significant contributors to particle size. Further studies showed that conditioning the samples at cryogenic temperatures prior to milling inhibited nanoparticles agglomeration. Finally, at optimum milling parameters (1.6 h, 575 rpm and 4.5 g/g ball to powder ratio) and conditioning at −80 °C nanobiochar with the average particle size of 60 nm was achieved. The adsorption study of nanobiochar for removal of a model micropollutant from water showed that produced nanobiochar has higher adsorption capacity compared to raw biochar and it can compete with commercial activated carbon for removal of carbamazepine from the water.
Acknowledgements
The authors are sincerely thankful to the Natural Sciences and Engineering Research Council of Canada (Discovery Grant 355254 and Strategic Grants), and Ministère des Relations internationales du Québec (122523) (coopération Québec-Catalanya 2012–2014) for financial support. INRS-ETE is thanked for providing Mr. Mehrdad Taheran “Bourse d'excellence” scholarship for his Ph.D. studies. The views or opinions expressed in this article are those of the authors.
Appendix A. Supplementary data
Supplementary data related to this article can be found at http://dx.doi.org/10.1016/j.jclepro.2017.07.084.References
Fig. 15 Residual concentration of carbamazepine versus time plot of carbamazepine adsorption onto nanobiochar, raw biochar, and activated carbon. alt-text: Fig. 15Ameloot N., Graber E.R., Verheijen F.G.A. and De Neve S., Interactions between biochar stability and soil organisms: review and research needs, Eur. J. Soil Sci. 64, 2013, 379–390. Awasthi K., Kamalakaran R., Singh A.K. and Srivastava O.N., Ball-milled carbon and hydrogen storage, Int. J. Hydrogen Energy 27, 2002, 425–432. Bagreev A., Bandosz T.J. and Locke D.C., Pore structure and surface chemistry of adsorbents obtained by pyrolysis of sewage sludge-derived fertilizer, Carbon 39, 2001, 1971–1979. Cai N. and Larese-Casanova P., Sorption of carbamazepine by commercial graphene oxides: a comparative study with granular activated carbon and multiwalled carbon nanotubes, J. Colloid Interface Sci. 426, 2014, 152–161. Charkhi A., Kazemian H. and Kazemeini M., Optimized experimental design for natural clinoptilolite zeolite ball milling to produce nano powders, Powder Technol. 203, 2010, 389–396. Chen Y., Fitz Gerald J., Chadderton L.T. and Chaffron L., Nanoporous carbon produced by ball milling, Appl. Phys. Lett. 74, 1999, 2782–2784. Deguchi S., Mukai S.-A., Tsudome M. and Horikoshi K., Facile generation of fullerene nanoparticles by hand-grinding, Adv. Mater 18, 2006, 729–732. Derringer G., Simultaneous optimization of several response variables, J. Qual. Technol. 12, 1980, 214–219. Dixit C.K., Surface Modification and Conjugation Strategies for Bioassay/biomaterial Applications, 2011, Dublin City University; Dublin 9, Ireland. Fryda L. and Visser R., Biochar for soil improvement: evaluation of biochar from gasification and slow pyrolysis, Agriculture 5, 2015, 1076. Ghani W.A.W.A.K., Mohd A., da Silva G., Bachmann R.T., Taufiq-Yap Y.H., Rashid U. and Al-Muhtaseb A.A.H., Biochar production from waste rubber-wood-sawdust and its potential use in C sequestration: chemical and physical characterization, Ind. Crops Prod. 44, 2013, 18–24. Gnaneshwar P.V. and Sabarikirishwaran P., Structural and morphological study of carbon nanoparticles synthesized using oxidation, thermal decomposition and solvo chemical methods, Int. J. Chem. Tech. Res. 7, 2015, 1465–1473. Hale S.E., Lehmann J., Rutherford D., Zimmerman A.R., Bachmann R.T., Shitumbanuma V., O'Toole A., Sundqvist K.L., Arp H.P.H. and Cornelissen G., Quantifying the total and bioavailable polycyclic aromatic hydrocarbons and dioxins in biochars, Environ. Sci. Technol. 46, 2012, 2830–2838. Hong K.S., Hong T.-K. and Yang H.-S., Thermal conductivity of Fe nanofluids depending on the cluster size of nanoparticles, Appl. Phys. Lett. 88, 2006, 031901. Huang J.Y., Yasuda H. and Mori H., Highly curved carbon nanostructures produced by ball-milling, Chem. Phys. Lett. 303, 1999, 130–134. Inyang M., Gao B., Pullammanappallil P., Ding W. and Zimmerman A.R., Biochar from anaerobically digested sugarcane bagasse, Bioresour. Technol. 101, 2010, 8868–8872. Inyang M., Gao B., Zimmerman A., Zhang M. and Chen H., Synthesis, characterization, and dye sorption ability of carbon nanotube–biochar nanocomposites, Chem. Eng. J. 236, 2014, 39–46. Kasozi G.N., Zimmerman A.R., Nkedi-Kizza P. and Gao B., Catechol and humic acid sorption onto a range of laboratory-produced black carbons (biochars), Environ. Sci. Technol. 44, 2010, 6189–6195. Kesavan A. and Venkatraman G., Nanotechnology and its applications, Scitech J. 1, 2014, 1–2. Kloss S., Zehetner F., Dellantonio A., Hamid R., Ottner F., Liedtke V., Schwanninger M., Gerzabek M.H. and Soja G., Characterization of slow pyrolysis biochars: effects of feedstocks and pyrolysis temperature on biochar properties, J. Environ. Qual. 41, 2012. Lehmann J. and Joseph S., Biochar for Environmental Management: Science, Technology and Implementation, 2015, Routledge. Liang B., Lehmann J., Solomon D., Kinyangi J., Grossman J., O'Neill B., Skjemstad J.O., Thies J., Luizão F.J., Petersen J. and Neves E.G., Black carbon increases cation exchange capacity in soils, Soil Sci. Soc. Am. J. 70, 2006. Lopez-Ramon M.V., Stoeckli F., Moreno-Castilla C. and Carrasco-Marin F., On the characterization of acidic and basic surface sites on carbons by various techniques, Carbon 37, 1999, 1215–1221. Magini M., Colella C., Iasonna A. and Padella F., Power measurements during mechanical milling-II. The case of “single path cumulative” solid state reaction, Acta Mater 46, 1998, 2841–2850. Mandzy N., Grulke E. and Druffel T., Breakage of TiO2 agglomerates in electrostatically stabilized aqueous dispersions, Powder Technol. 160, 2005, 121–126.
Mohapatra D.P., Brar S.K., Tyagi R.D., Picard P. and Surampalli R.Y., Carbamazepine in municipal wastewater and wastewater sludge: ultrafast quantification by laser diode thermal desorption-atmospheric pressure chemical ionization coupled with tandem mass spectrometry, Talanta 99, 2012, 247–255. Mullen C.A., Boateng A.A., Goldberg N.M., Lima I.M., Laird D.A. and Hicks K.B., Bio-oil and bio-char production from corn cobs and stover by fast pyrolysis, Biomass Bioenergy 34, 2010, 67–74. Munkhbayar B., Nine M.J., Jeoun J., Bat-Erdene M., Chung H. and Jeong H., Influence of dry and wet ball milling on dispersion characteristics of the multi-walled carbon nanotubes in aqueous solution with and without surfactant, Powder Technol. 234, 2013, 132–140. Naghdi M., Taheran M., Brar S.K., Verma M., Surampalli R.Y. and Valero J.R., Green and energy-efficient methods for the production of metallic nanoparticles, Beilstein J. Nanotechnol. 6, 2015, 2354–2376. Oleszczuk P., Ćwikła-Bundyra W., Bogusz A., Skwarek E. and Ok Y.S., Characterization of nanoparticles of biochars from different biomass, J. Anal. Appl. Pyrolysis 121, 2016, 165–172. Oleszczuk P., Pan B. and Xing B., Adsorption and desorption of oxytetracycline and carbamazepine by multiwalled carbon nanotubes, Environ. Sci. Technol. 43, 2009, 9167–9173. Pierard N., Fonseca A., Konya Z., Willems I., Van Tendeloo G. and Nagy J.B., Production of short carbon nanotubes with open tips by ball milling, Chem. Phys. Lett. 335, 2001, 1–8. Reynier N., Blais J.-F., Mercier G. and Besner S., Treatment of arsenic-, chromium-, copper- and pentachlorophenol-polluted soil using flotation, Water, Air, Soil Pollut. 224, 2013, 1–12. Ross D.S., Recommended Methods for Determining Soil Cation Exchange Capacity. Delaware Cooperative Extension, 1995, College of Agriculture, University of Delaware; Newark, DE.,. Salavati-Niasari M., Javidi J. and Dadkhah M., Ball milling synthesis of silica nanoparticle from rice husk ash for drug delivery application, Comb. Chem. High. Throughput Screen. 16, 2013, 458–462. Shah U.V., Wang Z., Olusanmi D., Narang A.S., Hussain M.A., Tobyn M.J. and Heng J.Y.Y., Effect of milling temperatures on surface area, surface energy and cohesion of pharmaceutical powders, Int. J. Pharm. 495, 2015, 234–240. Sulaiman G.M., Mohammed W.H., Marzoog T.R., Al-Amiery A.A. and Kadhum A.H., Green synthesis, antimicrobial and cytotoxic effects of silver nanoparticles using Eucalyptus chapmaniana leaves extract, Asian Pac. J. Trop. Biomed. 3, 2013, 58–63. Taheran M., Naghdi M., Brar S.K., Knystautas E.J., Verma M., Ramirez A.A., Surampalli R.Y. and Valero J.R., Adsorption study of environmentally relevant concentrations of chlortetracycline on pinewood biochar, Sci. Total Environ. 571, 2016, 772–777. Xiao D., Yuan D., He H. and Gao M., Microwave assisted one-step green synthesis of fluorescent carbon nanoparticles from ionic liquids and their application as novel fluorescence probe for quercetin determination, J. Lumin 140, 2013, 120–125. Yao Y., Gao B., Inyang M., Zimmerman A.R., Cao X., Pullammanappallil P. and Yang L., Biochar derived from anaerobically digested sugar beet tailings: characterization and phosphate removal potential, Bioresour. Technol. 102, 2011, 6273–6278. Yargicoglu E.N., Sadasivam B.Y., Reddy K.R. and Spokas K., Physical and chemical characterization of waste wood derived biochars, Waste Manag. 36, 2015, 256–268. Yu Z., Peldszus S., Anderson W.B. and Huck P.M., Adsorption of selected pharmaceuticals and endocrine disrupting substances by GAC at low concentration levels, In: Water Quality Technology Conference Proceedings, WQTC (2005), 2005, 1–16. Zhang M., Gao B., Yao Y. and Inyang M., Phosphate removal ability of biochar/MgAl-LDH ultra-fine composites prepared by liquid-phase deposition, Chemosphere 92, 2013, 1042–1047. Zhang M., Gao B., Yao Y., Xue Y. and Inyang M., Synthesis, characterization, and environmental implications of graphene-coated biochar, Sci. Total Environ. 435, 2012, 567–572.