HAL Id: hal-00480374
https://hal.archives-ouvertes.fr/hal-00480374
Submitted on 5 May 2010
HAL is a multi-disciplinary open access
archive for the deposit and dissemination of
sci-entific research documents, whether they are
pub-lished or not. The documents may come from
teaching and research institutions in France or
abroad, or from public or private research centers.
L’archive ouverte pluridisciplinaire HAL, est
destinée au dépôt et à la diffusion de documents
scientifiques de niveau recherche, publiés ou non,
émanant des établissements d’enseignement et de
recherche français ou étrangers, des laboratoires
publics ou privés.
Pulse Rate Analysis in Case of Central Sleep Apnea: A
New Algorithm for Cardiac Rate Estimation
Quang Huy Nguyen, Ronan Le Page, Jean-Marc Goujon, Patrick Guyader,
Michel Billon
To cite this version:
Quang Huy Nguyen, Ronan Le Page, Jean-Marc Goujon, Patrick Guyader, Michel Billon. Pulse Rate
Analysis in Case of Central Sleep Apnea: A New Algorithm for Cardiac Rate Estimation. 31st annual
international conference on Engineering in Medicine and Biology Society (EMBS 2009), Sep 2009,
Minneapolis, MN, United States. pp.5490-5493. �hal-00480374�
Pulse Rate Analysis in Case of Central Sleep Apnea: A New Algorithm
for Cardiac Rate Estimation
Quang-Vinh Nguyen, Ronan Le Page, Jean-Marc Goujon, Patrick Guyader and Michel Billon
Abstract— This paper first describes the AM-FM demodu-lation of an arterial pressure signal. Although it is known to be efficient on signals modulated by breathing, we demonstrate that in case of lack of respiratory modulation (central sleep apnea), the AM-FM algorithm doesn’t perform well in heart rate extraction. We introduce then a new algorithm based on Singular Spectrum Analysis eigen values which performs better cardiac frequency estimation in this context. The error for cardiac frequency estimation is around 0.2 BPM (Beats Per Minute) versus 5.5 BPM for the AM-FM demodulation. Further experimentations will be performed (with this time both cardiac and respiratory assessments) and will deal with real sleep apnea cases.
I. INTRODUCTION
Cardiac and respiratory rates are useful information in sleep apnea disease management. Arterial pulse rate analysis often replaces electrocardiogram (ECG) devices with the advantage that it does not require a plurality of electrodes localized all around the body. In this context, we have designed a device, worn at the wrist for a great acceptability, that can be used to monitor people conditions (mainly heart and respiratory rates).
In [1], cardiac and respiratory rates have been successfully extracted from a single arterial pulse signal during sleep thanks to the AM-FM demodulation. In this paper, we deal with AM-FM demodulation and show the limitation of this technique in case of simulated sleep apnea. Then we introduce a new algorithm based on Singular Spectrum Analysis (SSA) eigen values in order to perform robust estimation for cardiac rate in this case.
Each algorithm is detailed and is able to provide both cardiac and respiratory frequency information. We compare the two algorithms in terms of mean error and standard deviation of the cardiac frequency thanks to a reference signal obtained from another device.
II. MATERIAL AND METHODS
We used the Biopac Systems Inc. MP100 device as the reference device with following sensors and actuators:
Q.-V. Nguyen, R. Le Page, J.-M. Goujon, M. Billon, and P. Guyader are with CNRS UMR 6082 (FOTON) Ecole´ Nationale Sup´erieure des Sciences Appliqu´ees et de Technologie, 6 rue de K´erampont BP 80518 22305 Lannion, FRANCE : nguyenqv@, lepage@, goujon@, billon@enssat.fr,
patrick.guyader@univ-rennes1.fr
• Optical photoplethysmography (PPG) of arterial beat pressure signal • Electrocardiogram (ECG) • Respiration belt Time (s) A mp litu d e ( a.u. ) 240 260 280 300 320 -2 0 2 4 6 8 10 PPG1 PPG2 ECG Respiration
Fig. 1. PPGs, ECG and respiration signals
Signals are recorded using AcqKnowledge Biopac Systems software. Data processing is performed off-line using MatLab and C programs and libraries. The sampling rate was set at 500 Hz during the 6 minutes total duration of measurements.
Figure 1 displays parts of the 4 recorded signals for the study: 2 PPGs, 1 ECG and 1 respiration signals. ECG signal was used by AcqKnowledge software to calculate the heart rate reference. Simulated apnea is performed by holding breath during one minute.
III. AM-FM DEMODULATION
Arterial pressure signal is amplitude and frequency mod-ulated by cardiac and respiratory contributions. The cardiac and respiratory information can be obtained by demodulating this signal [1]. The diagram we used to extract the heart and respiratory rates is described in Figure 2.
Bandpass filter [0.7;1.2] Hz Arterial pressure signal
AM-FM demodulation Bandpass filter [0.1;1] Hz Mean estimation In each RR interval Fourier transform Respiratory frequency Cardiac frequency
Fig. 2. AM-FM demodulation diagram
The pulse signal is first filtered through a Tchebychev filter of order 2. The AM-FM demodulation is performed to get the instantaneous frequency composed of cardiac frequency and an image of respiration signal. Then this signal is filtered and Fourier transform is calculated. The frequency of maximum amplitude is attributed to respiratory rate. Moreover, mean estimation in each RR interval of the pulse signal is calculated in order to also get heart rate information.
AM-FM demodulation is performed using Teager energy operator [1], [2], [3]. Depending on some constraints fulfill-ments, the discrete-time Teager energy operator, ψ, applied to the discrete signal x[n] (DESA-1a algorithm) is simply expressed by: ψ [x[n]] =x 2[n − 1] − x[n]x[n − 2] T2 s (1)
and gives directly frequency estimation fi[n]:
fi[n] ≈ 1 2π s ψ [ ˙x[n]] ψ [x[n]] (2) where (Ts is the sampling period) and ˙x[n] denotes the numerical estimation of the first derivative of x[n].
An exemple of cardiac frequency estimation is given on Figure 3 with results obtained from PPG signal itself (RR intervals counting), from Biopac AcqKnowledge software estimation (beat by beat) and AM-FM demodulation (mean estimation in each RR interval); the respiration signal is also drawn. During the simulated apnea, the heart rate first decreases and then increases. We can notice that the AM-FM demodulation tends to generally over estimate the heart rate and that the errors increase during the simulated apnea episode. Time (s) Amplitude (a.u.) Heart rate (BPM) 0 50 100 150 200 250 300 350 -6.5 -6 -5.5 -5 -4.5 0 50 100 150 200 250 300 350 50 60 70 80 90 PPG
AcqKnowledge Biopac Systems AM-FM demodulation (a)!
(b)!
Fig. 3. (a) Results for cardiac rate estimation obtained from PPG signal (continuous line), from AcqKnowledge Biopac Systems (thick dotted line) and from AM-FM demodulation (thin dotted line); (b) Respiration signal
IV. A NEW ALGORITHM FOR CARDIAC AND RESPIRATORY RATES ESTIMATION USING
SINGULAR SPECTRUM ANALYSIS
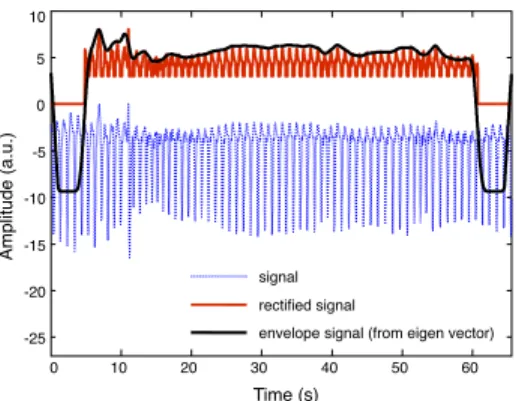
The algorithm used can be set as in Figure 4, with several optional processings like denoising, single phase rectification (cf. Figure 5) or iterative procedure when needed. Side effects are avoided by setting the beginning and the end of the signals as zeros, these parts are not taking into account by the algorithm.
Fig. 4. SSA algorithm for retrieving cardiac and respiratory information from a pulse signal
Amplitude (a.u.) ! Time (s)! 0 10! 20! 30! 40! 50! 60! -25! -20! -15! -10! -5! 0! 5! 10! signal! rectied signal!
envelope signal (from eigen vector)!
Fig. 5. Original signal and single phase rectifier procedure, beginning and end of the upper signal are set to zero in order to avoid side effects, the envelope extracted is also drawn
The original pulse signal x[n] of length N is cut in overlapping portion of length M. In other words, we reshape the original signal into the trajectory matrix A, whose rows are vectors of length M (sliding window over the signal x[n]).
A = x[1] x[2] . . . x[M] x[2] x[3] . . . x[M + 1] . . . .. ... x[N − M + 1] x[N − M + 2] . . . x[N]
SSA performs a Karhunen-Lo`eve decomposition of an estimate of the correlation matrix based on M lagged copies of the signal.
A key point is the choice of the length window M, for instance if we want to catch an oscillation pattern whose period is L samples, then we should try a M > L. There is also a trade-off with the calculation cost with large N/M. According to Vautard and Ghil [4] the value of M has to be choosen in the interval [1; N] (no optimal choice exists, so the value of M has to be tested over a reasonable range).
In our application, we want to catch both the respiratory component (AM modulation) of the arterial pulse signal and the heart rate.
The auto-covariance matrix is At A(wheret stands for the tranpose operator)
The unbiased estimator of the lag covariance matrix C is calculated : Ci(M)= 1 N− i N−i
∑
j=1 x[ j]x[ j + i] where i belongs to [0; M − 1]Then a Singular Value Decomposition (SVD) is performed in order to obtain a diagonal matrix of eigen values D sorted in decreasing order and a matrix of the associated eigen vectors V .
C= U D V0
These eigen vectors are called Empirical Orthogonal Func-tions (EOFs) [5] or Direction of Principal Components or Singular Vectors [6].
Reconstruction of the signal based upon a few selected eigen vectors can be applied (see [7] for details).
After the decomposition in eigen values and vectors, we can split them in several ways: eigen values can be grouped by pairs (oscillation) or alone (trend).
Another fact that is noticeable is that there are only a few eigen values with great value and a lot of eigen values with small one, only a few eigen vectors contain the majority of the signal energy, the others can be considered as noise contribution.
The empirical method for extracting heart rate information after a SSA transform uses the eigen values (with a scale factor correlated to M [4]).
Usually, the first eigen value (vector) is associated with the AM modulation, the next two eigen values can generally be associated with heart rate.
Figures 6 and 7 show examples of SSA eigen values and vectors obtained from a pulse signal and compared with the respiration signal. It can be also seen on Figure 7 that the demodulation is not always perfect for instance the respiratory signal still contains a small cardiac component.
Rank of eigen value or time (sample)!
Amplitude ( a.u. )! 0! 100! 200! 300! 400 0! 20! 40! 60! 80! Eigen value Eigen vector 1 Eigen vector 2 Eigen vector 3 Eigen vector 10
Fig. 6. Eigen values of SSA: only a few number of eigen values collect the major part of the signal energy, and a few associated eigen vectors. The first eigen value is associated with respiration, the second and third with heart rate Time (sample) A mp litu d e ( a.u. ) 10 15 600 800 1000 1200 1400 -5 0 5
Arterial pulse signal SSA rst eigen vector signal! SSA second eigen vector signal! Respiration signal
Fig. 7. An example of demodulation performed by Singular Spectrum Analysis: the reconstructed signal associated with the first eigen vector can be compared with the respiration signal (even if it still contains a small residual cardiac component), the other reconstructed signal also contains a respiratory component
Time (s) Amplitu d e ( a.u. ) Heart rate ( BPM ) -6.5 -6 -5.5 -5 -4.5 50 100 150 200 250 300 50 100 150 200 250 300 50 60 70 80 90 SSA AM-FM demodulation AcqKnowledge Biopac Systems (a)!
(b)!
Fig. 8. (a) Results for cardiac rate estimation obtained from SSA algorithm (thick continuous line), from AM-FM demodulation (dotted line) and from AcqKnowledge Biopac Systems (thin continuous line); (b) Respiration signal
Results are drawn in Figure 8, where we can see that this time the estimation of cardiac frequency remains robust even during the simulated sleep apnea episode.
V. RESULTS AND DISCUSSION
The results for heart rate estimation using the two methods (AM-FM demodulation and SSA) are shown in Table I. The mean error between SSA method and Biopac is 0.2 BPM while it reaches 5.5 BPM with the AM-FM demodulation with standard deviation around 5 for both cases.
TABLE I
COMPARISON RESULTS FOR HEART RATE ESTIMATION(MEAN ERROR AND STANDARD DEVIATION INBPM)
comparison results mean error standard (BPM) deviation
SSA / reference 0.2 4.8
AM-FM demodulation / reference 5.5 5
During the time of simulated apnea, the heart rate estima-tion from AM-FM demodulaestima-tion gave wrong results, this is due to the fact that there is no respiratory contribution in the pulse signal during this time. We can conclude that this kind of algorithm is not suitable for monitoring people prone to central sleep apnea.
Furthermore, all constraints defined in [1], [2], [3] are not always satisfied. So, it will not be possible to obtain an AM-FM demodulation of arterial signals without errors.
Although the SSA method has a higher calculation cost than the AM-FM demodulation due to the matrix computa-tions, it is not a limitative factor in our application.
Another drawback is that eigen values have to be properly scaled in order to be fitted to the correct range of values. In this case, eigen vectors can also be further exploited and can
be used to help to set this scale factor properly. This problem is currently under investigation since it can be solved in many ways.
SSA appears to be a powerful and promising tool for phys-iological signal processing with great potential applications in monitoring, denoising or processing signals with missing data [8]. SSA was also tested with ECG signals and showed performances similar to pulse signals.
VI. CONCLUSION AND FUTURE WORK In this paper, two algorithms for obtaining both heart and respiratory rates have been presented. Although algorithms gave respiratory information, we were not able to compare them with reliable reference (motion noise).
The AM-FM demodulation algorithm was first investi-gated in case of simulated sleep apnea: it was shown that it failed to determine the correct heart rate during simulated apnea episode.
A new algorithm was proposed here using Singular Spec-trum Analysis which performed better in case of simulated sleep apnea than the AM-FM demodulation algorithm. The mean error obtained is around 0.2 BPM for the SSA al-gorithm against 5.5 BPM for the AM-FM demodulation algorithm.
Future experimentations will take benefits on using Val-salva or Mueller maneuvers for improving simulated sleep apnea [9].
Further work will focus on establishing efficiency towards available database signals, especially for respiratory rate esti-mation. The device and the algorithm will also be employed with real sleep apnea signals. In this occasion, the behavior of the SSA algorithm will be evaluated with real central sleep apneas and also obstructive and mixed sleep apneas.
REFERENCES
[1] S. Bruno and P. Scalart, “Estimation of cardiac and respiratory rhythms based on AM-FM demodulation and an adaptive eigenvector decompo-sition,” 13th European Signal Processing Conference., vol. 7, no. 12, p. 05, 2005.
[2] P. Maragos, J. Kaiser, and T. Quatieri, “Energy separation in signal modulations with application to speech analysis,” IEEE Transactions on Signal Processing, vol. 41, no. 10, pp. 3024–3051, 1993. [3] P. Maragos, J. Kaiser, and T. Quatieri, “On amplitude and frequency
demodulation using energy operators,” IEEE Transactions on Signal Processing, vol. 41, no. 4, pp. 1532–1550, 1993.
[4] R. Vautard and M. Ghil, “Singular spectrum analysis in nonlinear dynamics, with applications to paleoclimatic time series,” Physica D: Nonlinear Phenomena, vol. 35, no. 3, pp. 395 – 424, 1989.
[5] M. Ghil, M. R. Allen, M. D. Dettinger, K. Ide, D. Kondrashov, M. E. Mann, A. W. Robertson, A. Saunders, Y. Tian, F. Varadi, and P. Yiou, “Advanced spectral methods for climatic time series,” Rev. Geophys, vol. 40, pp. 1–41, 2002.
[6] T. Schreiber, H. Kantz, J. Kurths, and G. Mayer-Kress, “Processing of physiological data,” Springer Series in Synergetics, 1998.
[7] R. Vautard, P. Yiou, and M. Ghil, “Singular-spectrum analysis: a toolkit for short, noisy chaotic signals,” in Conference proceedings on Interpretation of time series from nonlinear mechanical systems, (New York, NY, USA), pp. 95–126, Elsevier North-Holland, Inc., 1992. [8] D. H. Schoellhamer, “Singular spectrum analysis for time series with
missing data,” Geophysical Research Letters, vol. 28, no. 16, pp. 3187– 3190, 2001.
[9] D. Bartlett, “Effects of Valsalva and Mueller maneuvers on breath-holding time,” Journal of Applied Physiology, vol. 42, no. 5, pp. 717– 721, 1977.