Dielectric and Electromechanical Properties of
Barium and Zirconium Co-Doped Sodium Bismuth Titanate
by
Sossity A. Sheets
A.B. Earth Sciences, Dartmouth College, 1995 M.S. Earth Sciences, Dartmouth College, 1997
SUBMITTED TO THE DEPARTMENT OF MATERIALS SCIENCE AND ENGINEERING IN PARTIAL FULFILLMENT OF THE REQUIREMENTS FOR
THE DEGREE OF
MASTER OF SCIENCE IN MATERIALS SCIENCE AND ENGINEERING AT THE
MASSACHUSETTS INSTITUTE OF TECHNOLOGY
SEPTEMBER 2000
© 2000 Massachusetts Institute of Technology. All rights reserved.
Signature of Author:
Department of Materials Science and Engineering
August 4, 2000 Certified by: _
/'et-Ming Chiang Kyocera Pr'fessor of Ceramics Thesis Supervisor
Accepted by: C
I Carl V. Thompson
Stavros Salapatas Professor of Materials Science & Engineering Chairman, Departmental Committee on Graduate Students
MASSACHUSETTS INSTftE OF TECHNOLOGY OCT 2 6 2004 I ARCHIVES 1 7 _· · · _ · -J
-Dielectric and Electromechanical Properties of
Barium and Zirconium Co-Doped Sodium Bismuth Titanate
by
Sossity A. Sheets
Submitted to the Department of Materials Science and Engineering
on August 4, 2000
in Partial Fulfillment of the Requirements for the
Degree of Master of Science in Materials Science and Engineering
ABSTRACT
Compositional exploration was conducted within the alkaline bismuth titanate system by doping on the A- and B- sites with Ba'2and Zr'4, respectively. Results
on the phase, dielectric and electromechanical properties of single crystals and polycrystals for this new family of relaxor perovskite ferroelectrics are presented. The actuation and polarization characteristics in this system were found to be highly sensitive (within 2 mol%) to cation doping levels, and tailored
compositions successfully isolated predominantly electrostrictive actuation at room temperature. Ultra-high room temperature electrostriction was observed in co-doped (Ba + Zr) NBT polycrystals (NBT-14BT-4NBZ) and <100> single crystals (NBT-12BT-4NBZ), up to 0.24% and 0.45% strain, respectively, with negligible hysteresis at 0.05 Hz. Polycrystals with d33of up to 780 pC/N and single crystals with d33up to 2000 pC/N were measured. The low frequency actuation properties in the NBT-BT-NBZ compositions surpass highest reported values of strain and d33for polycrystalline PMN and PLZT and single crystal PMN conventional lead electrostrictors. Predominantly ferroelectric room temperature unipolar actuation in polycrystalline NBT-14BT-3NBZ at 0.05 Hz was observed to be linear and non-hysteretic, reaching up to 0.14% strain and d33 of 310 pC/N at 60 kV/cm. These low frequency properties match the reported strain and d33values for conventional PZT-8, PMNT, and PZT-5a hard
ferroelectrics and are more than double the reported values for polycrystalline NBT-BT (d33= 125 pC/N). Electrostrictive and ferroelectric compositions in the NBT-BT-NBZ system show the highest actuation strain and d33reported to date in any polycrystalline, lead-free composition.
Thesis Supervisor: Yet-Ming Chiang
Chapter 1.
Introduction 13
1.1 Piezoelectricity, Electrostriction and Ferroelectricity ... 13 .
1.2 Relaxor Complex Perovskites-- ...15
1.3 Lead-Based Electromechanical Materials 19 1.4 Alternatives to Lead-Based Electromechanical Materials 20 1.5 Research Objective ... 22
Chapter 2. Experimental Procedure ... 25
2.1 Polycrystalline Powder Preparation .. 26
2.2 Single Crystal Growth ... 31
2.3 Polycrystal and Single Crystal Sample Preparation for Testing . . 36...
2.4 Polycrystal and Single Crystal Sample Characterization ...38
2.4.1 Crystal Symmetry Determination by X-ray Diffraction ---38
2.4.2 Composition Analysis by Electron Microprobe- ---38
2.4.3 Sample Electroding ---
39
2.4.4 Dielectric Characterization by Impedance Analysis ...40
2.4.5 Electromechanical Characterization by Impedance Analysis ...45
2.4.6 Electromechanical Characterization Under Field 48 Chapter 3. Results I: Co-Doped Polycrystals --- 51
3.1 Composition, Phase and Density Analysis --- 51
3.2 Dielectric Properties of Polycrystalline (Ba + Zr) Co-Doped NBT 61 3.2.1 Room Temperature Dielectric Constant and Loss Tangent ---61
3.2.2 Temperature Dependence of Dielectric Constant and Loss Tangent --- 64
3.2.3 Volger-Fulcher Anaysis- --- 68
3.3 Electromechanical Properties of Polycrystalline (Ba + Zr) Co-Doped NBT. .72 3.3.1 Room Temperature Electromechanical Properties of Polycrystalline NBT-xBT-3NBZ --- - 73
3.3.1.1 Predominantly Ferroelectric Actuation ---
75
3.3.1.2 Field-Forced Transition (PE-FE) --- 82
3.3.1.3 Predominantly Electrostrictive Actuation ---94 3.3.2 Room Temperature Electromechanical Properties of
Polycrystalline NBT-xBT-4NBZ --- 98 3.3.2.1 Predominantly Electrostrictive Actuation ---
99
3.3.3 Pure Electrostriction in Highly Doped Polycrystalline
NBT-26BT-29NBZ 104
3.3.4 Phase Diagrams for the Ternary System:
Na1/2Bi1/2TiO3-BaTiO3-Nal/2Bi1/2ZrO3 ... - - --- 106
3.3.5 Temperature Dependence of Electrostriction ...
109
3.3.6 Comparison of Electrostrictive Properties --- 111Chapter 4.
Results II: Co-Doped Single Crystals ... 113
4.1 Single Crystal Growth by Self-Flux Method ... 113 4.2 Composition and Phase Symmetry Analysis .116
4.3 Dielectric Properties of (Ba + Zr) Co-Doped NBT Single Crystals . . 118
4.3.1 Room Temperature Dielectric Constant and Loss Tangent ...118 4.3.2 Temperature Dependence of Dielectric Constant
and Loss Tangent ...
120
4.3.3 Comparison of the Dielectric Constant and Loss Temperature
Dependence in Single Crystals and Polycrystals . 122...
4.3.4 Volger-Fulcher Analysis ...
124
4.3.5 Temperature Hysteresis in Dielectric Response .
127
...4.4 Electromechanical Properties of (Ba + Zr) Co-Doped NBT Single Crystals.... 129
4.4.1 Room Temperature Electrostrictive Properties of
Tetragonal Phase Co-Doped NBT Single Crystals .
129
...4.4.2 Room Temperature Electrostrictive Properties of
Rhombohedral Phase Co-Doped NBT Single Crystals . 135...
4.4.3 Comparison of Electrostriction
-...
139
Chapter 5.
Conclusions 141
Appendix I.
Sample Testing Procedure .143
Appendix II.
Procedure for Preparation of 5% PVA-H20 Solution -... 165
Appendix III.
Relative Tolerance Factor Approach to Perovskite Structure Prediction . 167.... Bibliography. ... 175
Typical Temperature Dependence of Permittivity and Dielecrtic Loss
in Relaxor Ferroelectrics 16
Typical Dielectric and Polarization Behavior in Relaxor Ferroelectrics -17 Ternary Plot of Nominal Polycrystalline Powder Batch Compositions ----28 Set-Up For In-Situ Melting Observation ... 35
Model 590 Tripod PolisherB South Bay Technology, Inc. - 37... Polished (Ba + Zr) Co-Doped NBT Samples Prepared For Testing ---37
High Temperature Sample Holder for Impedance Measurements ---43
High Temperature Sample Holder for Impedance Measurements,
continued (BNC Connectors) --- 44 Poling Set-Up --- 46 Schematic Illustrating Resonance and Antiresonance Peaks ---47
X-ray Diffraction Patterns for Selected Single Phase Perovskite Powders 56 Trend in Degree of Tetragonality for 3 mol% Zr4 'with
Increasing Ba2+ Concentration in Co-Doped NBT Polycrystals 57 Phase Diagram for (Ba + Zr) Co-Doped NBT ---58 ESEM Images of As-Sintered and Fracture Surfaces
of Sintered Polycrystals --- 60 Room Temperature r at 10 kHz for Polycrystalline Co-Doped NBT ...62
Room Temperature tan 6 at 10 kHz for Polycrystalline Co-Doped NBT .- 63 Temperature and Frequency Dependence of Fr and tan 6 in
NBT-xBT-3NBZ at 0.1, 1, 10, 100, 1000 kHz ---66 Figure 1.1 Figure 1.2 Figure 2.1 Figure 2.2 Figure 2.3 Figure 2.4 Figure 2.5 Figure 2.6 Figure 2.7 Figure 2.8 Figure 3.1 Figure 3.2 Figure 3.3 Figure 3.4 Figure 3.5 Figure 3.6 Figure 3.7
Figure 3.8 Figure 3.9 Figure 3.10 Figure 3.11 Figure 3.12 Figure 3.13 Figure 3.14 Figure 3.15 Figure 3.16 Figure 3.17 Figure 3.18 Figure 3.19 Figure 3.20 Figure 3.21 Figure 3.22 Figure 3.23 Figure 3.24 Figure 3.25
Temperature and Frequency Dependence of Fr and tan 6 in
NBT-xBT-4NBZ and NBT-26BT-29NBZ at 0.1, 1, 10, 100, 1000 kHz 67 1 /Tm as a Function of Frequency with Volger-Fulcher Law Fit for
NBT-xBT-3NBZ 69
1 /Tm as a Function of Frequency with Volger-Fulcher Law Fit for
NBT-xBT-4NBZ and NBT-26BT-29NBZ 70
Trend in Acutation and Polarization Character for 3 mol% Zr4+
with Increasing Ba2+in Co-Doped NBT Polycrystals 74
Evolution of Bipolar Strain Response in Intially Poled FR
Phase NBT-4BT-3NBZ Polycrystal --- 76 Strain (Unipolar) Versus Field for FR NBT-4BT-3NBZ Polycrystal ---77 Polarization and Current Versus Field for FR Phase
NBT-4BT-3NBZ Polycrystal --- 77 Strain (Bipolar and Unipolar) Versus Field for FT Phase NBT-14BT-3NBZ
Polycrystal
---
79
Polarization and Current Versus Field for FTPhase NBT-14BT-3NBZ
Polycrystal --- 79 Resonance Analysis (Zero Bias) in Poled FT Phase NBT-14BT-3NBZ Polycrystal with Disc Geometry --- 80 Low Field Electrostrictive Strain (Bipolar) Versus Field for FFTR Phase NBT-6BT-3NBZ Polycrystal --- 84 Low Field Polarization and Current Versus Field for FFTR Phase
NBT-6BT-3NBZ Polycrystal --- 84 Low Field Electrostrictive Properties d33and Qn1 of FFTR Phase
NBT-6BT-3NBZ Polycrystal --- 85 Evolution of the Field-Forced Phase Transition with Increasing Field in FFTR Phase Co-Doped NBT-6BT-3NBZ Polycrystal ---86 High Field Polarization and Current Versus Field for FFTR Phase
NBT-6BT-3NBZ Polycrystal -88
Low Field Electrostrictive Strain (Bipolar) Versus Field for FFTT Phase NBT-12BT-3NBZ Polycrystal --- 90 Low Field Polarization and Current Versus Field for FFTT Phase
NBT-12BT-3NBZ Polycrystal --- 90 Low Field Electrostrictive Properties d33and Qll Field for FFTTPhase NBT-12BT-3NBZ Polycrystal --- 91
Figure 3.27 Figure 3.28 Figure 3.29 Figure 3.30 Figure 3.31 Figure 3.32 Figure 3.33 Figure 3.34 Figure 3.35 Figure 3.36 Figure 3.37 Figure 3.38 Figure 3.39 Figure 3.40 Figure 3.41 Figure 3.42 Figure 3.43
High Field Polarization and Current Versus Field for FFTT Phase NBT-12BT-3NBZ Polycrystal- --- -93 Electrostrictive Strain (Bipolar and Unipolar) Versus Field for PET
Phase NBT-1OBT-3NBZ Polycrystal ... 95 Polarization and Current Versus Field for PET Phase NBT-1OBT-3NBZ Polycrystal --- 95 Electrostrictive Properties d33and Q1, of PET Phase NBT-1OBT-3NBZ
Polycrystal --- - 96
Electrostrictive Strain (Bipolar and Unipolar) Versus Field for PET
Phase NBT-8BT-3NBZ Polycrystal .-... 97
Polarization and Current Versus Field for PET Phase NBT-8BT-3NBZ
Polycrystal
---
97
Electrostrictive Properties d33and Q,1of PET Phase NBT-8BT-3NBZ
Polycrystal -.. ...98 Electrostrictive Strain (Bipolar and Unipolar) Versus Field for PE
Phase NBT-xBT-4NBZ Polycrystals -... 100 . Polarization and Current Versus Field for PE Phase NBT-xBT-4NBZ
Polycrystals 101
Predominantly Electrostrictive Bipolar Strain Versus Field for PE
Phase NBT-xBT-4NBZ Polycrystal Series ... 102 Predominantly Electrostrictive Polarization Field for PE
Phase NBT-xBT-4NBZ Polycrystal Series- -... 102 Electrostrictive Properties d33and Qn1 of PE Phase NBT-xBT-3NBZ
Polycrystals- - ,,,,,,,, 103
Actuation, Polarization and Current Versus Field for pure PE Phase NBT-26BT-29NBZ Polycrystal -... ,,,,,,,,,,,,,,,,,,,,,,,,105 Partial Phase Diagram at Room Temperature for the Ternary System
Na1/2Bil/2TiO3-BaTiO3-Nal/2Bi,/2ZrO3...-... 107 Partial Phase Diagram at Room Temperature for Naj/2Bij/2TiO3-BaTiO3
at 3 mol% Nal/2Bi,/2ZrO3 --- 108
Temperature Dependence of Actuation Behavior for Predominantly PE
Phase (Room Temperature) NBT-8BT-3NBZ -... 110 . Comparison of Room Temperature Electrostriction in Co-Doped
Figure 4.1 Figure 4.2 Figure 4.3 Figure 4.4 Figure 4.5 Figure 4.6 Figure 4.7 Figure 4.8 Figure 4.9 Figure 4.10 Figure 4.11 Figure 4.12 Figure 4.13 Figure 4.14 Figure 4.15 Figure 4.16 Figure 4.17 Figure 4.18 Figure 4.19
As-Grown Crystal Batches of (Ba, Zr) Co-Doped NBT --- 114 Optical Microfeatures of (Ba + Zr) Co-Doped NBT Single Crystals ---115 X-Ray Diffraction of (Ba + Zr) Co-Doped NBT [100] Oriented Single
Crystals of Tetragonal and Rhombohedral Symmetry --- 118
Room Temperature Cr and tan 6 Versus Ba2+Concentraion for (4 mol% Zr) Co-Doped NBT Single Crystals Oriented [100] ... 119 Temperature and Frequency Dependence of Cr and tan 6 for (Ba + Zr)
Co-Doped NBT Rhombohedral Single Crystals Oriented [100] --- 121 Temperature and Frequency Dependence of r and tan 6 for (Ba + Zr)
Co-Doped NBT Tetragonal Single Crystals Oriented [100] ... 122 Comparison of Temperature and Frequency Dependence of £r and tan 6 for (Ba + Zr) Co-Doped NBT Tetragonal Single Crystals ... 123 1 / Tm as Function of Frequency with Volgel-Fulcher Law Fit for
Rhombohedral Phase (Ba + Zr) Co-Doped NBT Single Crystals ---125 1/Tm as Function of Frequency with Volgel-Fulcher Law Fit for
Tetragonal Phase (Ba + Zr) Co-Doped NBT Single Crystals ---126 Temperature Hysteresis in Dielectric Response at 10 kHz for (Ba + Zr)
Co-Doped NBT Single Crystals Oriented [100] ---128 Strain Versus Field for Predominantly Electrostrictive Tetragonal Phase
(Ba + Zr) Co-Doped NBT Single Crystals Oriented [100] ---. 130 Comparison of Predominantly Electrostrictive Actuation in Tetragonal
Crystal [100] and Polycrystalline NBT-12BT-4NBZ --- 130 Comparison of Predominantly Electrostrictive Actuation in Tetragonal
Crystal [100] and Polycrystalline NBT-9BT-4NBZ ---131 Polarization and Current Versus Field for PET Phase (Ba + Zr) Co-Doped
NBT Single Crystals Oriented [100] --- 133 Electrostrictive Properties d33and Qj1 of PET Phase (Ba + Zr) Co-Doped
NBT Single Crystals Oriented [100] --- 134 Strain Versus Field for Predominantly Electrostrictive Rhombohedral Phase
(Ba + Zr) Co-Doped NBT Single Crystals Oriented [100] --- 136 Comparison of Predominantly Electrostrictive Actuation in Rhombohedral
Crystal [100] and Polycrystalline NBT-7BT-4NBZ- --- 136 Polarization and Current Versus Field for PER (Ba + Zr) Co-Doped
NBT Single Crystals Oriented [100] --- 137 Electrostrictive Properties d33and Q,1 of PER Phase (Ba + Zr) Co-Doped
Figure AIII.2
Figure AIII.3
Calculated Tolerance Factor Versus Dopant Fraction in NBT-Based Solid Solutions with Known MPB Compositions --- 171 Calculated Tolerance Factor for Compositions NBT-xBT-3NBT with Target Relative Tolerance Factor for NBT-Based Systems ---173
List of Tables
Table 2.1 Nominal Batch Compositions for (Ba + Zr) Co-Doped Polycrystals --- 27
Table 2.2 Nominal Batch Compositions for (Ba + Zr) Co-Doped Single Crystals with Growth Schedule 33 Table 2.3 Calculated Frequency Constants (from ktand kp resonance) ---47
Table 3.1 Composition (EPMA) and Phase (XRD) for Co-Doped Polycrystals ---54
Table 3.2 Volger-Fulcher Parameters for Co-Doped NBT Relaxor Polycrystals --- 71
Table 3.3 Comparison of Piezoelelctric Properties for Polycrystalline Materials --- 82
Table 4.1 Composition (EPMA) and Phase (XRD) for Co-Doped Single Crystals .-.. 117
Table 4.2 Volger-Fulcher Parameters for Co-Doped NBT [100] Relaxor Crystals ---- 126
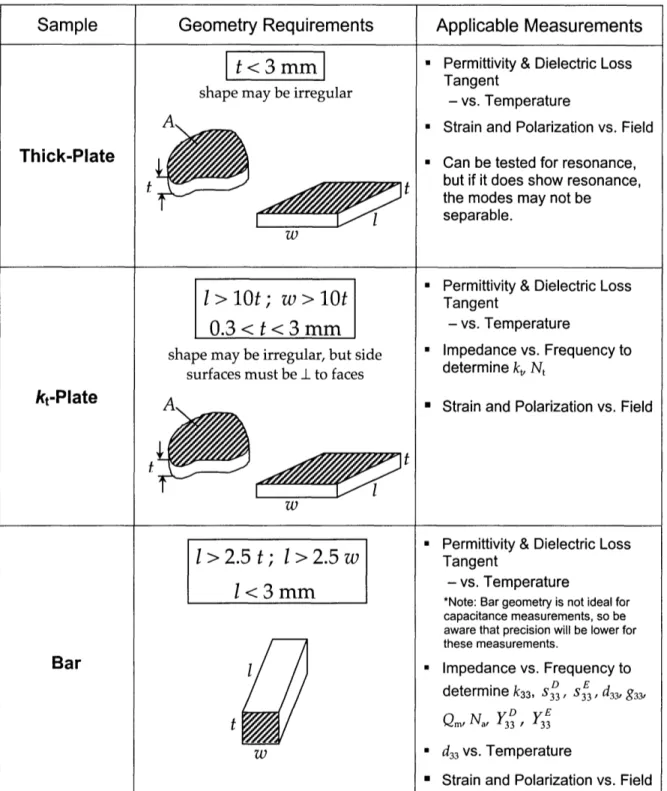
Table 4.3 Comparison of Polycrystalline and Single Crystal Electrostriction ---140 Table AI.1 Summary of Sample Geometry Requirements 144
Financial support for this project was generously provided by the Office of Naval Research (ONR) contract #N00014-97-0989 and the Defense Advanced Research Project Agency (DARPA) Single Crystal Fiber Composite (SCFC)
Program under Air Force Office of Scientific Research (AFOSR) Prime
Cooperative Agreement # F49620-99-2-0332.
I wish to thank the many people who offered their time, support and friendship to me during my studies at MIT. My thesis advisor, Professor Yet-Ming Chiang, thank you for your guidance and enthusiasm in research. Toni Centorino, who is incredibly knowledgeable in the ways of MIT, thank you for keeping things organized and on schedule. I would like to thank Dr. Naoki Ohashi and Andrey Soukhojak for their many insightful discussions and
experimental assistance; it has been a pleasure working with you. I wish also to thank Neel Chatterjee for EPMA and Haifeng Wang for ESEM experimental assistance. Greg Farrey, who was a great colleague and even greater friend, thank you for helping make the heavy things bearable.
I would especially like to thank my family for the encouragement, love and support, which you have always given in abundance, and Justin, thank you
Chapter 1
Introduction
The electromechanical properties of relaxor ferroelectric materials have many useful actuator applications, making them the key components in transducers, electroacoustic transformers, signal-processing devices, and ultrasonic miniature motors [1-4]. Electrostrictive relaxor materials have been utilized in multilayer actuators developed for high precision
micro-position-controllers, optical-path control systems, and low frequency sonar transducers [4-8]. An active field of research exists for the development of new actuator materials and optimization of properties for numerous applications.
1.1 Piezoelectricity,
Electrostriction
and Ferroelectricity
Piezoelectricity is an electromechanical coupling phenomenon occurring in non-centrosymmetric crystalline materials. A piezoelectric crystal will develop an electrical charge in response to an applied mechanical stress (direct effect). Conversely electrical energy can be converted into mechanical energy
through the reorientation of dipoles, which deforms the crystal lattice (converse effect). The piezoelectric effect is linear (first order), producing a strain
proportional to the electric field with the displacement directionally dependent on the sign of the applied field [9].
Electrostriction is a quadratic (second order) effect in which strain is independent of direction* and proportional to the square of the electric field. This phenomenon is present in all materials, and is the only electromechanical response observed in centrosymmetric crystals, for which no polar properties exist [10]. The electrostrictive effect is usually very weak with strain on the order of 1011 in simple oxides and 10- -6 in oxide perovskites [11]. However, some
perovskites with high dielectric constants (indicating a high degree of
polarizability) can exhibit large electrostrictive electromechanical coupling, with strains on the order of 10-3[5, 6]. High-strain electrostrictors are the preferred materials for high precision controller actuator applications, for they have negligible hysteresis (i.e. no shift of the initial zero position) and do not require electric poling to preferentially orient dipoles or domains.
Ferroelectricity arises in non-centrosymmetric crystal systems for which it
is possible to have one or more polar axes, giving rise to a spontaneous
polarization. In ferroelectric materials, this polarization is reversible, meaning that the individual domain states may be reoriented under an applied electric
Chapter 1 Introduction
field. The field at which domain switching occurs is known as the coercive field Ec. This reversible polarization, however, generally occurs with large hysteresis. Upon the application of a uni-directional electric field, the material becomes poled. As the field is then reduced, a certain concentration of dipole moments retain, or "remember," their field-induced orientation as it is energetically unfavorable to return to their original state. The portion of dipoles that remain aligned down to zero field is termed remnant polarization P,. Application of an oppositely directed field -Ec is thus required to drive the polarization back to zero. In their reversible polar state, ferroelectrics exhibit piezoelectric and
electrostriction effects, however, in most ferroelectric actuation, the piezoelectric effect dominates over the weak electrostrictive response.
1.2
Relaxor Complex Perovskites
Relaxor behavior has been studied extensively in lead-based complex perovskite systems [4, 12-15]. Relaxor ferroelectrics are distinguished from "normal" ferroelectrics by the presence of certain key characteristics. The most distinctive characteristic is a diffuse and frequency-dependent maximum in
dielectric permittivity (Tm) and dielectric loss tan 6 with temperature (Fig. 1.1).
The temperature of the permittivity and loss maxima increases with increasing
frequency. Below the maximum,
c
and tan 6 exhibit large frequency dispersion,with c decreasing and tan 6 increasing for increasing frequency. For
temperatures above the maximum, frequency dispersion is negligible.
0 U 0 0 4") Cu 0.4 0.35 0.3 0.25 0.2 0.15 0.1 0.05 0 C :I.
r
'A C Temperature (K) Figure 1.1Typical Temperature Dependence of Permittivity and Dielectric Loss in Relaxor Ferroelectrics
Frequency dispersion of permittivity and loss maxima shown in PMN, a typical B-site relaxor ferroelectric. Figure taken from Lin et al. [16].
For the B-site cubic complex perovskite relaxor, Pb(Mg/3Nb2/3)03(PMN),
it is observed that Tm does not represent a macroscopic phase transition between ferroelectric and electrostrictive states. Rather, Pr exhibits a gradual decay as temperature increases with the temperature of depolarization Td occurring well
below Tm (Fig. 1.2) [14, 15].
Chavr 1 . . . . . . . d...
(such as PMN) is attributed to the presence of ordered nanodomains with short correlation length. These nanodomains form as the disordered B-site structure
induces A-site displacement (APb+2), giving rise to nanoscale compositional fluctuations [13-15]. Td & Tm T (C) -* Figure 1.2
Typical Dielectric and Polarization Behavior in Relaxor Ferroelectrics
Schematic of polarization ( · · ) and relative dielectric constant (-) curves for PMN as a function of temperature. The behavior is divided into three regions. Dielectric constant shows broad-diffuse maximum at Tm above which, behavior is electrostrictive (I). At temperatures below the thermal depolarization threshold Td, macro polarization develops and ferroelectric behavior is observed (III). The ferroelectric-electrostrictive transition is not sharp, but rather a gradational decrease in remnant polarization is observed with zero P occurring before Tm is reached. This leads to a region (II) of mixed behavior. (Figure
adapted from Shrout and Fielding [4])
Shrout and Fielding [4] classify lead-based relaxors into three groups, based on their polarization behavior (Fig. 1.2): (I) electrostrictive (II) micro-macro (III) macro-polar. Group I relaxor compositions are electrostrictive with Tm near room temperature and generally have exceptionally high dielectric constants (r
> 20,000) [4]. Group III compositions lie at temperatures below the depolarization threshold Td and develop macro domains and remnant polarization, displaying ferroelectric behavior similar to standard PZTs [4].
As temperature is increased above Td a gradual, rather than sharp, decrease in Pr is observed, giving rise to the "micro-macro" behavior region. Group II relaxor compositions generally have lower dielectric constants and lie between Tm and Td at room temperature. They show mixed behavior, coupling electrostrictive and piezoelectric properties in which local polarization exists on a micro-scale. Under an applied electric field, it is possible to develop macro domains.
This gradual transition from ferroelectric (FE) to paraelectric (PE) behavior with intermediate mixed character has been well documented in PMN [17]. For Group II compositions, strains with minimal hysteresis can generally be obtained only for lower frequencies (< 1 Hz) [4]. However, the temperature range of the micro-macro region AT = Tm-Td can be quite broad, allowing a large temperature
Chapter 1 Introduction
1.3
Lead-Based Electromechanical Materials
To date, lead-oxide-based perovskite polycrystalline ceramics have been used almost exclusively in electromechanical device applications due to their high actuation strain (~ 0.1 - 0.2%) and high electromechanical coupling efficiencies (k33- 0.7%) [18]. Lead zirconate titanate (PZT) is the leading
piezoelectric polycrystalline perovskite in commercial use [3, 19], however a large number of lead-based ferroelectric and relaxor-ferroelectric compositions have been developed for use in a variety of niche applications [14].
Polycrystalline PMN and (Pb13x,2Lax)(ZryTi-y)O3(PLZT), relaxor perovskites,
with strains approaching 0.1%, are currently the leading materials in
electrostrictive actuator applications [6, 7, 20]. Recently developed single crystals of lead perovskites Pb(Zn1/3Nb2/3)O3-PbTiO 3(PZNT) and PMNT displaying
ultra-high strain - 1.7%, d33- 2500 pC/N and k33- 0.9 [21] has ignited interest in
the growth and investigation of single crystal compositions as higher performance alternatives to polycrystals in some applications.
There are, however, certain drawbacks to the use of lead-based
piezoelectric materials, which include processing difficulties and environmental concerns. Extra steps must be taken in lead-oxide polycrystal preparation to minimize the amount of second phase cubic pyrochlore, which is easily stabilized in most lead-based polycrystalline materials and is detrimental to
performance [22]. The main lead compositions of interest do not melt
congruently, making it difficult or impossible to employ high precision crystal growth by such commonly used methods as Czochralski, Bridgman, or zone melting techniques, for which crystals solidify directly from the melt. High Pb2' volatility at elevated temperatures makes composition difficult to control and poses a serious health threat during processing. The neurotoxicity, kidney toxicity and the damaging effects of lead on reproductive health, leading to sterility have long been recognized. Most recently, lead exposure has been linked to the development of Alzheimer's disease [23]. However, lead in the environment from consumer products and processing waste poses the greatest threat to the developing nervous system in young children. Overexposure to lead is known to cause decreased intelligence, reading disabilities, and motor
skill deficits in children [24].
1.4
Alternatives to Lead-Based Electromechanical Materials
Polycrystalline properties of the A-site relaxor, Na1/2Bij/2TiO 3(NBT), a
rhombohedral ferroelectric perovskite first described by Smolenskii in 1961 [25], have been studied in solid solution with end members K1/2Bij/2TiO3(KBT), BaTiO3, CaTiO3, SrTiO3, and PbTiO3[26-29]. Compared to lead perovskites,
NBT-based perovskites have a higher elastic modulus (110 GPa vs. 70 GPa) and
weight-Chapter 1 Introduction
based actuation applications [26]. The strain energy density emax is a measure of the device energy output per unit mass [21]:
e 2
e S max
max 8'
where, G is the elastic modulus of the actuator, Smax is the maximum
field-induced strain, and p is the actuator density. However, the electromechanical
properties in these NBT-based solid solutions have not yet sufficiently matched the levels achieved by commercial lead-based perovskites. The highest
polycrystalline performance has been reported in the NBT-BaTiO3 (NBT-BT)
system, near the rhombohedral/ tetragonal morphotropic phase boundary
(MPB), with d33 ~ 125 pC/N and k33- 0.55 observed for NBT-6%BT [26].
Investigations into the growth of lead-free single crystals in the NBT-BT system have shown that near MPB compositions are congruently melting and can be easily grown by the flux method and as single crystal fibers by edge-defined film-fed growth [30]. Flux grown NBT-BT crystals show piezoelectric properties that are comparable to, or exceed, those of commercial polycrystalline PZT with strains up to 0.85% and d33~ 650 pC/N. [30, 31]. A variety of actuation
characteristics have been observed in NBT-BT single crystals depending on composition and phase, ranging from ferroelectric to anti-ferroelectric coupled with a large electrostrictive component [31, 32]. Temperature of the permittivity
maximum Tm ranges from 1000C to 200°C, depending on the concentration of
BaTiO3 [33].
1.5
Research Objective
The objective of this research was to conduct compositional exploration within the sodium bismuth titanate system, identifying compositions with a range of lowered Tm, in order to fully characterize the trend in actuation character in the micro-macro (Group II) region (Fig. 1.2).
Increased doping of BaTiO3beyond the 6%BT-MPB composition continues
to stabilize the ferroelectric tetragonal phase [33]. This thesis will show that through simultaneous doping on the A- and B-sites in NBT with Ba2+ and Zr4 +, respectively, rhombohedral and tetragonal non-ferroelectric phases can be
stabilized for higher concentrations of Ba2' (up to 26 mol% Ba2 ). Relaxor
properties are enhanced by the introduction of greater A-site disorder accompanying high-level Ba2 ' doping.
A- and B-site doping in polycrystalline samples succeeded in lowering the temperature of the permittivity maximum to - 60°C at 1kHz, isolating purely electrostrictive actuation (Group I). The highest polycrystalline actuation strain, however, occurs for a set of compositions that lie within the Group II (micro-macro) region, showing mixed actuation behavior. Predominantly
Chapter I Introduction
and d33> 700 pC/ N at 25 kV / cm, surpassing the maximum reported properties
for conventional PMN and PLZT at 1 Hz. Single crystals of the same
composition, phase, and electrostrictive actuation character show up to 0.45% strain and maximum d33~ 2000 pC/N at 35 kV/cm. Predominantly ferroelectric
polycrystalline compositions with d33- 310 pC/N show actuation properties
highly competitive with commercial PZT-8 (d33- 300 pC/N [34]).
The following chapters will illustrate the experimental procedure for sample preparation and testing (Chapter 2), present dielectric and
electromechanical results for a range of compositions in polycrystalline and single crystal samples (Chapters 3 and 4), and in conclusion, summarize and discuss the results (Chapter 5).
Chapter 2
Experimental Procedure
Through ionic polarizability and ionic radii considerations based on a novel method of applying the relative tolerance factor to predict the MPB in an unknown system (described in Appendix III), a set of stoichiometric
compositions (Na1/ 2Bi1/2)1,,Ba(TilyZry)O3 were identified and prepared for which
Ba2' and Zr4 +substitute on the A- and B-sites, respectively. X-ray, dielectric, and electromechanical characterization of polycrystals and single crystals was
performed in order to enhance current understanding of phase stability, A-site relaxor nature and range of actuation behavior in the sodium bismuth titanate system.
This composition system will herein be referred to as a Na1/2Bij/2TiO3
-BaTiO3-Na1 /2Bi,/2ZrO3solid solution. The abbreviation NBT-xBT-yNBZ will be
2.1
Polycrystalline Powder Preparation
High purity (>99 % purity), ultra-fine grain size (< 1 pm) starting powders
of Na2CO3, Bi203, BaCO3, TiO2, and ZrO2were mixed in 15, 20, or 25 g sized
batches according to the intended nominal stoichiometric composition (Table 2.1 and Fig. 2.1). Powder batches are designated "p#," where each number
represents a separate powder batch. When referencing characterized samples, lowercase letters following the batch number represent the individual samples that were prepared and tested from that particular batch.
Chavte~~~~~r
Exver~~Imental
Procedure~~~
Table 2.1
Nominal Batch Compositions for (Ba + Zr) Co-Doped Polycrystals
(Na1/2Bi1/2)1_xBax(Ti_yZry)03
mole fraction mole fraction mole fraction mole fraction
Batch ID Ba2 + (x) Zr4 () Batch ID Ba2+ (x) Zr4
+ (y) p1 0.04 0.03 p12 0.09 0.09 p2 0.06 0.03 p13 0.11 0.05 p3 0.08 0.03 p14 0.09 0.07 p4 0.10 0.03 p1 5 0.13 0.11 p5 0.12 0.03 p16 0.12 0.08 p6 0.12 0.03 p17 0.10 0.06 p7 0.14 0.03 p18 0.12 0.07 p8 0.07 0.04 p1 9 0.11 0.07 p9 0.09 0.04 p20 0.10 0.10 p10 0.12 0.04 p21 0.15 0.14 p11 0.14 0.04 p22 0.20 0.22 p23 0.25 0.30
Na1/2Bi1/2 ZrO3
NBT2_
2
NBT 10 20 30 40 BaTiO 3
mol% BaTiO3
,-Figure 2.1
Ternary Plot of Nominal Polycrystalline Powder Batch Compositions
The numbers plotted on this diagram represent the batch identification number with the preface "p" not included. See Table 2.1 for a list of nominal batch
Chapter 2 Experimental Procedure
The mixed powders were formed into slurries of a "creamy" consistency by the addition of ethanol was added (15 - 20 ml for 20 g batch, - 45 ml for 100 g crystal growth batch). Slurries were ball-milled with cylindrical (1 /4"-radius ended) zirconia media on a roller mill for 15 - 20 hours. After milling, slurries were rinsed with ethanol into a glass dish and set in a hood to dry under a heat lamp ( 12 hours). Once dried, the soft, yellowish precursor powders were ground with a zirconia mortar and pestle, transferred to a covered alumina crucible and calcined in air at 800°C for 3 hours. A Thermolyne 47900 series box furnace was used for the first calcination, set to heat at a rate of 100°C/hr and cool, unpowered, to room temperature. After the first calcination, the now ivory-colored powders were highly agglomerated, but easily crumbled. After grinding vigorously with a zirconia mortar and pestle, the powders were
calcined a second time in air at 10000C for 20 hours. A Thermolyne 46100 series
high temperature furnace was used for this second calcination, heating to 10000C
and cooling to 8000C at 100°C/hr. Cooling below 8000C proceeded at an
unpowered rate to room temperature. After the second calcination, powders were white and highly agglomerated, but soft. They easily crumbled when ground in a zirconia mortar. X-ray powder diffraction confirmed single-phase perovskite with minor second phase (< 1 vol%).
Only one powder batch was not calcined at 10000C. Batch p6 was calcined
heating and cooling rates described above. The calcined precursor powders are not completely single phase. X-ray powder diffraction confirmed that pressed samples became single phase with minor second phase (- 5 vol%) during the sintering process. All other samples were prepared from single phase powders.
Dense polycrystalline samples were prepared for dielectric and
electromechanical characterization from each of the powder batches listed in Table 2.1. Between 0.8 and 1 g of powder was weighed out and ground in a zirconia mortar. The calcined powders were highly agglomerated, which is detrimental to good flow and packing during pressing. Also, the ball milling process results in an inhomogeneous particle size distribution consisting of irregularly shaped grains with angular edges. Such particles have non-ideal packing geometries that lead to pore stabilization during sintering [35].
To promote dense packing, grains were coated with a polymer binder, polyvinyl alcohol, before pressing. Approximately 5-6 drops of PVA-H20 binder
solutiont was added to the ground powders, just enough to coat all the grains. The binder was mixed thoroughly into the powder with a pestle and the resulting paste was allowed to dry, grinding occasionally until a hardened, granular consistency was achieved. The coated powder was then pressed through a 500 m mesh nylon screen. This produced evenly sized granules that flowed smoothly and packed densely. The coated granules were poured into a
Chapter 2 Experimental Procedure
1/2" die that had been lubricated with a thin layer of oleic acid. Samples were pressed by slowly increasing pressure, holding 1 minute every 30 MPa until a maximum of - 100 MPa was reached. The maximum pressure was held for 5 minutes before releasing. Pressing resulted in a highly consolidated green body with disc geometry. The disc edges were sanded with 15pm-grit silicon carbide paper in order to remove edge contamination from the steel die. Green body discs were placed on a layer of platinum foil within an alumina dish. The dish was fitted with an alumina lid with a hole in the center, in order to allow efficient lubricant and binder burnout yet minimize bismuth loss during sintering. Discs were sintered in air at 12000C for 4 hours in a Thermolyne 46100 series high
temperature furnace with a heating rate of 1000/hr to maximum temperature and
a controlled cooling rate of 1000/hr to 8000C. The sintered discs were
approximately 10 mm in diameter with thickness between 1-2 mm and were near-full density (> 95%).
2.2
Single Crystal Growth
Single crystals of co-doped (Ba + Zr) NBT were grown by the self-flux method. High purity (>99 % purity) starting powders of Na2CO3, Bi203, BaCO3,
TiO2, and ZrO2were mixed in 100 g sized batches according to the intended
composed of 20 wt% excess each of Na2CO3and Bi203. Table 2.2 lists the nominal
compositions and conditions for flux growth batches that produced viable crystals for testing. The number following "s" represents a separate crystal batch. When referencing characterized samples, lowercase letters following the batch number represent the individual samples that were prepared from that crystal batch.
Powder preparation followed the same procedure through the first
calcination at 800°C as described in Section 2.1 for polycrystalline samples. After the first calcination, powders were ground in a zirconia mortar and transferred to a 100 ml-capacity, covered, platinum crucible. The platinum crucible was fitted inside a larger, covered alumina crucible. The powders were held for 5 hours at 13500C, and cooled according to various schedules (Table 2.2) that
typically yielded intergrown crystals set within solidified flux. Weight loss was less than 1% for all crystal growths, indicating that bismuth loss due to
volatilization was not significant. Crystals were mechanically separated from the crucible and the flux. Intergrown crystals would be separated either with a Well diamond wire saw or broken apart with the application of pressure.
Chapter 2 Experimental Procedure
Table 2.2
Nominal Batch Compositions for (Ba + Zr) Co-Doped Single Crystals with Growth Schedule
(Nal/2Bil/2)1x-Bax(TilyZry)03
mole fraction mole fraction Self-Flux Growth Schedule
Batch ID Ba2 ' (x) Zr4 + (y) R.T.-1350°C @ 100°/hr S1 0.08 0.03 hold 5 hours 1350C - 8000C @ 50/hr 800°C - R.T. @ 50°/hr S2 0.08 0.03 R.T.-*1350°C @ 100°/hr s3 0.06 0.03 hold 5 hours 1350°C - 12600C @ 100°/hr hold 1 hour s4 0.10 0.03 1260C -_ 1000C @ 1.5/hr 1000°C - R.T. @ 50/hr S5 0.10 0.03
The introduction of zirconia resulted in difficulty achieving high quality crystals by the flux method. Attempted growths with 10 mol% Zr4+and 12 mol%
Ba2+yielded numerous, but small, inclusion-bearing crystals (<1 mm on a side). Few crystals of a quality and size meeting the requirements for testing could be extracted from the batch. The greatest success in achieving crystals viable for
characterization occurred for nominal doping of 3 mol% Zr with 6, 8, and 10 mol% Ba2+. Flux grown co-doped crystals tend to grow with pseudo-cubic habit, however, highly planar as-grown 001} faces were rare. Back reflection Polaroid photography with a laue diffraction camera using a Philips 2KW sealed tube
x-ray generator was not successful in orienting crystals, for diffraction spots were unresolvable. This may be due to internal inhomogeneities and distortion, which can cause a "smearing" of the spots [36]. Therefore, samples for testing could be prepared only from the small number of crystals with as-grown planar {001} faces. The pseudo-cubic {001} orientation of these crystals was confirmed by with diffraction experiments using a Rigaku 18kW rotating anode x-ray generator (copper anode), normally used for powder x-ray diffraction.
In-situ observation of the melting behavior of calcined powders and single crystals from previously grown batches was conducted in order to determine the appropriate soaking temperature (Fig. 2.2). When heated at 7.5°C/min from room temperature, co-doped single crystals and calcined powders (including flux) melting catastrophically 1265 ~ 1274°C. This observation suggests that addition of 20 wt% excess flux does not significantly lower the melting
temperature. However, the flux likely serves to enhance diffusivity in the melt and thus contributes to crystal growth. Based on in-situ melting observations, a soaking temperature of 1260°C was chosen. Subsequent growths employing this soaking temperature resulted in improved crystal yield and quality, although micro-inclusions and internal strain were present within even the best-quality
crystals as evidenced through optical microscope observations.
Table 2.2 lists the nominal compositions and conditions for flux growth batches that produced viable crystals for testing. The number following "s"
Ch..tr 2...Pod
represents a separate crystal batch. When referencing characterized samples, lowercase letters following the batch number represent the individual samples that were prepared from that crystal batch.
ace thermocoupleJ
atinum pan
ntains sample
a stand
Figure 2.2
Set-Up For In-Situ Melting Observation
In-situ observation of the melting behavior for crystal and precursor powder was conducted to determine an appropriate soaking temperature for self-flux crystal growths. The sample was contained in a platinum pan - 0.5 cm diameter and was positioned no farther than 2 cm from the furnace thermocouple.
i
Exerimental Procedure
2.3
Polycrystal and Single Crystal Sample Preparation
for Testing
The same procedure for sample preparation and testing was followed for polycrystals and single crystals. Single crystals were oriented to at least one {001} face and cut into rectangular plates using a Well diamond wire saw. Sintered polycrystalline bodies were either cut into rectangular plates or left whole as discs. Samples were mounted with crystal bond on a South Bay
Technology tripod holder (Fig. 2.3) and parallel, planar sides were polished using diamond abrasive film from 30plm- to 1,lm-grit (Fig. 2.4). Polished single crystal plates averaged approximately 2.5 mm x 1.5 mm, with no sample exceeding 5 mm on a side. Thickness averaged 0.7 - 0.8 mm with no sample exceeding 2 mm. Polycrystal plates averaged approximately 7 mm x 3 mm, disc geometry
averaged ~ 10 mm in diameter, and thickness did not exceed 2 mm after
polishing. Samples were ultrasonically cleaned in three acetone baths followed by three methanol baths. Touch up cleaning when necessary was performed by wiping sample surfaces with a cotton-tipped applicator soaked in either
Top view
Figure 2.3
Model 590 Tripod Polisher® South Bay Technology, Inc.
Polycrystalline and single crystal samples were mounted on tripod polisher to maintain parallel, planar sides. Leg lengths are adjustable with micrometer allowing control of sample thickness. This figure shows a mounted single crystal with plate geometry.
Polycrystalline Plate Polycrystalline Disc Single Crystal Plate
Figure 2.4
Polished (Ba + Zr) Co-Doped NBT Samples Prepared for Testing
Parallel, planar sides polished down to a final diamond grit size of l1pm. Single crystals (C) are transparent with an amber-colored tint.
2.4
Polycrystal and Single Crystal Sample Characterization
A detailed manual outlining the testing procedure followed in this work is
included as Appendix I.
2.4.1 Crystal Symmetry Determination by X-ray Diffraction
The symmetry phase of the perovskite structure was determined from X-ray diffraction with a Rigaku 18kWatt rotating anode x-X-ray generator (copper anode). Continuous, standard 20 - 0 reflected scans were performed between 10- 100° 20 at a maximum power of 60 kV and 300 mA using 1° diffraction and
scattering slits and a 0.15 cm receiving slit. The tetragonal structure phase was distinguished from rhombohedral where splitting of the (100)* peak was
detected, indicating inequality among symmetry axes lengths (a = b • c).
Structural phase analysis was performed on precursor polycrystalline powders, the surface of sintered polycrystalline discs, and single crystal {001} faces. The perovskite structure was confirmed in single crystals by x-ray diffraction of
crystals ground to powder in a zirconia mortar.
2.4.2 Composition Analysis by Electron Microprobe
Quantitative analysis of polycrystal and single crystal compositions were performed with the JEOL JXA-733 Electron Probe Microanalyzer (EPMA). Clean
I
For simplicity, the Miller indices of the high temperature cubic phase is used to identify crystal planes in the rhombohedral and tetragonal phases.Chapter 2 Experimental Procedure
samples were sputter coated with carbon before being loaded into the EPMA to prevent charging. The samples were analyzed for elements Na, Bi, Ba, Ti, and Zr
using the following standards: NaAlSi308, Bi4Ge301 2, BaSO4, TiO2, ZrSiO4. One
set of samples was also analyzed for Hf using pure element as standard in order to assess the degree of hafnium contamination from the zirconia starting
powders. Hafnium contamination was determined negligible in all samples tested. The current (10nA), voltage (15 kV) and take-off angle (400) were kept constant during the measurements. Oxygen was not analyzed. No oxygen vacancies were assumed and compositions were normalized to 3 mole fraction of oxygen.
2.4.3 Sample Electroding
Prior to dielectric and electromechanical measurements, clean sample surfaces were electroded. Gold electrode was sputtered for 300 seconds at 40 mA and 0.08 mbar Ar pressure on single crystal surfaces with a Pelco SC-7 Auto Sputter coater. The distance between the sample and gold target was
approximately 40 mm. Scotch tape was used ensure that the side surfaces of the plate remained free of electrode. Polycrystalline samples were prepared with silver electrode that was painted on the surfaces in the form of a colloidal paste. The electrode on both polycrystalline and single crystal samples was annealed in
a temperature above that at which any testing would be carried out also
minimized the chance that the electrode undergo a significant change in response to temperature (such as volatization of solvents in the case of the colloidal silver paste) that might affect the measurement.
2.4.4 Dielectric Characterization by Impedance Analysis
Capacitance C, dielectric loss tangent tan 6 and admittance Y were measured in poled and unpoled samples with a Hewlet Packard 4192Aimpedance analyzer. Measurements with the HP 4192A impedance analyzer and Omega tube furnace were computer automated with Testpoint ISPEC 2000 software (programmed by Dr. Naoki Ohashi, visiting scholar, M.I.T.).
Room temperature C and tan 6 were measured under zero bias in unpoled samples as frequency was increased logarithmically. Relative dielectric constant
Er (real component) was calculated from capacitance by the following equation:
Ct
r E
where, Er = -°T3= relative dielectric constant at constant stress T=0, t = sample thickness (distance between electrodes) in m, A = area of the electroded face in
m2, G0 = permittivity of vacuum (8.854 x10 -12 F/m).
Computer automated measurements sampled C and tan 6 under zero bias
C-hr..2... .. .... rn..vvv v heated at 200°/hr in air to 4500C. The sample temperature, furnace set
temperature, start time, and finish time of each measurement were also recorded. Each sampling at the set of 6 frequencies took approximately 20 seconds.
Temperature dependence of the permittivity and loss in single crystals were measured for heating and cooling (at the same rate), for which temperature hysteresis of the permittivity and loss were detected. Polycrystalline samples showed negligible temperature hysteresis, thus only heating measurements were performed.
The sample holder used for temperature dependent measurements consists of a 4-wire coaxial cable configuration. The holder was designed and built by Dr. Naoki Ohashi, visiting scholar at M.I.T. A picture and schematic of the sample holder is shown in Figures 2.5 and 2.6. Samples were fastened between the measurement probes of the holder with colloidal silver paste. Tm was determined for each frequency from the minimum in second derivative of the smoothed data. Raw data was smoothed with Microcal Origin 5.0 Software (Microcal Software, Inc. ©1997) using the method of adjacent
averaging, in which the smoothed point i is the average of points in the interval:
[i-(n-1)/2, i+(n-1)/2]
where, n is the specified number of points used to calculate the averaged point (i.e. the degree of smoothing). Typical degrees of smoothing used here ranged
from n = 5 to n = 7.
Prnreduri-For relaxors, the frequency (J) dispersion of the permittivity maxima can be described by the Volgel-Fulcher (VF) law of finite freezing temperature:
fkB
(T. - Tf )Ewhere, Tf is the static freezing temperature (f- 0) in Kelvin, fo is the attempt
frequency (s-l), Eact is the activation energy, kB is Boltzmann's constant (1.38 x
10-23J/ K). A general nonlinear fit was applied to the curves of Tm versus frequency
using Mathcad 2000 Professional software (MathSoft, Inc. 1999) to determine the adjustable parameters Eact, f, Tf for:
Eact
Tm(f) Eact
Chapter 2
:. _i " _~ _Tube Furnace HP 4192A Sample Holder
Equipment Set-up Close-up of Sample
in Holder
Schematic of Sample Holder
Sample Thermocouple . ... ...out to temperature moniter... ... .. ... BNC Connectors ...out to HP4192A... Close-up c I IUIG &.
High Temperature Sample Holder for Impedance Measurements
Sample holder was designed and built by Dr. N. Ohashi, Visiting Scholar, M.I.T.
Experimental Pocedure
Photograph of BNC Connectors
HP4192A
L curr L pot H pot
I I I ®(~ I
®.
Schematic of BNC Connectors
A Figure 2.6High Temperature Sample Holder for Impedance Measurements, continued (BNC Connectors)
Sample holder was designed and built by Dr. N. Ohashi, Visiting Scholar, M.I.T. Coaxial Cables A & B can
connect either to L/L OR H/H in any order but NOT L/H.
. . . , _ . ·, . (C or D)-Hpot, (C or D)-Hcurr An Incorrect Configuration: A-Lcurr, B-Hpot, C-Lpot, D-Hcurr I H urr
Chapter 2 Experimental Procedure
2.4.5 Electromechanical Characterization by Impedance
Analysis
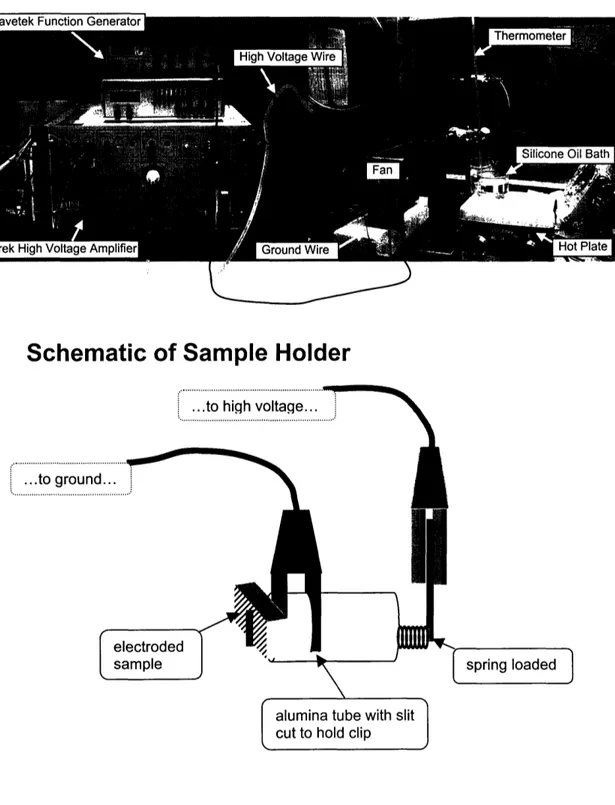
Poling of polycrystalline and single crystal samples was attempted by constant field cooling from 2000C to room temperature at a field between 20 - 25
kV/cm. Samples were submerged in a silicone oil bath (to prevent arcing) that was heated to 2000C then allowed to cool while dc voltage was applied by a Trek
Model 10/40 high voltage amplifier with a Wavetek function generator. Figure 2.7 illustrates the poling set-up and sample holder.
After poling room temperature C and tan 6 versus frequency with
logarithmic steps in the range 100 Hz to 13 MHz were measured with HP4192A impedance analyzer. A decrease in dielectric constant compared to the unpoled measurement and the appearance of resonance is an indication that the sample was poled. Most samples in this study did not pole, for they are predominantly electrostrictive.
Two samples of predominantly ferroelectric behavior were successfully poled and coupling coefficients kt and k31were calculated from measurements of admittance Y versus frequency (where, impedance Z = 1/ Y) measurements performed under zero bias with the HP4192A impedance analyzer. The
electromechanical coupling factor k is a measure of the electromechanical energy
efficiency: k2 = electrical energy input
Schematic of Sample Holder
...to high voltage... ... ...to ground.... .. ....* ... electrodedsample J I spring loadea
..
. jalumina tube with slit
cut to hold clip
Figure 2.7
Poling Set-Up
Sample holder was designed and built by G. Farrey, M.S., M.I.T.
f
Experimental Procedure
Thickness-extensional coupling factor kt is calculated according to the following equation:
tkt =J f
2 a
where f is the resonance frequency, fa is the antiresonance frequency (Fig.
2.8) and Af=fa -f. Table 2.3 lists the constants which may be calculated us from k, and kp. fa
Frequency--t
co a, Et
a) . r C E Figure 2.8Schematic Illustrating Resonance and Antiresonance Peaks
Table 2.3
/r
Frequency--Calculated Frequency Constants (from kt and kp resonance)
Frequency constant (thickness) N [Hz m] N = tf
(Controlling Dimension x Resonant Frequency)
Frequency constant (planar) (Np) [Hz. m] N = afr
(Controlling Dimension x Resonant Frequency) P
Frequency constant (circumferential) (Nc)
[Hz- m] N = afa
(Controlling Dimension x Resonant Frequency)
Chapter 2
tan z Aflr
2.4.6 Electromechanical Characterization Under Field
Electric-field induced elongation and current was measured for 0.05, 1, and 20 Hz ac fields and 1 MPa prestress using a laser interferometer apparatus with automated data collection software, Trek high voltage amplifier, Wavetek function generator. The sample holder which was capable of applying varying compressive loads to the sample was designed and built by A. Soukhojak and G. Maskaly, M.I.T. Unipolar field induced elongation was measured for the same set of frequencies with an applied dc bias. Strain was calculated according to the following equation:
strain: S
=-xo
where, x = the distance between electroded faces Ax = x - xO and S is positive for
sample extension.
The piezoelectric strain coefficient d33(in m/V C/N) was measured
directly as the slope of the strain vs. field at saturation (i.e. non-hysteretic
portion) for ferroelectric behavior. Predominantly electrostrictive actuation does not directly exhibit piezoelectric properties such as d33, however the
field-induced d33may be characterized. Thus, d33can be plotted as a function of field
Chapter 2 Experimental Procedure
The effect of varying prestress on actuation was tested up to 32 MPa on single crystals and 5 MPa on polycrystals and shown to be negligible. Samples were actuated under 1MPa prestress for consistency.
Polarization (surface charge density) versus field was derived by
numerically integrating the current versus field and dividing by the electroded surface area. This can be understood from the following relations: P = Q/A and
i =dQ/dt, or Q =
i.
dt where P is polarization in C/m2, A is electroded area inm2
, Q is charge in C, and i is current in A - C/s. Thus,
Pi dt
P = A
can be plotted against field to obtain what are often referred to "hysteresis loops." For ferroelectric bipolar polarization loops, the coercive field Ec is determined as the field at which polarization is zero. For the case of pure, unsaturated electrostriction, polarization plots as a line (no hysteresis) against
field. The dielectric susceptibility K is defined as: P = CoKE (SI units).
Dielectric susceptibility can be determined from the slope of polarization versus
field divided by Co.
Electrostrictive strain can be described with the following equation:
where, Q,, is the electrostrictive coefficient and can be determined from the slope of strain versus the square of polarization.
Chapter 3
Results I: Co-Doped Polycrystals
Compositional, phase, dielectric, and electromechanical data measured for polycrystalline samples will be presented and discussed in this chapter. These results show that (Ba, Zr) co-doped NBT compositions are a promising
alternative to the conventional lead-oxide based polycrystalline perovskites, such as electrostrictive PMN and PLZT electrostrictors and ferroelectric PZT-8, PMNT, PZT-5a for device applications.
3.1
Composition, Phase and Density Analysis
EPMA composition analyses of polycrystalline samples show that the intending doping levels of Ba2 ' and Zr4 ' were achieved in nearly all of the
samples (Table 3.1). Two samples, pl2a and p20a, are off by 0.01 mole fraction from the intended level. Composition analyses reported in Table 3.1 were
measured on the primary phase only. Minor second phase, which was present in all of the samples, was able to be distinguished with back-scattered electron
imaging and was carefully avoided. The reported compositions of atomic mole fraction were calculated assuming valences of Na", Bi3', Ba2', Ti4+, Zr4+and
normalized to 3 02- per formula unit. Based on counting statistics, the Ti, Na, Bi, Zr concentrations are given with 1-2% accuracy, and Ba concentrations are given accurate to 5%. The A-site cations Na+1 and Bi+3were assumed to be substituted by Ba2 ' in equal parts. However, composition analyses show Ba does not replace
Na and Bi uniformly. Thus, the ratios of Na/Bi are not strictly controlled by the
solid-state process used (refer to Section 2.1).
X-ray diffraction within the range 20-90°20 confirmed that all samples were nearly single phase perovskite (Fig 3.1). X-ray patterns show negligible to minor second phase. Second phase content increases for higher zirconia doping levels above 20 mol% Zr, but remains < 5 vol%. Using back scattered electron imaging and composition analysis, only one second phase was identified in each sample. EPMA analysis of the second phase in samples doped < 14 mol% Zr identified barium titanium oxide (BaTi2O5) . For samples with > 14 mol% Zr, the
second phase was identified as ZrO2using EPMA analysis.
When normalized to 3 oxygen per unit formula, the compositions are nearly stoichiometric with slight A-site excess (ranging 0 - 0.09 ± 0.02 mole fraction). A-site excess in the perovskite crystal structure may be incorporated through Ruddlesden-Popper (RP) stacking faults, as seen in the extensively studied class of layered perovskites of the general form, LnlxAxMnO3, where Ln
Chapter 3
is a lanthanide and A is an alkaline earth cation [37]. RP stacking faults have recently been demonstrated in SrTiO3ceramics [38], in which A-site excess is
incorporated through the insertion of individual SrO layers between perovskite units. The resulting defect oxide compositions Sr2TiO4, Sr3Ti2O7, and Sr4Ti3010are
reported [38]. The presence of a small concentration of such RP insertion layers causes the overall perovskite to composition to become slightly A-site rich.
However, given the presence of B-site cation-rich second phases, BaTi205
and ZrO2, the most likely interpretation is that the perovskite structure contains
oxygen and B-site vacancies. Thus, it is assumed here that non-idealities in ABO3
perovskite stoichiometry are the result of either A-site or B-site (and oxygen) vacancies. For A-site rich compositions, cation mole fractions in Table 3.1 were normalized to unity on the A-site and reflect the level of B-site and oxygen vacancies. B-site rich compositions were normalized to unity on the B-site and reflect A-site and oxygen vacancies. The composition analyses suggest that the majority of the samples are B-site deficient with oxygen vacancies. Three samples, p3a, p7a and p8a show slight A-sight deficiencies. However, these samples are stoichiometric within error limits of the analysis.
Table 3.1
Composition (EPMA) and Phase (XRD) for Co-Doped Polycrystals
compositions given in mole fraction
(normalized to unity on B-site except where indicated by *)
Sample Nominal (Na+Bi+Ba)/
ID (Ba/Zr) Na Bi Ba (Ti+Zr) Symmetry
pla p2a p3a p4a p5a p6a p6b p7a p8a p9a p10a p1la p12a p13a p14a p15a p16a p17a p18a p19a p20a p21a p22a p23a 4/3 6/3 8/3 10/3 12/3 12/3 12/3 14/3 7/4 9/4 12/4 14/4 9/9 11/5 9/7 13/11 12/8 6/10 12/7 11/7 10/10 15/14 20/22 25/30 0.52 0.50 0.48 0.47 0.47 0.47 0.48 0.45 0.47 0.48 0.45 0.46 0.49 0.48 0.48 0.44 0.46 0.48 0.47 0.48 0.47 0.45 0.42 0.39 0.44 0.44 0.44 0.43 0.42 0.42 0.41 0.41 0.45 0.43 0.43 0.41 0.43 0.41 0.44 0.43 0.42 0.42 0.42 0.42 0.43 0.41 0.38 0.36 0.04 0.06 0.08 0.10 0.11 0.12 0.12 0.14 0.07 0.09 0.12 0.14 0.09 0.11 0.09 0.12 0.12 0.10 0.11 0.10 0.10 0.14 0.20 0.26 0.93 0.92 0.97 0.95 0.91 0.94 0.97 0.97 0.96 0.92 0.94 0.93 0.88 0.91 0.90 0.84 0.88 0.92 0.89 0.85 0.86 0.80 0.76 0.70 0.03 0.03 0.03 0.03 0.03 0.03 0.03 0.03 0.04 0.04 0.04 0.04 0.08 0.05 0.07 0.10 0.08 0.06 0.07 0.06 0.09 0.13 0.22 0.29 2.88 2.86 2.97 2.94 2.86 2.91 2.97 2.97 2.97 2.88 2.94 2.91 2.86 2.88 2.91 2.83 2.88 2.94 2.86 2.75 2.86 2.86 2.94 2.97 1.04 1.05 0.99* 1.02 1.06 1.03 1.00 0.99* 0.98* 1.04 1.02 1.03 1.05 1.04 1.03 1.06 1.04 1.02 1.05 1.09 1.06 1.07 1.02 1.02 R R T T T T T T R T T T R T R T T T T T R T T T
Chavr
Results
Co-Doed
Poirut
--The symmetry of the perovskite phase for each sample as determined by powder x-ray diffraction is listed in Table 3.1 and showed excellent agreement with the structure predictions using the relative tolerance factor method (see Appendix III). A systematic composition exploration with polycrystalline
powder batches was successful in locating the rhombohedral (R) / tetragonal (T)
morphotropic phase boundary (MPB) to within 2 mol% Ba at a constant Zr level
up to - 10 mol% Zr. Figure 3.2 illustrates the trend in (200) peak for 3 mol% Zr
and varying Ba content from 4- 14 mol%. The rhombohedral pseudocubic {100} peaks are unsplit, since the crystallographic axes are of equal length. Figure 3.2 illustrates the increase in degree of (200) peak splitting as the Ba content is
increased, indicating an increase in the degree of tetragonality, c/a, from 0.011 at
8 mol% Ba to 0.014 at 14 mol% Ba. The ternary diagram in Figure 3.3 plots phase
symmetry versus composition, based on x-ray diffraction analyses.
t
ca a)
4-C:
Simulated Pattern: Na11 2Bi11 2TiO3 Rhombohedral i
(110) (200) (100) (2 (211) (11) _ (10 (111) il (211) (220) (2 0 2 ) (310 0 1 ) p 1 Rhombohedral 1 Ii I ) 0 Ietriao I l ip 10 Tetragonal 20 30 40 50 60 70 80 100 2-Theta Figure 3.1
X-ray Diffraction Patterns for Selected Single Phase Perovskite Powders
Simulation of the x-ray pattern for rhombohedral perovskite Na1/2Bil/2TiO3 used Jade (Jade, Inc., 1999) x-ray analysis software. The profile was generated based on x-ray data reported by Chang-lin et al. [39] as a Cauchy profile assuming a crystallite size of 1000 nm and includes Ka2. The undoped rhombohedral perovskite simulated profile is compared with single phase powder batches of co-doped NBT.
Results I: Co-Doved Polucrustals F- -" --- - ---i i I Ii i i i iI
o
Loo
Cr4 It Chapter 3N
m
z
CY)m
7
Coz
Coz
i C 0 m 0) 0 E 0 -c II 13 13, o 0 o0--o
N
0-o
00 o0 0 E C;I m o I--HI-
H-a) Ln , CU OC
Q 0 c5 O CD6
6
O6
0: CD III II I 0z
a) 0 C(O. 0)o
-0 c. o c 0) a0 .C + N o E O O 0 , ()-00
· Y Y r I I I i I i I i I i INa/ 2Bi1/2 ZrO3 'I, TB234 NBT 10 20 30 40 BaTiO 3 mol% BaTiO3 - * Figure 3.3
Phase Diagram for (Ba + Zr) Co-Doped NBT
Based on 1001 splitting in powder x-ray diffraction analyses of polycrystalline samples. The morphotropic phase boundary (MPB) between rhombohedral and tetragonal symmetry phases has been mapped for a portion of the field (up to 10 mol% Zr). Refer to Table 3.1 for sample identifications.
MPB ...
R = rhombohedral
T = tetragonal
![Table 3.3 Comparison of Piezoelectric kt NBT-4BT-3NBZ NBT-14BT-3NBZ NBT-6BT [26] PZT-8 [34] 0.45 - 0.51 - 0.34](https://thumb-eu.123doks.com/thumbv2/123doknet/14745845.578142/82.924.138.777.222.502/table-comparison-piezoelectric-nbt-nbz-nbt-nbz-nbt.webp)