Ice supersaturation as seen from TOVS
28
0
0
Texte intégral
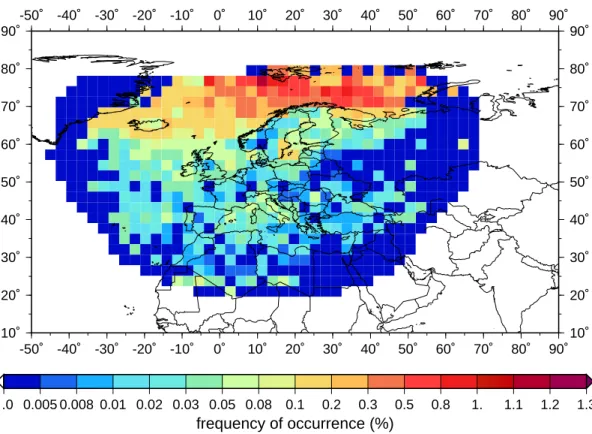
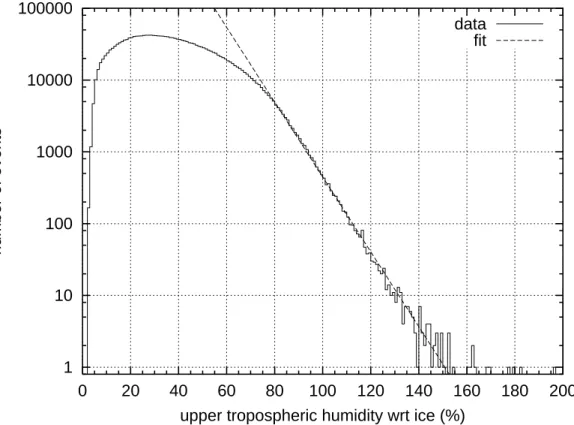
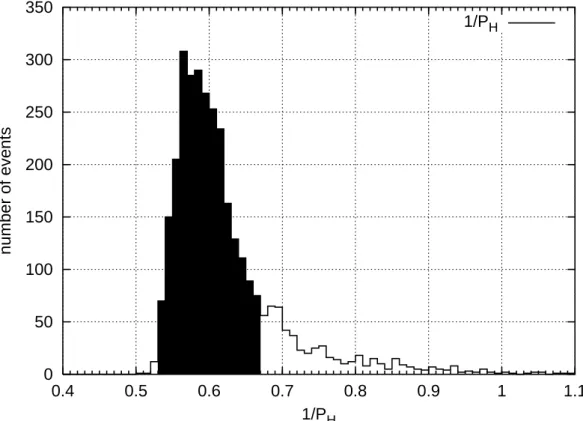
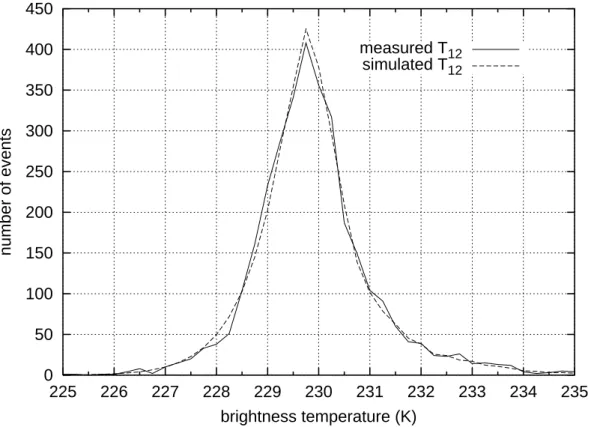
Figure

+4


Documents relatifs