Publisher’s version / Version de l'éditeur:
Vous avez des questions? Nous pouvons vous aider. Pour communiquer directement avec un auteur, consultez la première page de la revue dans laquelle son article a été publié afin de trouver ses coordonnées. Si vous n’arrivez pas à les repérer, communiquez avec nous à [email protected].
Questions? Contact the NRC Publications Archive team at
[email protected]. If you wish to email the authors directly, please see the first page of the publication for their contact information.
https://publications-cnrc.canada.ca/fra/droits
L’accès à ce site Web et l’utilisation de son contenu sont assujettis aux conditions présentées dans le site LISEZ CES CONDITIONS ATTENTIVEMENT AVANT D’UTILISER CE SITE WEB.
Internal Report (National Research Council of Canada. Institute for Research in Construction), 1990-09
READ THESE TERMS AND CONDITIONS CAREFULLY BEFORE USING THIS WEBSITE. https://nrc-publications.canada.ca/eng/copyright
NRC Publications Archive Record / Notice des Archives des publications du CNRC : https://nrc-publications.canada.ca/eng/view/object/?id=b5a0488a-d2da-4b80-abc9-ac7c46f38f85 https://publications-cnrc.canada.ca/fra/voir/objet/?id=b5a0488a-d2da-4b80-abc9-ac7c46f38f85
NRC Publications Archive
Archives des publications du CNRC
For the publisher’s version, please access the DOI link below./ Pour consulter la version de l’éditeur, utilisez le lien DOI ci-dessous.
https://doi.org/10.4224/20375600
Access and use of this website and the material on it are subject to the Terms and Conditions set forth at Report on Flexural Strength Tester for Quality Control of Expanded Polystyrene Insulation Boards
lnstitut de. recherche en construction
N.V. Schwartz, M.T. Bomberg, M.K. Kurnaran
Internal Report No. 600
This internal report, while not intended for general distribution, may be cited or
.
referenced in other publications.REPORT ON FLEXURAL STRENGTH TESTER FOR QUALITY CONTROL OF EXPANDED POLYSTYRENE INSULATION BOARDS
by
N.V. Schwartz, M.T. Bornberg and M.K. Kumaran
EXECUTIVE SUMMARY
An inexpensive flexural strength tester (FST) was designed and built at Plastifab Ltd. In the spirit of industrial cooperation with NRC, this tester was made commercially available to the whole Canadian Industry and one unit was evaluated by the Institute for Research in Construction. During this evaluation, significant differences were
observed between results obtained with this FST unit and a Tinius-Olsen apparatus used in accordance with the ASTM test method. The initial design of the FST was therefore
modified. Different modifications were tried until an
improved design appeared to give satisfactory results. This design of the FST was subjected to further testing which confirmed satisfactory agreement with the ASTM test method.
INTRODUCTION
The mission of the joint SPI/NRC-IRC research program is "to initiate and undertake Canadian research and development activities in cellular plastic insulation technologies to improve field performance". One of the five projects
undertaken within this program addresses the quality control of expanded polystyrene (EPS) thermal insulations. The
specific objective of this project is to assist the EPS manufacturers by developing readily accessible and
inexpensive tools for quality assurance and production control of moulded expanded polystyrene products.
The key elements of quality assurance for moulded expanded polystyrene products, according to the technical committee
of the Expanded Polystyrene Division of the SPI, are: 1)
thermal resistance and 2) flexural or compressive strength
(the latter for high density EPS products). This report deals with testing flexural strength only. It verifies a flexural strength tester (FST) used in the quality control
program of some EPS moulding plants, introduces some
modifications to the initial design and verifies the
improved FST version as well as proposes a test procedure.
Generally speaking, the objectives of research projects on EPS products were twofold: a short term objective to
identify key properties that can be used for quality assurance of moulded expanded polystyrene products and develop equipment and procedures to determine those
properties, and a long term objective to improve control of the moulding process and to enhance manufacturing EPS boards to the required technical specifications. For the short term objective, thermal resistance and flexural strength
have been identified as the key elements of material
evaluation for low density EPS, while for high density EPS
compressive strength is an additional key element. In the long term, establishing a correlation between these material properties and methods of foam structure characterization e.g. by means of computerized image analysis will contribute to industrial goals.
MATERIAL SELECTION
To achieve the above discussed objectives, different
production variables were considered, see Table 1. Four raw
materials were used at four plants and the experimental EPS
products were manufactured with three nominal densities: 11 kg/m3 (0.7 lb/ft3), 15 kg/m3 (0.9 lb/ft3), and 21 kg/m3
(1.31b/ ft3)
.
The low and standard density (11 and15 kg/m3) products were manufactured with two moulding techniques and two levels of reground material (0 or 10
percent). All these experimental EPS products were cut from
the moulded block either in the same way as the commercial products, i.e. horizontally (Figure la), giving 1.22 m
square boards, or vertically (Figure lb), giving 0.61 x 1.22 m boards.
As shown in Figures la and lb, each of these experimental products was sampled in three locations of the mould:
A in the centre of the block
B in the centre of the bottom layer
C at the mould door, in the top layer
Since each product batch is sampled at three locations and
three or four 25 mm thick boards were delivered to NRC for
testing, the number of production variables examined is equal to 48 and the number of experimental EPS boards is
approximately 150.
From these experimental boards samples were allocated for the following sub-projects:
1) development of an inexpensive flexural strength tester
(EST),
2) development of an inexpensive thermal resistance
apparatus, based on thin heater (TH) ASTM standard test method,
3) review of Quality Assurance methodology, to be proposed by the EPS technical committee, and in the context of QA measurements perform Round Robin with FST,
4) review of material variability with regard to
modification and improvement of the CGSB polystyrene thermal insulation standard,
5 ) development of method for characterization of cellular
structure of the EPS,
6 ) review of correlation between results obtained from EST,
This report deals only with the development of an
inexpensive flexural strength tester. A companion report
presents the development of an inexpensive thin heater (TH) apparatus to measure thermal resistance, (both these
instruments attain the precision of other commercial
instruments which are 5
-
10 times more expensive).However, the materials and methods examined here are part of a much broader research program aimed at the improvement of field performance of cellular plastics which will be
reported as the research progresses.
I N I T I A L DESIGN OF THE FLEXURAL STRENGTH TESTER
D e s c r i p t i o n of the F S T i n i t i a l design
The FST measures the breaking strength under uniaxial bending of a specimen subjected to continually increasing
load. The load is applied by adding lead shot to a graduated shot container. The specimen is rectangular
(300 mm long, 102 mm wide and 25 mm thick) and rests on two parallel supports placed 254 mm apart.
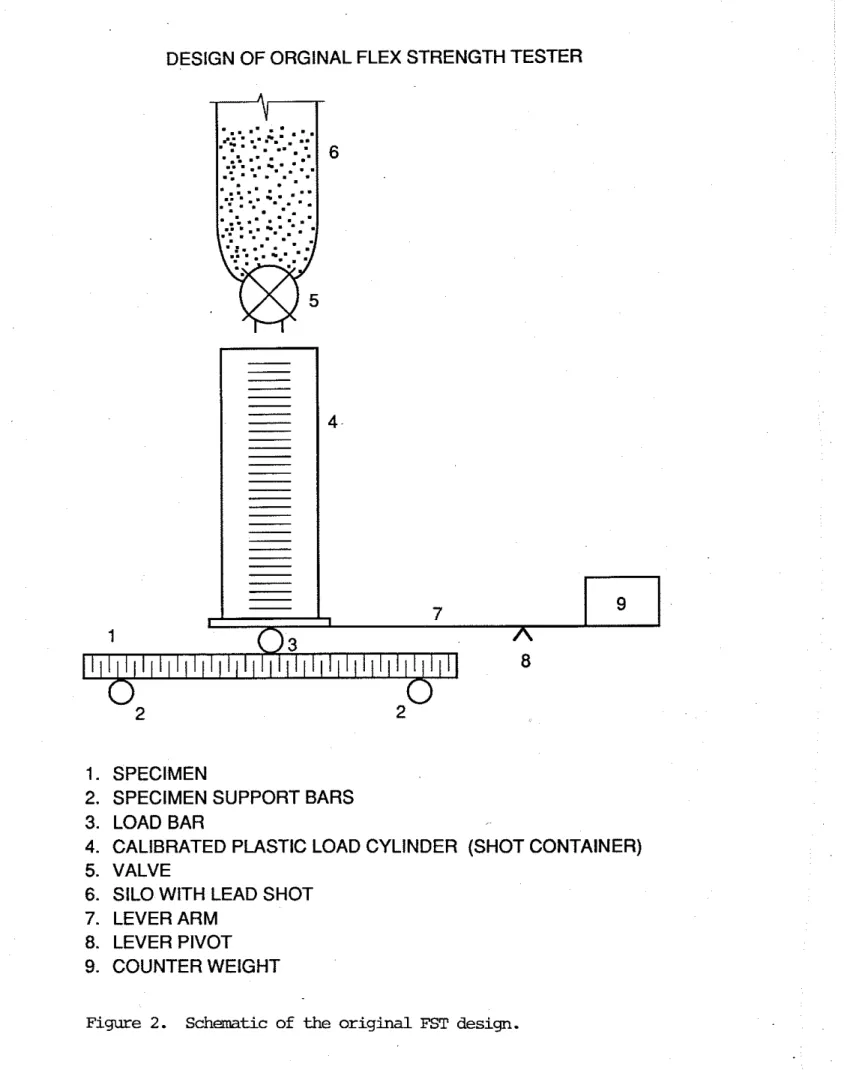
Figure 2 shows a schematic of the initial design. The lead
shot is discharged from a silo situated above the shot container, the flow being turned on (or off) by a valve at
the bottom of the silo. This valve is opened at the beginning of the test and closed immediately after the specimen breaks. The breaking load is then determined by reading the level of lead shot in the calibrated container. The maximum flexural strength at the moment of breaking is calculated and reported, see test procedure.
The shot container (internal diameter 82 mm and height
225 mm), is made out of polymethylmethacrylate (PMMA)
plastic. In the initial FST design the shot container is placed on a lever, which counterbalances the weight of the empty shot container before starting the test. The load from the shot container is transmitted to the test specimen through a cylindrical bar with diameter identical to that used for applying load in the ASTM standard test method
C 203 (Method I). Thus, the only difference between FST and the ASTM test method is in the rate of load application (see later discussion).
Testing of the initial FST design
First the shot container was calibrated by filling it to successively higher levels with shot and weighing the container at every half scale mark from 4.0 to 15.0 scale marks. A straight line regression of these weights minus
the tare weight of the empty container was obtained with a correlation coefficient of 0.99987.
Then, selected boards were cut with a table saw into
300 mm x 150 mm pieces and trimmed to 102 mm wide specimens
using the hot wire cutter mounted on the FST, see Figure 3(a). For four of these boards, the width of each specimen was measured in four places and the mean of each determined.
The overall mean was found to be 102.13 mm with a standard
deviation of 0.10 mm. Using the normal distribution, for 16 measurements and a 95% confidence level, the error in using the above mean is estimated to be less than 0.02%. For the remainder of the testing reported here a width of
102.13 mm was assumed for all specimens. The thickness
value used in the breaking strength calculation was the mean of eight micrometer measurements performed on each specimen. Measuring the thickness of each specimen was necessary since these EPS boards were cut in the manufacturing plants and the mean thickness of these specimens ranged between 22.9 mm and 25.2 mm. The actual variation of thickness in the test
specimens prepared on the FST unit is much smaller, see
Appendix 1.
The goal of this work is to compare results obtained on the FST and Tinius-Olsen (T-0) tester. The test specimens are, however, nonhomogeneous; the manner in which the specimens
t h e i r l o c a t i o n i n t h e mould) may t h e r e f o r e a f f e c t t h e r e s u l t s . Thus, a s d i s c u s s e d e a r l i e r , a t t h e p r o d u c t i o n s i t e , EPS b o a r d s were c u t a t s p e c i f i e d mould l o c a t i o n s . Furthermore, a s shown i n F i g u r e 4 , e a c h h o r i z o n t a l l y c u t b o a r d was d i v i d e d i n t o two sets ( 1 6 specimens e a c h ) s e l e c t e d
from 32 specimens o b t a i n e d b y c u t t i n g it i n t o an e i g h t by f o u r m a t r i x . One set ( 1 6 specimens) was t e s t e d on t h e FST w h i l e t h e o t h e r set was t e s t e d on t h e T-0 a p p a r a t u s .
Table 2 l i s t s r e s u l t s from t h e FST and T-0 t e s t e r . The normal c r o s s h e a d s p e e d u s e d w i t h t h e T-0 t e s t e r was e i t h e r 42 mm/min, a s r e q u i r e d b y t h e ASTM s t a n d a r d , o r 6 . 4 mm/min. The r a t e of d e f l e c t i o n i n t h e FST a p p a r a t u s was n o t
r e c o r d e d . Table 2 i n d i c a t e s t h a t t h e FST r e s u l t s were lower t h a n t h o s e o b t a i n e d w i t h t h e T-0 a p p a r a t u s , w i t h t h e r a t i o between t h e r e s u l t s of t h e two methods v a r y i n g from 1.08 t o
1.39 from p r o d u c t t o p r o d u c t . T h i s r a t i o i s r e f e r r e d t o as a c o r r e c t i n g f a c t o r i n t h i s r e p o r t . I n c a l c u l a t i n g t h e c o r r e c t i n g f a c t o r one assumes e q u a l i t y of t h e mean v a l u e s o b t a i n e d on e a c h set of 16 specimens s e l e c t e d i n t h e manner shown i n F i g u r e 4 . (The u n c e r t a i n t y i n d e t e r m i n i n g t h e mean v a l u e of t h e f l e x u r a l s t r e n g t h of e a c h set w i l l be d i s c u s s e d l a t e r ) .
The method of a p p l y i n g t h e l o a d i n t h e EST d e v i c e , w h i l e a p p r o p r i a t e i n t h e e a r l y s t a g e s of t h e t e s t , a p p a r e n t l y h a s
introduced inconsistencies in the more advanced stage of the test. At the beginning of the test, the axis of the shot container is vertical and perpendicular to the specimen. As lead shot is added to this cylinder and the specimen
deflects under the load, the lever forces the cylinder to tip out of the vertical position introducing a shift in the center of gravity. This appears to be the main cause of
variations in correcting factors shown in Table 2.
To equate.the results from EST to those of T-0 we have to multiply the former by the correcting factor. However, this approach of using a correcting factor is impractical because it varies from batch to batch and a T-0 or similar apparatus is needed for its determination. Therefore, the EST was modified by eliminating the lever and ensuring the vertical motion of the shot cylinder. While the first attempt was
unsuccessful, see Appendix 2, the second try, described
below, appears to produce the required improvement.
IMPROVED DESIGN OF THE FLEXURAL STRENGTH TESTER
Description of the improved FST design
The counterbalancing lever has been removed and the new
design of the FST is shown in Figure 3. To ensure the
were attached across the aluminium frame of the tester,
145 mm and 255 mm above the base, respectively. Each of
these supports is made with two 6 mm thick rectangles of
PMMA with arcs cut from one side, which when joined together provide a circle with a diameter slightly larger than the
shot container. This circle is provided with a few
protrusions to position the container while minimizing the friction during its movement in the vertical direction. For
ease of operation, the two front PMMA pieces are joined
together and hinged at one end to swing open for removal of the container or to lock the empty container in place during testing, and is referred to as the 'gate' in the test
procedure Appendix 3.
In the modified design, since the counterbalanced lever was removed, the weight of the container base with the attached loading bar becomes a part of the applied load. To reduce its weight the metal construction of the container base was replaced by the plastic one.
Testing of the improved FST design
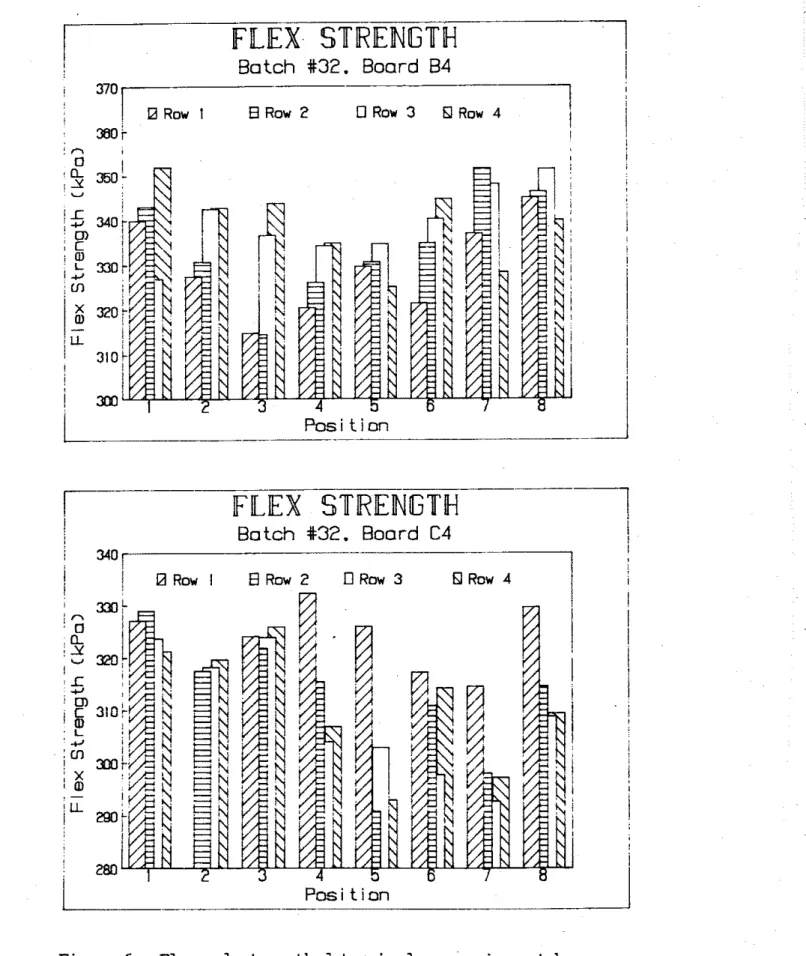
Two boards each of batch 31, a low density material, and
batch 32, a high density material, were tested with the
modified apparatus in the same fashion as described for the earlier tests. All results using the T-0 apparatus were
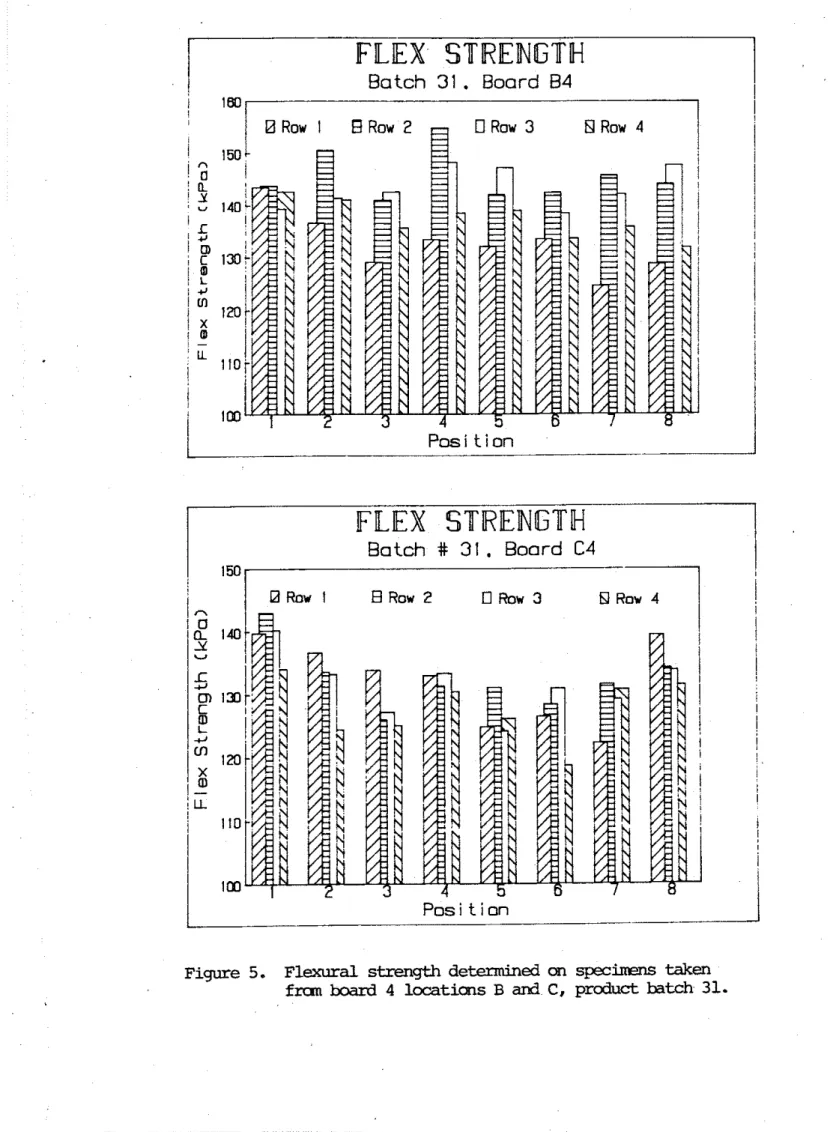
o b t a i n e d u s i n g a cross-head speed of 4 2 mm/min. Both, t h e mean v a l u e s which a r e l i s t e d i n Table 3 and t h e r e s u l t s f o r each of t h e specimens which a r e shown i n F i g u r e s 5 and 6 ,
i n d i c a t e t h a t t h e modified FST produced s a t i s f a c t o r y
agreement w i t h t h e T-0 t e s t e r . The c o r r e c t i n g f a c t o r i n a l l c a s e s i s c l o s e t o one, i n d i c a t i n g t h a t t h e T-0 t e s t e r can be used i n t h e QA programs.
DISCUSSION
C o m p a r i s o n of the FST and ASTM test m e t h o d s
ASTM test method C 203-85 method 1, procedure B ( c a l l e d f o r i n t h e CGSB s t a n d a r d ) , r e q u i r e s a c e n t e r l o a d i n g on a
specimen s u p p o r t e d on b o t h ends. For a specimen w i t h 25 mm t h i c k n e s s and 254 mm s u p p o r t span, t h e s p e c i f i e d c r o s s h e a d
speed i s 42 mm/min.
The FST, on t h e o t h e r hand, a p p l i e s a c o n s t a n t l o a d i n g r a t e induced by l e a d s h o t d i s c h a r g e d from t h e s i l o . Thus,
depending on t h e s t r e s s - s t r a i n c u r v e f o r t h e t e s t e d
m a t e r i a l , t h e r e w i l l b e d i f f e r e n c e s i n t h e d e f l e c t i o n r a t e o b t a i n e d w i t h t h e FST and ASTM t e s t methods. For i n s t a n c e , t h e r a t e a t which t h e s h o t c o n t a i n e r was f i l l e d d u r i n g t e s t i n g w i t h t h e FST corresponds t o a c r o s s h e a d speed of
12
T h e r e f o r e , an a d d i t i o n a l t e s t was performed t o examine t h e e f f e c t of change i n t h e c r o s s h e a d speed.
T h i s t e s t was performed on one EPS b o a r d ( b a t c h 1 2 ) w i t h t h e T - 0 a p p a r a t u s u s i n g two d i f f e r e n t c r o s s h e a d s p e e d s :
16 specimens from t h e b o a r d w e r e t e s t e d u s i n g 42 mm/min c r o s s h e a d speed, t h e o t h e r 16 w i t h 6 . 4 mm/min speed u s i n g t h e sampling p l a n shown i n F i g u r e 4 . A mean f l e x u r a l s t r e n g t h of 152.6 kPa ( s t a n d a r d d e v i a t i o n , s = 1 . 9 % ) was measured i n t h e t e s t w i t h t h e h i g h e r speed, and 157 kPa
( s = 2 . 3 % ) was measured i n t h e second c a s e .
The d i f f e r e n c e between t h e s e two mean v a l u e s ( 2 . 8 % ) may be compared t o t h e u n c e r t a i n t y of t h e mean v a l u e s . The l a t t e r i s c a l c u l a t e d a s a p r o d u c t of t h e s t a n d a r d d e v i a t i o n and t h e f a c t o r from p r o b a b i l i t y d i s t r i b u t i o n d i v i d e d by t h e s q u a r e r o o t of ( n - l ) , where n i s t h e number of t e s t s . With t h e s t a n d a r d d e v i a t i o n of 2.3%, and 95% c o n f i d e n c e l e v e l , t h e t - d i s t r i b u t i o n f a c t o r i s 1 . 7 5 and u n c e r t a i n t y of t h e mean v a l u e c a l c u l a t e d from 1 6 t e s t s becomes p l u s o r minus 1%.
T h i s v a l u e i s s m a l l e r t h a n t h e d i f f e r e n c e between t h e r e s u l t s o b t a i n e d w i t h d i f f e r e n t speed ( 2 . 8 % ) , i n d i c a t i n g t h a t a change i n c r o s s h e a d speed may a f f e c t t h e measured f l e x u r a l s t r e n g t h . The s i z e of t h i s e f f e c t , h a s t h e r e f o r e t o be d e t e r m i n e d by e x p e r i m e n t a l means.
Material variability.
The r e s u l t s o b t a i n e d on 32 specimens c u t from each t e s t e d board v a r i e d . I n most c a s e s , F i g u r e s 5 and 6 , t h e f l e x u r a l
s t r e n g t h was f a i r l y uniform a c r o s s t h e board o r v a r i e d randomly and d e v i a t i o n s of t h e s e p a r a t e specimens were s m a l l . I n a n o t h e r c a s e a more s y s t e m a t i c v a r i a t i o n was observed, f o r i n s t a n c e such a s between t h e r e s u l t s o b t a i n e d on specimens from rows 1 and 2 of t h e board B1 i n t h e b a t c h 34, see F i g u r e 7 . One s h o u l d n o t e t h a t F i g u r e 7 shows
v e r t i c a l c u t ( b o a r d s a r e h a l f of t h e s i z e of t h e h o r i z o n t a l ones, hence r e s u l t s f o r only 1 6 specimens a r e shown). The f a c t t h a t specimens from row 2 have c o n s i s t e n t l y h i g h e r
f l e x u r a l s t r e n g t h s t h a n t h o s e i n row 1, i n d i c a t e d i f f e r e n c e s between t h e lower and upper p a r t of t h e mould.
The mean v a l u e s of t e s t s d i s p l a y e d i n F i g u r e s 5, 6 and 7 a r e l i s t e d i n Table 3. R e s u l t s from b o t h equipment a r e
p r e s e n t e d t o g e t h e r : t h e T-0, g i v i n g s t a n d a r d d e v i a t i o n from 3 . 5 t o 4.5% ( b a t c h e s 31 and 3 2 ) , and t h e modified FST g i v i n g s t a n d a r d d e v i a t i o n from 2.5 t o 5.5% on t h e same product
b a t c h e s . Thus, 4.5% may b e used a s t h e average s t a n d a r d d e v i a t i o n f o r a l l t h e t e s t s shown i n Table 3.
For 95% c o n f i d e n c e l e v e l and s t a n d a r d d e v i a t i o n of 4.5%, t h e u n c e r t a i n t y of t h e mean v a l u e of 1 6 specimens i s 2 % . One
may, however, o b s e r v e t h a t f o r e a c h of t h e s i x c a s e s l i s t e d i n Table 3 , t h e d i f f e r e n c e s between mean r e s u l t s o b t a i n e d e i t h e r w i t h T - 0 o r FST equipment a r e a l s o w i t h i n 2 % . Thus, t h e d i f f e r e n c e between t h e T-0 and FST r e s u l t s i s w i t h i n t h e u n c e r t a i n t y of t h e mean v a l u e o b t a i n e d from e a c h of t h e
t e s t i n g a p p a r a t u s .
I n e f f e c t , s e l e c t i n g two s e t s , e a c h c o n t a i n i n g 1 6 specimens from any one l o c a t i o n i n t h e EPS mould ( a s shown i n F i g u r e s 4 and l), gave a s u f f i c i e n t b a s i s f o r comparison of
d i f f e r e n t t e s t methods. T h i s comparison i n d i c a t e s t h a t t h e improved FST h a s b o t h p r e c i s i o n and r e p r o d u c i b i l i t y
s u f f i c i e n t f o r u s e i n t h e i n d u s t r i a l q u a l i t y a s s u r a n c e programs. A t e s t p r o c e d u r e recommended f o r QA programs i s
d e s c r i b e d i n Appendix 3 .
CONCLUDING REMARKS
S t a n d a r d l a b o r a t o r y equipment a s used f o r ASTM t e s t i n g i s
o f t e n beyond t h e means of s m a l l m a n u f a c t u r e r s ; t h e r e f o r e , a j o i n t SPI/NRC p r o j e c t undertook development of some new and i n e x p e n s i v e Q u a l i t y Assurance t o o l s . T h i s r e p o r t reviewed a f l e x u r a l s t r e n g t h t e s t e r o r i g i n a l l y developed by P l a s t i f a b Ltd. I n t h i s a p p a r a t u s t h e l o a d i s a p p l i e d by adding l e a d s h o t t o a c a l i b r a t e d p l a s t i c c y l i n d e r u n t i l t h e specimen b r e a k s . The b r e a k i n g l o a d i s determined by c a l c u l a t i o n from
the level of lead shot in the container at the end of the test.
Inconsistencies between results from the FST and a standard Tinius-Olsen tester were obtained when specimens from the same board of expanded polystyrene were tested on each, and the results from several boards were compared. It was
apparent that the inconsistencies were due to the method of applying the load in the FST. While at the start of the test the counterbalanced shot container is perpendicular to the specimen, this is not the case when the specimen
deflects under the load. The FST was modified by discarding
the lever arrangement and placing the shot container with the load bar directly on the specimen. The modified support ensured that the shot container remained perpendicular to the specimen throughout the test.
Results obtained with the modified FST and those obtained on the same material with the Tinius-Olsen tester agreed to
within 2%. One can therefore proceed to the next stage of
the SPI/NRC project that involves comparative series of testing with FST operated at various EPS manufacturing
plants. This will be performed in two stages. In the first stage, the operator of each FST will acquire some experience
with the procedure recommended in Appendix 3; in the second
and FST equipment, will be performed between different FST
equipments using specimen sets distributed from NRC.
ACKNOWLEDGEMENT
The authors express deep gratitude to Mr. J.G. Theriault for
TABLE 1
Description of experimental EPS products included in the SPI/NRC joint research program.
Batch Raw Mfg. Nominal Moulding Reground
code mat. plant density method material
code code kg/m3 code percent
(a) Horizontally cut batches
TABLE 2
Mean f l e x u r a l s t r e n g t h of 16 EPS specimens from each board t e s t e d w i t h T - 0 and 16 EPS specimens from each board t e s t e d with t h e i n i t i a l d e s i g n of t h e EST equipment.
B a t c h C o d e 11 11 11 12 12 12 B o a r d C o d e A4 B4 C4 A4 B4 C4 F l e x u r a l strength speed (mm/min) 42 4 2 6.4 42 4 2 6.4 mean (kPa) 283.3 230.8 238.9 173.9 144.1 140.2 s t d . dev. (kPa) 14.5 7.0 7.4 5.8 5.8 4.9 s t d . dev. ( % ) 5.1 3.0 3.1 3.3 4.0 3.5 FST mean (kPa) 216.2 201.0 220.6 125.1 118.9 123.9 s t d . dev. (kPa) 13.4 6.4 5.7 4.5 3.2 4.1 s t d . dev. ( % ) 6.2 3.2 2.6 3.6 2.7 3.3 C o r r e c t i n g f a c t o r * 1.31 1.15 1.08 1.39 1.21 1.13
*
R a t i o of mean v a l u e s from T-0 and modified ESTTABLE 3
Mean f l e x u r a l s t r e n g t h of 1 6 EPS specimens from each board t e s t e d w i t h T-0 and 1 6 EPS specimens from each board t e s t e d w i t h t h e improved d e s i g n of t h e FST equipment. Batch Code 3 1 3 1 33 3 2 3 2 3 4 Board Code B4 C4 B 1 B 4 C4 B 1 Flexural strength . T-0 mean (kPa) 139.7 132.2 140.7 335.8 312.4 345.8 s t d . dev. (kPa) 5.3 4 . 8 9 . 1 1 1 . 7 1 4 . 1 13.5 s t d . dev. ( % ) 3 . 8 3 . 6 6 . 5 3.5 4 . 5 3 . 9 FST Mean (kPa) 142.7 132.3 139.9 342.2 321.9 354.7 s t d . dev. (kPa) 7 . 9 5 . 9 9 . 8 8 . 5 9 . 6 1 9 . 4 s t d . dev. ( % ) 5 . 5 4 . 5 7 . 0 2 . 5 3 . 0 5.5 Correcting factor* 0 . 9 8 1 . 0 0 1 - 0 1 0 . 9 8 0 . 9 7 0 . 9 8
Appendix 1. Error introduced by thickness variation
Thickness measurements were performed on 8 EPS specimens prepared with the help of the procedure described in
Appendix 3. One set of measurements was made at 8 points on
each specimen, at 60, 120, 180 and 240 mm from one end and 15 mm from each side. Another set of measurements was made
at three points along the mid-line at 75, 150 and 225 mm
from one end of each specimen. Table A1 lists the results.
TABLE A 1
Comparison of eight- and three-point thickness measurements on specimens prepared using the hot wire cutter in FST unit.
Specimen Mean and standard deviations of thickness (mm)
code 8 points 3 points
mean st. dev. mean
From these results one can evaluate precision of the
procedure that was recommended for thickness determination: the average thickness of the board was to be determined from a minimum of five tests, each comprising measurements at
three points. Using first 5 specimens from three point measurements, the average board thickness (determined with
the procedure recommended in Appendix 3) was L = 26.46 mm.
Two standard deviations on the worst set of measurements
(2 x 0.07 = 0.14 mm) is 0.5% of 26.46 mm. Bearing in mind that the second power of thickness is used in calculation of the flexural strength, the error may be estimated as
( (~+dl)* - L ~ ) / L ~ . With L = 26.46 mm and dl = 0.14 mm the
error estimate is 1.0%. This means the recommended
procedure for thickness determination may be used for
calculations performed during the same production run or as
long as the type of the product and FST adjustments were not
Appendix 2. Interim FST modification
Another modification of the FST, in which the axis of the graduated load container was maintained in a vertical position during the test by having the light plastic platform slide on four post was also tried but deemed unsuccessful.
The platform was made out of PMMA plastic and positioned
with four 7 mm diameter posts installed in the base of the
unit. Four holes drilled near the edges of the container platform allowed vertical movements while the shot container was centered over the specimen. The results on four boards tested with this modification of the FST and T-0 tester are
shown in Table A2.
Discussion
It was observed that during the application of the load the load platform did not descend smoothly, but there appeared to be some friction between the platform and the guide posts. This caused a difference between the results from the two testers. Although smaller than in the initial FST
design, the difference of 4 - 12% was still deemed
unacceptable. Since this difference did not seem to be readily corrected by lubrication, another method of
maintaining the axis of the shot container perpendicular to the test specimen was tried.
TABLE A2
Mean flex strength for EPS boards tested with Tinius-Olsen and modified FST
B a t c h C o d e 31 B o a r d C o d e A3 T-0 mean (kPa) 121.1 328.8 131.4 310.0 std.dev. (kPa) 4.8 7.5 4.5 10.5 std.dev. ( % ) 3.9 2.3 3.4 3.4 P l a s t i f a b mean (kPa) 137.3 363.2 137.6 329.2
std.dev. (kPa) 6.4 11.2 10.8 li.6
std-dev. ( % ) 4.7 3.1 7.8 3.0
C o r r e c t i n g
f a c t o r * - 8 8 .91 .96 .94
*
Ratio of mean values from T-0 and the first modification of FST equipmentAppendix 3 . A t e s t procedure
Using a saw o r k n i f e c u t p i e c e s of EPS b o a r d 125 - 150 mm
wide by 300
-
350 mm l o n g . To c u t specimen f o r t e s t i n g , do t h e f o l l o w i n g :1. Turn on m a s t e r power s u p p l y s i t u a t e d on t h e under s i d e of t h e t e s t t a b l e . C u t t e r s e l e c t s w i t c h must be i n t h e "MIDDLE" p o s i t i o n . 2. Swing o u t c u t t i n g h a r p a t t a c h e d t o t h e s i d e of t h e t a b l e and s u p p o r t it w i t h t h e arm a t t a c h e d t o t h e r i g h t f r o n t t a b l e l e g . 3. With a r u l e r , measure t h e w i r e s p a c i n g on e a c h s i d e of t h e h a r p . For a nominal 25 mm t h i c k board, t h e y s h o u l d be 2 5 t o 27 mm a p a r t . A d j u s t i f n e c e s s a r y .
4 . P l a c e t h e roughly shaped s l a b on t h e s l o p e d t a b l e w i t h
a weight b o a r d on t o p t o h o l d t h e p i e c e down.
5 . Move t h e c u t t e r s e l e c t s w i t c h t o t h e "SLOPE" p o s i t i o n .
6. Allow t h e sample t o s l i d e down and t h r o u g h t h e h a r p , b e i n g s u r e t o c a t c h t h e p i e c e on t h e o t h e r s i d e .
To c u t 100 mm (nominal width) specimens:
1. Move t h e c u t t e r s e l e c t s w i t c h t o t h e "FLAT" p o s i t i o n . 2. L i f t t h e f l a t h a r p l o c a t e d on t h e t a b l e t o p and i n s e r t
3 . Lower the harp and let it melt through the material under its own weight. When the harp has passed
completely through the piece, remove the 100 mm
specimen.
Measurement of Specimen Dimensions:
1. Accurately measure the wldth of five specimens with a
micrometer at four equally spaced locations along the length of the specimen, record the values and calculate the mean value. This mean value can be used for the width of other specimens cut with the apparatus for the rest of the day or production shift.
2. Accurately measure the thickness of five specimens with
a micrometer at four equally spaced locations, record and calculate the mean value. This mean value can be used for the thickness of other specimens cut with the apparatus for the rest of the day or the production shift.
Testing of Specimens for Flexural Strength
1. With the gate open lay the specimen across the two
supports and against the guide pegs protruding from the base.
2. Slide the shot container completely into the plastic
s h o t s i l o w i t h t h e l o a d b a r r e s t i n g on t h e specimen and t h e s h o t c o n t a i n e r p l a c e d a g a i n s t t h e two f i x e d p l a s t i c g u i d e s .
3 . Holding t h e s h o t c o n t a i n e r i n p l a c e w i t h one hand,
c l o s e t h e g a t e of c o n t a i n e r v e r t i c a l s u p p o r t and s e c u r e it w i t h t h e b o l t .
4 . Turn t h e knob on t h e aluminium s h o t s i l o t o s t a r t t h e flow of l e a d s h o t i n t o t h e measuring t u b e .
5. When t h e specimen b r e a k s , s t o p t h e f l o w of s h o t a s q u i c k l y a s p o s s i b l e .
6 . Open t h e g a t e and remove t h e assembly c o n t a i n i n g t h e s h o t c o n t a i n e r and t h e l o a d p l a t f o r m . S l i d e t h e s h o t c o n t a i n e r o u t of t h e l o a d p l a t f o r m and p l a c e it on a smooth l e v e l s u r f a c e .
NOTE: WHEN MOVING THE ACRYLIC SHOT CONTAINER FILLED W I T H
SHOT ALWAYS SUPPORT I T FROM BELOW TO PREVENT THE
SEPARATION OF THE BOTTOM FROM THE CONTAINER.
7 . Shake t h e s h o t c o n t a i n e r l i g h t l y by s l i d i n g it back and f o r t h on t h e smooth s u r f a c e t i l l t h e l e a d s h o t a p p e a r l e v e l .
8 . Read t h e l e v e l of t h e beads and r e c o r d . A r u l e r marked i n m i l l i m e t e r s ( o r i n t e n t h s of an i n c h ) h e l p s r e a d i n g l e v e l s between t h e markings on t h e c o n t a i n e r . Add t h e weight of t h e c o n t a i n e r b a s e t o t h e weight of l e a d s h o t and c a l c u l a t e t h e b r e a k i n g l o a d , L.
9 . P o u r l e a d s h o t back i n t o s i l o . 1 0 . Repeat t h e p r o c e d u r e f o r t h e n e x t specimen. 11. C a l c u l a t e t h e f l e x u r a l s t r e n g t h of e a c h specimen u s i n g t h e f o l l o w i n g e q u a t i o n : f l e x u r a l s t r e n g t h i n kPa = where L = b r e a k i n g l o a d i n kg S = s p a n i n mm ( 2 5 4 rnm i n FST) W = w i d t h i n mm T = t h i c k n e s s i n mm
DESIGN OF ORGINAL FLEX STRENGTH TESTER
1. SPECIMEN
2. SPECIMEN SUPPORT BARS
3. LOAD BAR
4. CALIBRATED PLASTIC LOAD CYLINDER (SHOT CONTAINER) 5. VALVE
6. SILO WITH LEAD SHOT 7. LEVER ARM
8. LEVER PIVOT
9. COUNTER WEIGHT
Figure 4
Sampling pattern for comparative testing
P o s i t i o n 1 2 3 4 5 6 7 8
Row
Specimns m k e d "I" axe selected to one sample,
FLEX STRENGTH
I
Batch 31.
Board 84I
I/
O RowI
B
Row 2 0 Row 3 8 Row 4Posi tion
FLEX STRENGTH
1
I
B a t c h # 31. BoardC4
1
I
150 Ii
1;3 ROW tB
ROW 2 Row 3 6) ROW-7
413
I -
ILL
Posi t i o n
Figure 5. Flexural strength determined on spec- taken frcm board 4 locaticms B and C, product batch 31.
FLEX
STRENGTH
I
IBatch #32. Board 84
i i !I
:
! I370rZT-L0w
2 • Row 3 6l Row 4mi
I
Ii
Posi tion .- --J
I
FLEX
-
STRENGTH
7
I
Batch #32. Board
C4i
I i 3401 --
-
I7
61 Row 41
! I Posi tion -- -Figure 6 . Flexural strength determined on specimens taken
FLEX
STRENGTH
1
B a t c h#33.
BoardBI
I
IBO/!
I 0 Row 1i
Posi t i o n1
FLEX STRENGTH
B a t c h #34. Board 81 II
I
Posi t i o nI
Figure 7. F l e x u ~ a l strength determined on specim=ns taken from board 1 location B, product batches 33 and 34. Note that these specimens are -cuI.ax
to tbose in location B of batches 31 and 32 shown