Architectures for Individual and Stacked Micro Single Chamber Solid Oxide Fuel Cells by
Ethan Jon Crumlin B.S., Mechanical Engineering
Massachusetts Institute of Technology, 2005 Submitted to the Department of Mechanical Engineering in Partial Fulfillment of the Requirements for the Degree of
Masters of Science in Mechanical Engineering at the
Massachusetts Institute of Technology June 2007
© 2007 Massachusetts Institute of Technology All rights reserved
Signature of Author Certified by...
7V/
Accepted by... MASSACHUSETTS INSTITUTE T CH 04 e etOf Mechanical Engineering May 19, 2007
.. ...~~~~~~... ... ... . . . . Yang Shao-Horn Assistant Professor of Mechanical Engineering Thesis Supervisor
... ...
Lallit Anand Professor of Mechanical Engineering Chairman, Department of Graduate Committee
B~ARKER
MASSACHUSETTS INST!TUTE OF T~C;H L~o
Architectures for Individual and Stacked Micro Single Chamber Solid Oxide Fuel Cells by
Ethan Jon Crumlin
Submitted to the Department of Mechanical Engineering On May 19, 2007 in Partial Fulfillment of the Requirements for the Degree of Masters of Science in
Mechanical Engineering
ABSTRACT
Solid oxide fuel cells (SOFCs) are electrochemical conversion devices that convert various fuel sources directly into electrical energy at temperatures ranging from 600'C to 1000'C. These high temperatures could potentially allow the direct use of various hydrocarbon fuel sources and hydrogen, without the need for expensive noble metal catalysis. Conventional SOFCs are designed in a two-chamber system, separating the fuel and oxidant flow to the anode and cathode, respectively. However, fuel cell manufacturing cost and robustness have proven to be the main challenges to rapid commercialization. A promising alternate method to achieve these requirements and to open up new architecture designs for the SOFC is the development of single-chamber solid oxide fuel cells (SC-SOFCs). SC-SOFCs avoid many of the manufacturing challenges associated with conventional SOFCs, and have shown optimal performance between 500*C and 800'C. This reduces the need for high temperature sealing and a complicated manifold structure; however it also reduces the partial pressure of the gases at the electrodes, which reduces the theoretical obtainable voltage.
Microfabrication techniques such as photolithography, sputtering, and photo-resist liftoff were used to create various micro SC-SOFC that are 25-400microns long and 15-40microns wide, utilizing platinum and gold for the electrodes and YSZ as the electrolyte. After successfully fabricating these micro SC-SOFCs, the fuel cells were tested in a microprobestation with a custom gas chamber enclosure, which was exposed to CH4:0 2:N 2 at 20:20:100 ccm or 40:20:100 ccm.
A switch in the OCV from a negative voltage to a positive voltage was observed around 600'C, possible indicating change in electrochemical reactions with temperature. An OCV of -0.4V and peak power density of 27 [W/cm2 at 900'C in a 1:1 methane:oxygen ratio was
achieved. A stack of 10 micro SC-SOFCs as fabricated showing a cumulative OCV of 3.3 V, of an average 0.33 V per cell at 600'C in a 2:1 methane:oxygen ratio.
Ongoing research will involve characterizing micro SC-SOFCs to understand the fundamental reaction mechanisms, electrode materials, and architectures to obtain dense, high performing stacks of micro SC-SOFCs.
Thesis Supervisor: Yang Shao-Horn
LIST OF PUBLICATIONS
1. Crumlin, E. J., G. J. la 0', and Y. Shao-Horn, Architectures and Performance of High-Voltage, Microscale Single-Chamber Solid Oxide Fuel Cell Stacks, the Electrochemical Transactions, in press (2007).
2. la 0', G.J., H.J. In, E. Crumlin, G. Barbastathis and Y. Shao-Horn, Recent Advances in Microdevices for Electrochemical Conversion and Storage, invited review paper, International Journal of Energy Research, 31, 548-575 (2007).
ACKNOWLEDGMENTS
I would like to give my sincere gratitude to my family. Mom, dad and bud: you have always been there to support me through the hard times and share with me the moments of success. You have loved me, shaped me, guided me to become the person I have become. Thank you and I love you all deeply.
Professor Yang Shao-Horn: you are my research advisor, academic advisor, and personal advisor. I thank you immensely for your guidance, wisdom, challenges, and most important, your respect. You have helped me control and grow my strengths as well as pushed me to improve my weaknesses. Your effort, patience, candidness, intellect, wisdom, and energy are all characteristics I admire and benefit from. I look forward to working with you in many more endeavors.
To my fellow lab mate, graduate student Gerardo Jose la 0': thank you for all of your guidance, advice. Thank you for always being there to help even when it was inconvenient for you. You are a great person to learn from and work with, and I hope we can do so for a long time to come. A special thanks to Kurt Broderick, one of the key support staff at MIT's Micro Technology Laboratory; thank you for all your help with the fabrication involved in this thesis. Thanks to all of my lab members for their continuous
support and effort to help me move forward with my research.
In addition, I would like to thank all of my college mentors who have provided continuous guidance and support throughout all of my undergraduate and graduate career. Professor Kip Hodges, Professor Alex Slocum, Professor David Wallace, you have all helped me reach the goals and gain the experiences I have hoped to achieve. Thank you very much for everything.
I would like to extend a special thanks to Lu Chen for editing my thesis and putting a smile on my face everyday.
This work was supported by the GEM fellowship, MIT-Lemelson Fund, Ford-MIT Alliance, MRSEC Program of the National Science Foundation under award number DMR 02-13282.
ABOUT THE AUTHOR
I was born in Northampton, Massachusetts, on May 6, 1983. I attended Flag Street Elementary School in Worcester, Massachusetts where I developed my interest in science and engineering by participating in my school's science fair and winning 3 out of 4 years. After the 6th grade, I attended Forest Grove Junior High School, where for three days a
week, Principle Joseph Murphy would drive several of us to the local high school for a special math class. Junior high is when I started to do Tae Kwon Do and developed an interest in music. I spent two years at Doherty Memorial High School where I played football for two years. I also joined a swim team, became a lifeguard, and taught swim lessons. After two years I attended a focused junior-senior high school, Massachusetts Academy of Mathematics and Science. My science and engineering abilities where nurtured and developed through academics as well as extracurricular activities, namely, FIRST. Through participating in FIRST, I learned how to work in a machine shop, use engineering principles and techniques to design and build. This experience was a fundamental tool that helped me truly excel and learn on my own.
In 2001, I graduated from high school and moved to Cambridge, Massachusetts to study Mechanical Engineering at MIT. I have felt both humbled and honored during my time at MIT; learning discipline and control, while absorbing the tools and resources to excel in my field. During the summers, I have held internships with Intel in Phoenix, Arizona, Texas Instruments in North Attleboro, Massachusetts, and Apple, Inc (for three summers) in Cupertino, California. Upon graduating in 2005 with my Bachelor of Science degree in Mechanical Engineering, I decided to pursue further academic goals at MIT. During the last two years while working towards my Masters of Science degree in Mechanical Engineering, my academic focus has been on new alternative energy technologies, such as various low temperature and high temperature fuel cell projects, one of which is the culmination of my master's thesis research to follow. Professionally I focus on product design; I founded a startup company, OneWorld Medical Devices, which I led to become Runners-Up in MIT's $100k business-plan competition. I was also recruited to join another startup company, RallyPoint, where I am the lead mechanical engineer for an intelligent device for your hands. I have carried my passion for product design towards teaching others as well. I have mentored or been a lab instructor for a senior product design class (2.009), sophomore design class (2.007), and a toy design class.
Looking ahead, I am planning to obtain my PhD with the hopes of becoming a professor at a leading institution such as MIT. Additionally, I'd like to continue my entrepreneurial efforts and create new startups to continue working on a variety of new products and innovations to enhance our lives.
LIST OF FIGURES
Figure 1: A traditional two chamber fuel cell assembly comprised of two electrodes on either side of an electrolyte. For SOFCs the cathode distributes electrons to reduce oxygen to make an oxygen anion. The anion travels through the electrolyte to the anode where it oxidizes with the fuel and donates the electron, completing the electrochem ical reaction. ... 24 Figure 2: High performing SOFC with 5micron thick LSGM film electrolyte using a
400nm thick SDC buffer layer to interface electrolyte and electrode. Using H2 and
02 over anode and cathode respectively at a flow rate of 120mL/min. (7)... 25 Figure 3: Single chamber solid oxide fuel cell (SC-SOFC)... 25 Figure 4: Two chamber SOFC results (a) SC-SOFC results (b) (41). ... 26 Figure 5: An example of proposed electrochemical reactions for a SC-SOFC exposed to
m ethane and oxygen... 27 Figure 6: Planar SC-SOFC Architecture... 29 Figure 7: Through-Plane SC-SOFC Architecture... 29 Figure 8: The difference between active area of Planar and Through-Plane
configurations. The right most image compares the relative size of each active area and shows that the area of the Planar configuration is more than two times that of the Through-Plane configuration. ... 30 Figure 9: The effect of changing the distance between electrodes in a planar SC-SOFC
configuration as shown in Figure 6. Note that the wider the gap the worse the perform ance (19)... 32 Figure 10: Analytical model predicting the effect of distance between two electrodes (a)
and electrolyte thickness (b) on planar SC-SOFC performance (13). ... 33 Figure 11: Planar SC-SOFC varying electrolyte thickness. If the electrolyte is too thin
the fuel cells performance could be reduced. If it is too large, fuel cell performance is not significantly affected. (figure is representative, not actual experimental or analytical values)... . . 34 Figure 12: The effect of electrolyte thickness on performance in a through-plane
SC-SOFC configuration shown in Figure 7. Note increasing thickness decreases perform ance (19)... . . 35 Figure 13: Schematic for stacking SC-SOFCs ... 35 Figure 14: Schematic for individual micro SC-SOFC test cells... 38 Figure 15: Schematic for planar single (a) or multiple (b) interconnect micro SC-SOFC
sta c k ... 3 9 Figure 16: Steps for micro SC-SOFC fabrication... 40 Figure 17: Typical IV graph for SOFC operating at 8000C(5)... 41
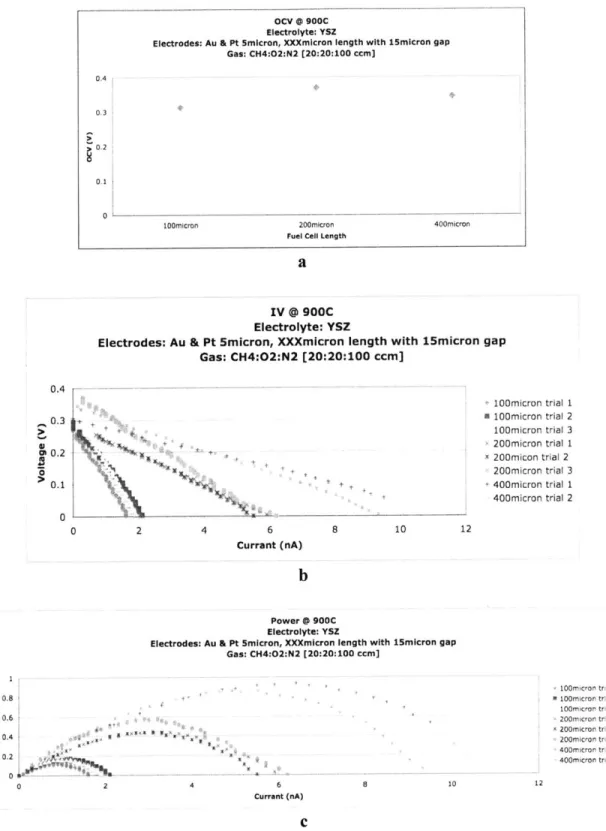
Figure 18: Simplified fuel cell circuit diagram where R,, and C. represent the effects imposed by the electrolyte and R2 and C2 represent the electrode effects (a). Ideal ac impedance plot for the circuit above (b) (46)... 43 Figure 19: An individual micro SC-SOFC with 15micron by 400micron Pt and Au
electrodes in 1:1:5 methane:oxygen:nitrogen fuel ratio, OCV at various temperatures (a), current-voltage at various temperatures (b), current density-power density at various tem peratures (c),... 46 Figure 20: Au and Pt electrodes on YSZ electrolyte upon a silicon substrate at 400'C
exposed to various gas compositions: Nitrogen (a), Oxygen (b), Methane (c), Methane:Oxygen:Nitrogen in a 1:1:5 volume flow rate ratio(d)... 48 Figure 21: Au and Pt electrodes on YSZ electrolyte upon a silicon substrate at 850'C
exposed to various gas compositions: Nitrogen (a), Oxygen (b), Methane (c), Methane:Oxygen:Nitrogen in a 1:1:5 volume flow rate ratio(d)... 49 Figure 22: Individual micro SC-SOFC with 5micron wide Pt and Au electrodes
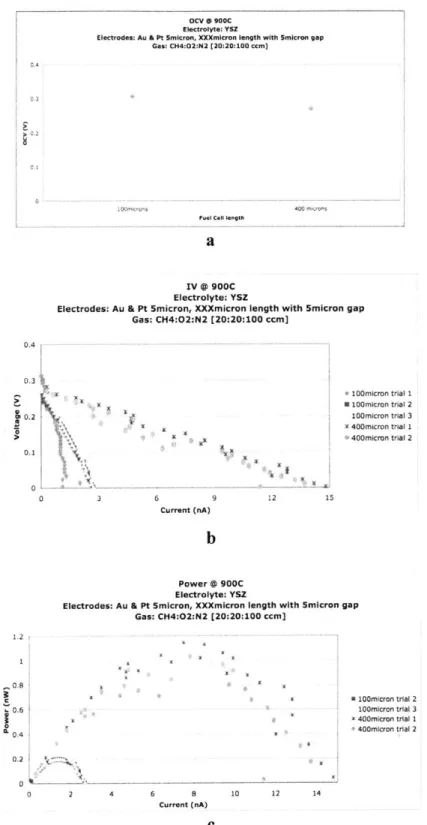
separated by a gap distance of 15micron and exposed to methane:oxygen:nitrogen in a 1:1:5 fuel ratio at 900C, average OCV as a function of fuel cell area holding the electrode width constant at 5microns and varying the electrodes length (a) current-voltage (b) current-power (c)... 52 Figure 23: Individual micro SC-SOFC with 5micron wide Pt and Au electrodes
separated by a gap distance of 5micron and exposed to methane:oxygen:nitrogen in a 1:1:5 fuel ratio at 900*C, average OCV as a function of fuel cell area holding the electrode width constant at 5microns and varying the electrodes length (a) current-voltage (b) current-pow er (c)... 53 Figure 24: Two separate trials for various 'PtAu' width electrodes that are 400micron
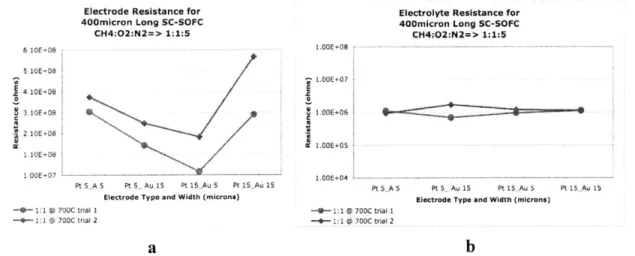
long exposed to 1:1:5 ratio of methane:oxygen:nitrogen at 7000C, average electrode resistances (a), average electrolyte resistances (b). ... 55 Figure 25: Various 'PtAu' width electrodes that are 400micron in length exposed to
2:1:5 ratio of methane:oxygen:nitrogen at 600'C and 700'C, average electrode resistances (a), average electrolyte resistances (b). ... 56 Figure 26: Various 'Pt _Au' width electrodes that are 100micron, 200micron and
400micron in length exposed to 2:1:5 ratio of methane:oxygen:nitrogen at 6000C, average electrode resistances (a), average electrolyte resistances (b). ... 57 Figure 27: 5micron wide Pt and Au electrodes separated by a gap distance of 5micron,
10micron, and 15micron exposed to 2:1:5 ratio of methane:oxygen:nitrogen at 6000C, average electrode resistances (a), average electrolyte resistances (b)... 58 Figure 28: 10 cells connected in series measuring the overall OCV as well as the OCV
between the first 8, 6, 4, 2 and 1 cells. Each individual cell is 400micron long with 5micron wide electrodes, exposed to 2:1:5 methane:oxygen:nitrogen at 600'C... 59 Figure 29: CHEMKIN thermodynamic equilibrium simulation over various
TABLE OF CONTENTS
A b stract... 3
List of Publications ... 5
Acknowledgm ents... 7
About the Author ... 9
L ist o f F ig u res ... 13
L ist o f T ab le s ... 19
1.0 In tro d u ctio n ... 2 1 1.1 M otivation ... 21
1.2 Solid Oxide Fuel Cell Fundamentals ... 22
1.2.1 Solid Oxide Fuel Cell ... 22
1.2.2 Thermodynamics of Electrochemical Reaction ... 22
1.2.3 Traditional Two-Chamber SOFC Architecture and Performance ... 23
1.3 Single-Chamber Solid Oxide Fuel Cell ... 25
1.3.1 Single-Chamber SOFC Concept ... 25
1.3.2 Design of Electrode Activity and Selectivity for SC-SOFCs...27
1.4 Single-Chamber Solid Oxide Fuel Cell Architectures... 29
1.4.1 Planar Design ... 29
1.4.2 Through-Plane Design... 29
1.4.3 Comparing Planar vs. Through-Plane ... 30
1.5 Relating Electrode and Cell Configurations to SC-SOFC performance...31
1.5.1 Electrolyte Resistance... 31
1.6 Single-Chamber Solid Oxide Fuel Cell Stacking ... 35
2.0 Experimental... 37
2.1 Material Selection and Material Synthesis for micro-SC-SOFCs...37
2.2 SC-SOFC Design... 37
2.2.1 Individual SC-SOFC design ... 37
2.2.2 Stacked M icro SC-SOFC Design... 38
2.3 SC-SOFC Fabrication... 39
2.4 Experimental Setup... 41
2.4.1 Testing Conditions and Apparatus ... 41
2.4.2 Current-Voltage Data Collection ... 41
2.4.3 AC Impedance Spectroscopy ... 42
2.4.4 Scanning Electron Microscopy (SEM) and Transmission Electron M icroscopy (TEM ) ... 44
2.4.5 X-ray Diffraction... 44
3 .0 R esu lts ... 4 5 3.1 Individual Micro SC-SOFC Operation at Various Temperatures ... 45
3.2 Micro SC-SOFC Electrode Changes at Various Temperatures and Gas Compositions... 47
3.3 Single M icro SC-SOFC Performance... 51
3.4 AC Impedance Spectroscopy: Further Micro SC-SOFC Characterization and Isolation of Electrode and Electrolyte Effects ... 54
4.0 Discussion...61
4.1 OCV verse Temperature: Electrode Catalytic Activity Reversal...61
4.2 Electrode Transform ation... 66
4.3 Carbon N anowire Form ation... 76
4.4 Characterization of Individual m icro SC-SOFCs... 84
4.4.1 Current-Voltage Data ... 84
4.4.2 AC Im pedance Data ... 86
4.5 Stacked SC-SOFC scaling... 91
5.0 Sum m ary... 93
References ... 97
Appendix ... 103
Figure 30: Reaction mechanisms for micro SC-SOFC w/ gold and platinum electrodes in a 1:1:5 methane:oxygen:nitrogen mixture at >700*C include water-gas shift reaction of CO, H2 is oxidized on the platinum electrode, while 02 is reduced on
th e A u electrode. ... 6 3 Figure 31: Platinum, palladium and iridium CO to CO2 formation rates as a function of
inverse temperature for single crystal supported catalysts (50)...64 Figure 32: Reaction mechanisms for micro SC-SOFC w/ Au and Pt electrodes in a 1:1:5
methane:oxygen:nitrogen mixture at <600'C include water-gas shift reaction for the methane, carbon monoxide blocks the platinum electrode which promotes oxygen reduction, while carbon monoxide is oxidized on the gold electrode...65 Figure 33: SEM images documenting the transformation of Pt-YSZ-Au micro
SC-SOFC after testing at 900C in a 1:1:5 ratio methane:oxygen:nitrogen gas mixture. Individual micro SC-SOFC(a), 5 400micron long micro SC-SOFCin series with single interconnect (b), different sized single and multi-interconnect series stack micro SC-SOFC(c), multi-interconnect series stack of micro SC-SOFC(d)...67 Figure 34: SEM and EDS results to investigate platinum electrode. SEM image of
porous platinum electrode indicating where EDS measurement is measured on the platinum surface(a), EDS results for measurement over platinum surface confirming the presence of platinum(b), SEM image of porous platinum electrode indicating where EDS measurement is taken within a platinum pore(c), EDS results for measurement within platinum pore, showing no evidence for platinum w ithin the pore(d)... 68 Figure 35: SEM and EDS results to investigate platinum diffusion into YSZ. SEM
image of YSZ where platinum electrode had been; box indicates area within which EDS is measured (a), EDS results for measurement YSZ surface, showing no evidence for platinum (b) ... 69 Figure 36: Micro SC-SOFC exposed to methane at 850*C for over one hour... 71 Figure 37: XRD results for samples with gold and platinum on YSZ and exposed to
pure methane, pure oxygen, pure nitrogen and a 1:1:5 ratio of methan:oxygen:nitrogen. XRD results only detect platinum, gold and YSZ...71 Figure 38: Optical images of Pt-Au patterned directly onto silicon with no electrolyte,
exposed to pure nitrogen at various temperatures. Individual micro SC-SOFCs at 400*C no visible changes observed (a), individual micro SC-SOFCs at 700*C initiation of platinum transformation (b), series stacks of micro SC-SOFCs at 700C more consistent changes occur to the platinum(c), individual micro SC-SOFCs at 800'C more platinum and all of the gold starts to transform(d), series stacks of micro SC-SOFCs at 800C all platinum and gold transform (e-f). ... 73 Figure 39: Optical images of Pt-Au patterned directly onto silicon with no electrolyte,
exposed to a 1:1:5 ratio of methane:oxygen:nitrogen at various temperatures. Individual micro SC-SOFCs at 400C no visible changes observed (a), individual micro SC-SOFCs at 700 C platinum appears to deform (b), series stacks of micro SC-SOFCs at 700'C all platinum in contact with gold does not deform(c), series
stacks of micro SC-SOFCs at 750'C platinum in contact and within a certain distance of gold does not transform(d), individual micro SC-SOFCs at 800'C more platinum and all of the gold starts to transform(e), series stacks of micro SC-SOFCs at 800'C all platinum and gold transform (f-g)... 74
Figure 40: XRD results for samples with gold and platinum deposited directly on silicon (no YSZ electrolyte) and exposed to pure nitrogen or a 1:1:5 ratio of methan:oxygen:nitrogen. XRD indicates the existence of polycrystalline Pt, Au, and the formation of a new substance PtSi... 75 Figure 41: SEM images of the carbon nanowire formation on the surface of the sample
with platinum being the catalysts. At a magnification of 250, it is apparent that platinum electrodes on all individual micro SC-SOFCs have been utilized to form the carbon nanowires (a) at higher magnification of 1000, there is no platinum remaining on the electrolyte, and gold is unaffected (b) at a magnification of 4000, it becomes clear that there is a tangled web of carbon nanowires(c)... 77 Figure 42: TEM image of a small platinum particle with a single carbon nanowire
growing from its surface. The solid layers of carbon prove the formation of a carbon nanowire verses a carbon nanotube. ... 79 Figure 43: TEM image of a large platinum nano particle with multiple carbon
nanow ires grow ing from its surface. ... 80 Figure 44: SEM and EDS results to investigate platinum and carbon nanowires. SEM
images of gold electrode, YSZ electrolyte and the transformed platinum electrode with carbon nanowires (a), EDS results taken from the platinum and carbon nanowire, showing carbon and platinum (gold is shown because the energy levels for gold and platinum are very similar and the software has trouble distinguishing between the two) (b), depicts the atomic ratio of elements present, indicating substantially m ore carbon than platinum(c)... 81 Figure 45: CHEMKIN thermodynamic equilibrium simulation over various
temperatures for a 2:1:5 ratio of methane:oxygen:nitrogen... 82 Figure 46: Power density versus current density for 5micron wide electrodes separated
by a gap distance of 15microns, experimented at 900*C in a 1:1:5 m ethane:oxygen:nitrogen environm ent. ... 84 Figure 47: Power density versus current density for 5micron wide electrodes separated
by a gap distance of 5microns, experimented at 900*C in a 1:1:5 m ethane:oxygen:nitrogen environment ... 84 Figure 48: Power density vs. fuel cell area. For each electrode gap distance, there is a
given power density that is within the same range for the different fuel cell sizes. .... 85 Figure 49: A side by side comparison of Figure 9 and Figure 12 showing IV data for
planar (a) and through-plane(b) SC-SOFCs(19)... 86 Figure 50: resistance ratios with respect to electrode gap separation... 87
Figure 51: Analytical model of a micro SC-SOFC with 5micron and 15micron wide gold and platinum electrodes. The parameters for this model are based on extracted ASR values for the platinum and gold electrodes at 700*C. ... 89 Figure 52: Experimental data for a micro SC-SOFC with 15micron wide gold and
platinum electrodes at 700'C in a 1:1:5 ratio of methane:oxygen:nitrogen. ... 89 Figure 53: OCV across different quantities of micro SC-SOFCs stacked in series... 91 Figure 54: average OCV across different quantities of micro SC-SOFCs stacked in
LIST OF TABLES
Table 1: Overall Chemical Reaction and Change in Gibbs Free Energy for Methane, Hydrogen and Carbon Monoxide in a stochiametric mixture with oxygen at 30*C. 23 Table 2: Anode and Cathode electrochemical half cell reactions and overall
electrochemical reaction for Methane, Hydrogen and Carbon Monoxide in a
stoichiom etric m ixture with oxygen... 27 Table 3: Individual micro SC-SOFC, with YSZ thickness of 200nanometers and
conductance of 0.0035Q-'cm' at 6000C (43), at varying electrode lengths and separation distances ... 32 Table 4: AC Impedance experimental nomenclature... 43 Table 5: micro SC-SOFC electrode transformation summary... 50 Table 6: Thermodynamic equilibrium of gas species in the chamber with initial starting
ratio of 1:1:5 methane:oxygen:nitrogen for 500'C and 8000C...62 Table 7: Mole fraction of the primary gas species at thermal equilibrium for a 2:1:5
mixture of methane and oxygen in nitrogen at 800'C...78 Table 8: Computed values for the change in resistance and the ASR...88 Table 9: Comparison of electrode and electrolyte resistances... 90
1.0 INTRODUCTION
1.1 Motivation
As our world becomes increasingly integrated with ever more powerful mobile electronics, providing enough energy to run these devices become increasingly difficult. The theoretical capacity limit for a lithium ion battery is about 400Wh/kg (1), and the current state-of-the-art batteries have the ability to reach the 150Wh/kg (1) threshold. Electronic devices will eventually require energy densities unreachable by lithium ion battery systems. Development of small fuel cells with liquid fuels could potentially provide 3-5 times more energy than batteries (2). This dramatic improvement in energy storage density is the primary motivation for fuel cell research for portable electronics products.
The motivation for solid oxide fuel cell (SOFC) research is in its potential for high power densities and efficiencies and the intent for stationary applications or integration into a power generation cycle. SOFCs are high temperature (800*C-1 100*C) solid state energy conversion devices. The electrolyte is composed of an oxide ceramic material and is used to transport oxygen anions from the cathode to the anode, thus completing an electrochemical reaction and providing electrical energy in the process. Despite being able to provide high power densities at high efficiencies, SOFCs have several significant disadvantages. At such high operating temperatures, the types of materials that can be used for structure and sealing are very limited and costly. In addition, the sealing process at such temperatures is very complex and at least 2 seals per cell are required in stacked SOFC systems. These material and process barriers prevent traditional SOFCs from being a commercially viable energy conversion technology. Traditional SOFCs are further discussed in Section 1.2.
The aforementioned shortcomings of traditional SOFCs provide great motivation for the research and development of single-chamber solid oxide fuel cells (SC-SOFC) which will be discussed in detail in Section 1.3. The objective for SC-SOFCs is to leverage the
benefits of traditional SOFCs with a simple innovative design concept, which possesses a dense stacking density, simplified architecture, ability to conform to countered surfaces, and lower operating temperatures (400-700*C (3, 4)). With these advantages, SC-SOFC technology can be implemented to run portable electronics for a longer period of time or be embedded into the exhaust stream of conventional power generation systems to recover and utilize un-reacted fuel.
1.2 Solid Oxide Fuel Cell Fundamentals
1.2.1 Solid Oxide Fuel Cell
A SOFC is an electrochemical conversion device which operates at high temperatures of 800-11000C (5). The high operating temperatures allow the usage of many different fuels such as hydrogen and various hydrocarbons, which react with oxygen to complete the electrochemical reaction. Even carbon monoxide can serve as a fuel at high temperatures, whereas at low temperatures, it would poison a PEMFC. SOFCs do not require noble metal catalysts when operating at these elevated temperatures. SOFCs are primarily composed of an oxide material. At the cathode, a reduction reaction occurs that transforms oxygen into an oxygen anion. This oxygen anion then transports through the solid oxide electrolyte to the anode, where it oxidizes the fuel, which gives off an electron and completes the electrochemical reaction (5).
1.2.2 Thermodynamics of Electrochemical Reaction
Obtaining energy from any system is accomplished from a change in energy states. Table 1 provides the overall chemical reactions that occur within the fuel cell as well as the change in Gibbs Free Energy from this reaction and the corresponding equilibrium
Table 1: Overall Chemical Reaction and Change in Gibbs Free Energy for Methane, Hydrogen and Carbon Monoxide in a stochiametric mixture with oxygen at 30'C.
Fuels
Methane Hydrogen Carbon Monoxide
Overall CH4 +202 -2H20+C02
H2+ 1O2 -> H20 C+102 -1 C02
Reaction 2 2
AG -818 kJ/mol -237 kJ/mol -257 kJ/mol
E 1.41 V 1.23 V 1.33 V
The electrical potential can be evaluated with the Nernst equation, Eq. 1 (6):
Erxn = E +-In RT H Eq. 1
zF [Hrea avJ
E 0 AG Eq.2
zF
where E0 is the standard equilibrium voltage, Eq. 2 (6), at standard pressure of latm and
is based off of the change in Gibbs Free Energy of the reaction shown in Table 1, R is the gas constant, T is the reaction temperature in Kelvin, z is the number of electrons being transferred, F is Faraday's constant, and within the brackets are the products of the reactants and products activities. For an ideal gas, the activity is equivalent to the partial pressure; therefore, the lower the partial pressure, the lower the open circuit voltage (OCV). The OCV for an SOFC operating at around 800'C is about 0.98 V, and decreases at higher temperatures and increases at lower temperatures. The decrease in OCV at elevated temperatures is compensated for by an increase in kinetics, making noble metals unnecessary for sufficient performance (5).
1.2.3 Traditional Two-Chamber SOFC Architecture and Performance
Traditional SOFCs have two chambers, one that isolates and exposes the fuel to the anode, and another that isolates and exposes oxygen to the cathode, as shown in Figure 1. Traditional SOFCs have several benefits and drawbacks from their design. Some of the benefits as previously mentioned are increased rate or reactions, no need for noble metals, and high obtainable power densities of -2-3 W/cm2 (7). However, these
results are difficult to achieve as the high operating temperatures demand very sturdy structure and seals. All of the materials need to match in thermal expansion to reduce thermally induced stresses and strains, which create cracks and limit the fuel cell's life. Additionally, if an SOFC electrode area were scaled up to 100cm2 or larger, the solid
oxide layers would be very thin and fragile and would be extremely susceptible to defects, cracking. Thus, it would be very difficult to create a mobile system, and SOFC technology would be limited to stationary applications (5).
02 02
Fuel
H201Co 2
Figure 1: A traditional two chamber fuel cell assembly comprised of two electrodes on either side of an electrolyte. For SOFCs the cathode distributes electrons to reduce oxygen to make an oxygen anion. The anion travels through the electrolyte to the anode where it oxidizes with the fuel and donates the electron, completing the electrochemical reaction.
For these reasons, there is a large push to reduce the operating temperature for SOFCs to 800*C or lower. An innovative sandwiching technique used for the electrolyte layer improves interfacial bonding and increases power density. This technique yields over 3.25W/cm2 at an operating temperature of 700*C (Figure 2), thus providing relatively high performance at lower temperatures (7).
1 .0~ 0.8 0.8 OA 0.2 0.0 0 100( 20W0 300 4000 XMt dnweny (nWarn 3500 290D 50
I
0.Figure 2: High performing SOFC with 5micron thick LSGM film electrolyte using a 400nm thick SDC buffer layer to interface electrolyte and electrode. Using H2 and 02
over anode and cathode respectively at a flow rate of 120mL/min. (7)
1.3 Single-Chamber Solid Oxide Fuel Cell
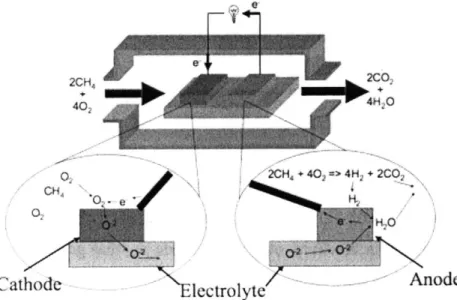
1.3.1 Single-Chamber SOFC ConceptOne way to further simplify SOFC architecture and thus avoid sealing issues and complex gas manifolds is to create an SC-SOFC. Figure 3 shows the SC-SOFC places the entire fuel cell into one chamber and simultaneously feeds fuel and oxygen. The idea behind the SC-SOFC is that the cathode and anode will have different catalytic selectivities, where the cathode is designed to primarily reduce oxygen and the anode designed to primarily oxidize the fuel (3, 4, 8-42).
Fuel+0 2 CO2 + H2
0
0000 * 0 ~0-0 0 * .e .0o00600rC 00 1*9 * 00 I A: 00 1WFigure 3: Single chamber solid oxide fuel cell (SC-SOFC).
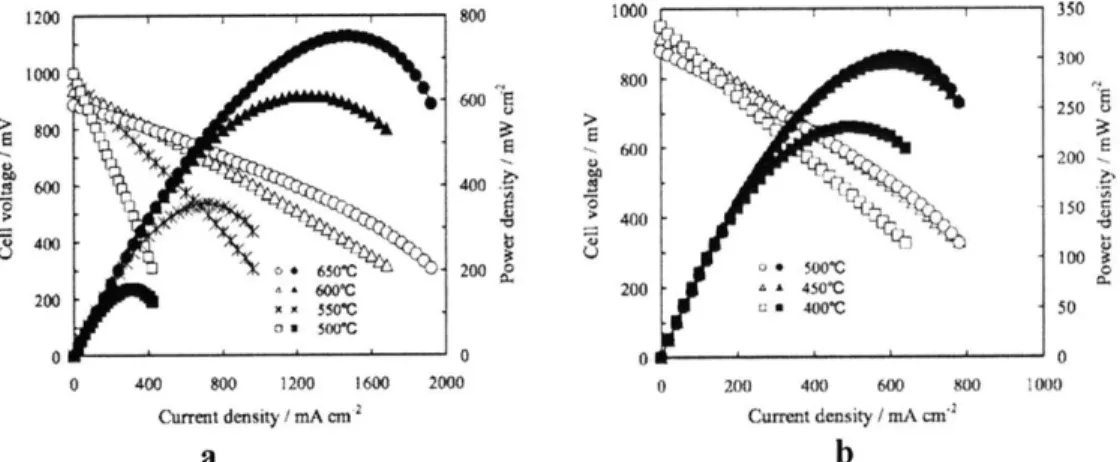
Placing the same fuel cell into a two chamber experimental setup and into a single-chamber experimental setup will help frame the effects from the different conditions. Using methane as the fuel source, Figure 4 shows the I-V curves for the operation of the fuel cells at various temperatures (41). In both fuel cell configurations, OCV decreases as temperature increases, as predicted by the Nernst equation, Eq. 1. Additionally, in the SC-SOFC, the oxygen and fuel gases are mixed; as the reaction proceeds, the product gases for both oxidation and reduction reactions act to decrease partial pressure of each species. Thus the extent of reaction in a SC-SOFC is less than that in a traditional SOFC, and therfore, the OCV of a SC-SOFC is lower than that of a two-chamber SOFC. In addition, the two-chamber SOFC does not show a plateau in performance with respect to temperature while the SC-SOFC seems to reach its maximum performance at around
5000C. 1200 800 1000 350 1000 80300 600 250 600 200 600 400 5 40010 0 0 0 0 400 800 1200 1600 2000 0 200 400 MC00 600 000
Current density / mA cm2 Current density / mA cmi
a b
Figure 4: Two chamber SOFC results (a) SC-SOFC results (b) (41).
This shows that for a SC-SOFC, there may be an optimal operating temperature that is lower than 800'C. Although the decreased operating temperature may eliminate sealing complications and allow better integration into mobile devices, the draw is in the
decreased actual power density. This SC-SOFC has been shown to produce a max power of just over 300mW/cm2, while the two-chamber SOFC easily surpasses 1 W/cm2 (41).
However, comparing the two fuel cell set ups at the low operating temperature of 500'C, the SC-SOFC has about 20% higher power output than the two-chamber SOFC (41). This suggests that if SOFCs are to operate at low temperatures, the more efficient way to do so would be by using a SC-SOFC.
1.3.2 Design of Electrode Activity and Selectivity for SC-SOFCs.
With SC-SOFCs, the fuel and oxidant are simultaneously introduced into the chamber. This results in a decrease in activities of the reacting chemical species, which according to the Nernst equation, Eq. 1, would decrease fuel cell performance. However, this effect can be influenced by the catalytic selectivity of the electrodes. In an ideal SC-SOFC, the electrodes have complete selectivity, where each electrode participates only in its designated reaction. Figure 5 shows that the SC-SOFC cathode selectively reduces oxygen and does not react with the methane, while the anode facilitates the oxidation of the fuel, as well as potential gas shift reactions, but does not react with oxygen (23). Table 2 details the ideal half reactions at each electrode.
jMi6
4#20 0, CH t Cathode 2 CH +402= 4H2 +2C,6--, . ...Anode .,'~>~
-ElectrolyteFigure 5: An example of proposed electrochemical reactions for a SC-SOFC exposed to methane and oxygen.
Table 2: Anode and Cathode electrochemical half cell reactions and overall electrochemical reaction for Methane, Hydrogen and Carbon Monoxide in a stoichiometric mixture with oxygen.
Fuels
Carbon Monoxide Hydrogen
Methane
Anode Half CH4 +402 -> 2H20+ 2H2 + 202- -+ 2H20+ 4e- 2CO + 202- - 2CO2 +
4e-Cell Reaction CO2+8e-_
Cathode Half 202+ 8e- --> 402- 02+ 4e - 202 02+ 4e - 202-Cell Reaction
Overall CH4+20 2 -> 2H20+ 2H 2 +02- 2H20 2CO+0 2 2CO2
Reaction CO2 I
PF
2CH4
Incomplete electrode selectivity negatively impacts the OCV. The two main speculations for poor electrode selectivity are related to a geometrical effect and a material effect. Geometry is believed to influence the OCV when the electrodes are oriented such that the products of each electrode dilutes and reduces the reaction potential of the other electrode(8, 28, 42). Ahns, et.al. showed that an OCV ~0.35 V in a SC-SOFC can be obtained using interdigitated electrodes that have a gap spacing of 50microns (8). This effect is further supported by Jacques-Bedard, et.al., who shows that decreasing the separation distances between cathode and anode from 300microns to 40microns reduces the OCV from 0.98 V to an unstable OCV ranging from 0.4-0.7V (28). Both studies use the same anode (nickel-oxide), cathode (LSM) and electrolyte (YSZ). This work supports the idea that the SC-SOFC's geometry can influence the OCV and that mixing electrode products negatively influences the reactivity of the electrodes. Choice of electrode material can impact OCV in one of two ways: the electrodes may be extremely reactive with both the fuel and the oxidant, or not very reactive with either (17, 23). Hibino, et.al. shows that when using the same electrolyte, Pt/YSZ/Au obtains an OCV of less than 0.6 V while Ni/YSZ/LSM obtains an OCV of 0.8 V. This reduction in OCV can be caused by the material's insufficient ability to react with the gas species; Hibino et.al. showed that the conversion of methane using platinum was only ~4%, while that using nickel was more than 50% (17). The OCV is also affected if the electrodes are over reactive. A difference in reactivity at each electrode is what generates a potential, to achieve a high OCV, the cathode needs to have a higher rate of oxygen reduction than the anode, and anode needs to have a higher rate of fuel oxidation than the cathode; therefore, rapid reactions at both electrodes are non-conducive to generating a high potential.
1.4 Single-Chamber Solid Oxide Fuel Cell Architectures
1.4.1 Planar Design
In planar SC-SOFC architecture, Figure 6, the anode and cathode are aligned on the same face of the electrolyte (20, 21). The advantage of a planar SC-SOFC is that it is the simplest architecture to manufacture since the electrodes can be visually aligned to each other.
Figure 6: Planar SC-SOFC Architecture.
1.4.2 Through-Plane Design
In a through-plane SC-SOFC architecture, Figure 7, higher performances can be achieved than in a planar configuration by minimizing the electrolyte thickness, which reduces the electrolyte resistance (19). However, this is more challenging to fabricate due to the difficulties in aligning the anode and cathode when they are not necessarily visible. To obtain a thin electrolyte, this design would require support by a thick anode or cathode.
1.4.3 Comparing Planar vs. Through-Plane
Assuming the same cell size, materials, and process steps, the through-plane architecture provides a larger power density than a planar configuration. There are two contributing factors for this, the more trivial factor is how power density is calculated. Power density is based off of a two-dimensional area, which is the active area of the fuel cell. As shown in Figure 8, the planar configuration has its electrodes side by side, and its active area is effectively double the electrode area plus the spacing area between the two electrodes. In contrast, in the through-plane SC-SOFC configuration, the electrodes are on top of each other, consuming less two-dimensional space.
Planar Configuration
Top View
Through-Plane Configuration
Top View
Active Area Comparison
I I~ I I I I I I I I I I' I I I I Planar Area> I I ] I I I I I 1 I I I I ___ I 2x(Opposite Area)
Cross Section View Cross Section View
I
Anode Electrolyte
E
Cathode Active AreaFigure 8: The difference between active area of Planar and Through-Plane configurations. The right most image compares the relative size of each active area and shows that the area of the Planar configuration is more than two times that of the Through-Plane configuration.
1.5 Relating Electrode and Cell Configurations to SC-SOFC performance
Changing the geometric characteristics for the SC-SOFC, such as the distance between electrodes and the thickness of electrolyte, results in different effects discussed in the following sections. The two main parameters of the planar configuration, Figure 6, are the distance between the electrodes and the electrolyte thickness.
1.5.1 Electrolyte Resistance
Eq. 3 can be used to calculate the electrolyte resistance, R:
= R
AR
Eq. 3The symbols 1 and A are both geometric properties, where / is the distance oxygen anions have to travel, and A is the cross-sectional area available for anion transport. The conductance, o, for various high temperature electrolytes such as YSZ changes as a function of temperature, a plot of which is provided in Appendix A (43). For example, an individual micro SC-SOFC that is 400microns long, with YSZ thickness of 200nanometers and conductance of 0.0035Q-'cm-1 at 600'C (43), and whose electrodes are separated by 5microns, yields a resistance of 1.79x10 5 Q. Table 3 provides the resistance values for different electrode and separation distances. Two main trends are apparent: the larger the electrode area, the lower the resistance, and the smaller the gap, the smaller the resistance. Therefore in a planar SC-SOFC configuration, it is expected that the best performing fuel cell would consist of a long electrolyte layer with the electrodes placed as closely as possible without touching.
Table 3: Individual micro SC-SOFC, with YSZ thickness of 200nanometers and conductance of 0.0035Q- cm' at 6000C (43), at varying electrode lengths and separation distances
Electrode-Electrode Separation Distance Length 9 at 5micron Q at 10micron 9 at 15micron 400microns 1.79 e5 Q 3.58 e5 Q 5.37 e5 Q 100microns 7.15 e5 Q 1.42 e6 Q 2.15 e6 Q
25 microns 2.86 e6 Q 5.72 e6 Q 8.58 e6 Q
1.5.2 Previous Findings
As shown in Figure 9, increase in gap distance between the electrolytes decreases performance (19). This result is in accordance with Eq. 3, since increased gap distance, 1, results in increased resistance, R, and thus decreased voltage. Figure 9 clearly shows that the changes in current and power are linearly affected by the change in the distance between electrodes. This effect is also demonstrated with an analytical model shown in Figure 10a (13). I (W 400 200 -Wider k) 0 200 410 600 140 80 60 40 20 0 00
Current density / mA cmi~
Figure 9: The effect of changing the distance between electrodes in a planar SC-SOFC configuration as shown in Figure 6. Note that the wider the gap the worse the performance (19).
-0.5nim pp
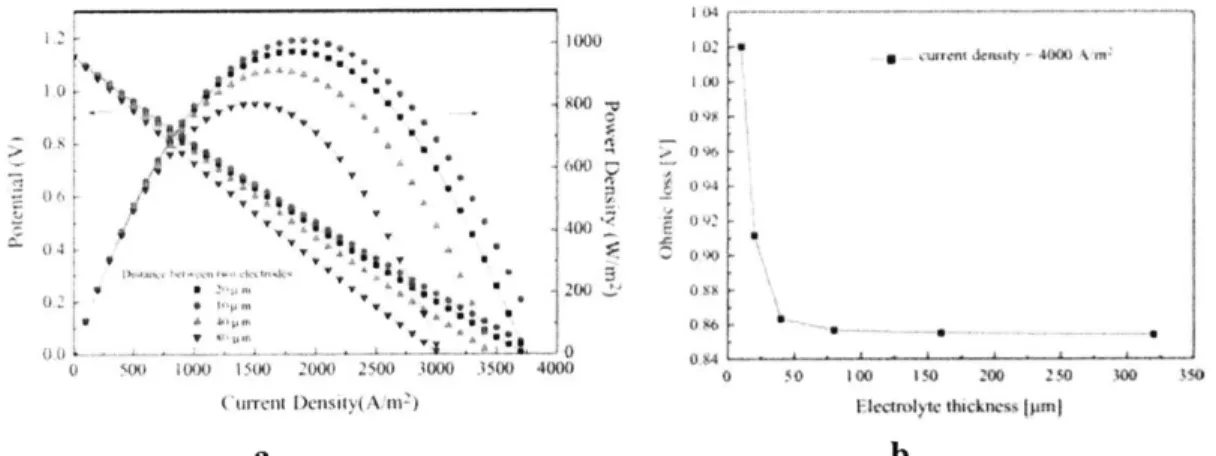
- 3nim
An analytical model was created to determine if there was an optimum electrolyte thickness (13). A micro planar SC-SOFC system with electrodes of width of 20micron and a gap distance of 20micron has an optimum electrolyte thickness of about 80microns, as shown in Figure 10b (13). For this analytical model, it is assumed that Ni-GDC is used as the anode, and SSC-SDC is used for the cathode, each with 100nm diameter pore size. Additionally, hydrogen and oxygen are the fuel and oxidant, and the system operates under the temperature 500'C. However, this model should only be considered as a foundation for the idea that a thicker electrolyte for planar SC-SOFCs can provide improved performance, because as will be discussed later, micro SC-SOFCs have difficulty experimentally obtaining a conventional OCV as shown in this model. Micro SC-SOFCs have experimentally demonstrated an OCV closer to 350-400mV (44), while many larger SC-SOFCs have an OCV of 0.95V or lower (3, 4, 9, 16-23, 26, 45). Experimental results to be discussed later show the OCV to be much lower than that predicted by the Nernst Equation as shown in this model.
&b
*100
U 9S
( l ) '~tJ 0 40)X KX ) 1 S3A) 4000 1 V0 zoo .1 $'0 0 W0 t l10
a b
Figure 10: Analytical model predicting the effect of distance between two electrodes (a) and electrolyte thickness (b) on planar SC-SOFC performance (13).
Electrolyte thickness can play a role in planar SC-SOFC performance because as thickness decreases, the oxygen anion flow can be hindered, preventing its ability to flow freely and quickly from the cathode to the anode. This idea is visually expressed in Figure 11, where the electrodes have the ability to handle a fixed exchange current. When the electrolyte, the carrier for the exchange current, is too thin, it reduces the amount of current that can travel from one electrode to the other. Increasing the
thickness of the electrolyte will increase the current flow; however, further increase in thickness will have diminishing improvements to fuel cell performance. The trend explained above and conveyed in Figure 10b can also be extracted from Eq. 3. In this case, the electrode length and electrolyte conductivity are fixed, but the cross-sectional area is changed. With these constraints, the electrolyte resistance is now inversely proportional to area: increasing area decreases resistance and vice versa. Additionally, when the cross-sectional area of the electrolyte gets too large, its ability to improve the fuel cell performance is negligible. Alternatively, when the cross-sectional area becomes too small, it quickly increases the resistance towards the limit of infinity.
Too thin of an electrolyte
Anode Optimal electrolyte thickness
Cathode
Electrolyte Very thick electrolyte
Exchange Current Pathway
Figure 11: Planar SC-SOFC varying electrolyte thickness. If the electrolyte is too thin the fuel cells performance could be reduced. If it is too large, fuel cell performance is not significantly affected. (figure is representative, not actual experimental or analytical values)
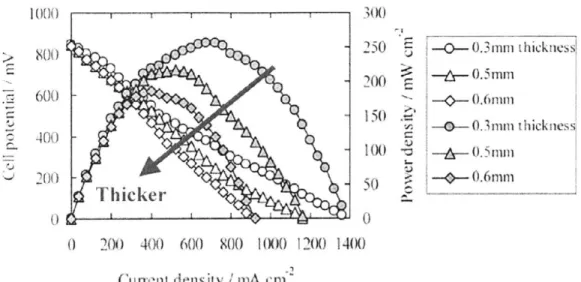
In Through-Plane SC-SOFC configuration shown in Figure 7, the gap between the electrodes is controlled by the thickness of the electrolyte; therefore electrolyte thickness is the major geometric factor that contributes to the fuel cell performance. In this case, the thinner the electrolyte, the higher the performance (19). Figure 12 provides experimental data demonstrating the relationship between electrolyte thickness and fuel cell performance of through-plane configured SC-SOFCs. In this configuration, the resistance is directly proportional to the electrolyte thickness, which is the length anions have to travel, Eq. 3. This trend is reflected in Figure 12. Despite slight deviations, which can be associated with experimental error, the resistance is strictly linear with respect to the thickness (13, 19).
> wo 250-0_ mmn Lhicktiess! 000 600 T0 -0.6mmn'nitii thickhicker 40 0 200 400 600 SWf I( )200 1400 Cunetii density / mA m
-Figure 12: The effect of electrolyte thickness on performance in a through-plane SC-SOFC configuration shown in Figure 7. Note increasing thickness decreases performance (19).
1.6 Single-Chamber Solid Oxide Fuel Cell Stacking
Thermodynamically, a single fuel cell can obtain a maximum voltage of ~0.98 volts at 800'C regardless of its size (see Section 1.2.2 for OCV thermodynamic dependencies). Note that Eq. 1 contains no area or volume term to scale the voltage. Changing the physical size of the fuel cell contributes to the amount of current that can flow through the system, but to increase the system's voltage, individual cells need to be connected in series, which will contribute linearly to an increase in voltage (21, 26, 37). Figure 13 is a schematic depicting the SC-SOFC stacking connecting the anode of one cell to the cathode of another, resulting in additive voltages.
2.0 Experimental
2.1 Material Selection and Material Synthesis for micro-SC-SOFCs
The primary materials utilized for the micro SC-SOFC are platinum and gold to serve as the anode and cathode respectively, and YSZ as the electrolyte. YSZ is selected for its well-known electrochemical properties, and while platinum and gold are not conventional high temperature fuel cell catalyst materials, they do possess different catalytic reaction properties which are desirable for high electrode selectivity. Platinum has a higher affinity for oxidizing the fuel, while the gold has the ability to reduce oxygen. In addition, since the electrodes are pure noble metals, they simplify the potential reaction mechanisms, and are physically easier to handle and process. To further improve micro SC-SOFCs performance, future studies will investigate more complex materials such as solarium doped ceria (SDC) as the electrolyte, nickel combined with SDC as the anode, and barium strontium cobalt iron (BSFC) as the cathode (4).
2.2 SC-SOFC Design
2.2.1 Individual SC-SOFC design
The experimental platform for studying individual micro SC-SOFCs is shown in Figure 14. These individual cells are created to test a wide range of parameters in an attempt to isolate the fundamental electrochemical processes. The control cell, which every test fuel cell in this study is compared to, consists of two equal sized electrodes (5 by 100 microns) with a separation distance of 5microns. Each pair of electrodes is placed upon its own individual electrolyte layer that borders the pair of electrodes by 5microns. Sets of experiments were performed on the control fuel cell where only one of the following parameters were changed each time: anode width, cathode width, gap separating the electrodes, lengths of both electrodes (varied simultaneously), and widths of both electrodes (varied simultaneously).
For every variable that is changed, a change in performance is expected to occur. By changing the gap separating the electrodes, the relationship between gap distance and electrolyte performance can be studied, which can help determine the sensitivity of performance due to electrode alignment and positioning. Individually changing the width of the anode or cathode can provide insight into several design conditions for micro SC-SOFCs, such as what electrode impacts the rate limiting reaction, and if increasing the size of the rate limited electrode could improve fuel cell performance. Changing the electrodes length and width can help determine if the reactions are dependent on the electrodes area or triple phase boundary (electrode perimeter, i.e. the boundary between the electrode, electrolyte, and chemical species).
Anode Length
4 Anode Width
hoarder
Cathode Width
K-Cathode
Length bFigure 14: Schematic for individual micro SC-SOFC test cells.
2.2.2 Stacked Micro SC-SOFC Design
The stacked micro SC-SOFC design shown in Figure 15 uses the individual control micro SC-SOFC discussed in Section 2.2.1 as the base fuel cell. Experiments were done with the stacks varying three variables: number of cells in a stack, the length of each cell in the stack, and the number of interconnections between fuel cells (either one interconnect between fuel cells, or one interconnect every 25 microns).
Experiments with changing the number of fuel cells in a stack are used to validate the ability of micro SC-SOFCs stack in series to increase its voltage linearly. To understand how a micro SC-SOFCs stacks total current and current density change with size, several different stacks are fabricated with fuel cells of different lengths. Experiments with changing the amount of interconnects used for stacking micro-SC-SOFCs are used to
determine if a single interconnect is sufficient (i.e., does not limit current), or if several interconnects are needed to fully utilize a series stack of fuel cells.
0 0 0 * ~c colic S Stack Length
Slogi Interconnect mkro SC-SOFC Stok Dwft
a
Figure 15: Schematic for planar single (a) stack.
. _ _ Stack Longth tultiple lcttecolntt micro SC-sOtC
b
or multiple (b) interconnect micro SC-SOFC
2.3 SC-SOFC Fabrication
In these micro SC-SOFCs, 8mol% yttria-stabilized zirconia (YSZ) (Praxair Specialty Ceramics, USA) was used for the electrolyte; platinum (Pt) and gold (Au) were used for the electrodes. Figure 16 depicts the fabrication steps used to produce micro-sized SC-SOFCs: (1) a 4 inch silicon wafer is used as the SC-SOFC support; (2) spin-coating of negative photoresist (Clariant, Switzerland) is applied; (3) wafer is covered by photo-mask with electrolyte features, then exposed; (4) YSZ is deposited by sputtering for 2 hours at 100W power and 60:8 ratio of Ar:0 2; (5) excess YSZ is lifted off by removing the resist with a photoresist stripper, leaving the desired electrolyte features; (6) sample is re-coated with negative photoresist; (7) wafer is covered by the photo-mask with the first electrode features, then exposed; (8) Au is deposited by sputtering for 25 minutes at 100W power and pure Ar environment; (9) excess Au is lifted off by removing the resist
with a photoresist stripper, leaving the desired Au electrode features; (10) sample is re-coated with negative photoresist; (11) wafer is covered by the photo-mask with the second electrode features, then exposed; (12) Pt is deposited by sputtering for 25 minutes at 100W power and pure Ar environment; (13) excess Pt is lifted off by removing the resist with a photoresist stripper, leaving the desired Pt electrode features, and completing the micro SC-SOFC. The YSZ, Au, and Pt thicknesses were all found to be approximately 200nanometers using AFM measurements.
Si Wafer
-0
NCoat w/ 2resist ~O UV expose & Develop P0 Deposit Electrolyte Lift off Coat w/ resist UVexpose &Develop Deposit 1st Electrode Lift off Coat w/ resist UV exposeD
& Develop Deposit 2nd Electrode - Lift off 1st Electrode 2nd ElectrodeFigure 16: Steps for micro SC-SOFC fabrication.
2.4 Experimental Setup
2.4.1 Testing Conditions and Apparatus
Samples were placed inside a microprobe station (Karl Suss, Germany) equipped with an optical microscope (Mitutoyo, Japan) and a temperature controlled stage (Linkam TS1500, UK), with a custom-sealed gas chamber enclosure. A Princeton Applied Research Potentiostat 263A was used to measure OCV and collect current verse voltage data. OCV measurements were taken between 400 and 900*C in increments of 100*C and the data were averaged over a 120-second span. A mixture of methane, oxygen, and nitrogen, in a volume ratio of 1:1:5 or 2:1:5 and at a flow rate of 140 mL/min or 160mL/min respectively, was supplied to the chamber.
2.4.2 Current-Voltage Data Collection
A standard method for monitoring the operation of a fuel cell is to create current-voltage (IV) plots, as shown in Figure 17. A preferred energy conversion device would be able to provide a constant voltage for any current drawn from the cell. However activation losses, ohmic resistances and mass transport limitations all contribute to an overall reduction in performance. This voltage loss relationship is shown in Eq. 4.
1.2 l
1.0 -- - - - -f --. -Vvotg
Graph is fairly linear 0.8
-0.6 V small initial tall in voltage, and open circuit
= voltage is very close to theoretical value 0.4
-Voltage begins to fall faster at higher currents
0 0 200 400 600 800 1000
Current density (mA cm-2)
Figure 17: Typical IV graph for SOFC operating at 800*C(5).
SOFCs have very little activation losses due to the high operating temperatures. In well-fueled systems that do not demand high current densities, mass transport losses can also be neglected. Therefore voltage will be proportionally dependent upon the combined resistances of the anode, cathode, and electrolyte. To help determine which resistance has the largest contribution, AC impedance spectroscopy can be performed to determine the extract electrolyte and electrode resistances. Once these resistances are determined, they can be used in Eq. 4 to provide insight to the fuel cell performance.
2.4.3 AC Impedance Spectroscopy
AC Impedance Spectroscopy is a common analytical tool for evaluating solid state devices(46). By modeling the fuel cell as a simple network of resistors and capacitors, it becomes a customary electrical circuit. An alternating voltage at a certain frequency is applied to the system, the current output is measured, and an impedance is calculated. As the voltage frequency is changed, a spectrum of impedances can be created which can be correlated to the device's operation. Figure 18a shows a simplified circuit diagram for a fuel cell and Figure 18b shows an ideal ac impedance plot(46).
From the AC impedance plot, Figure 18b, R, represents the resistance of the fuel cell's electrolyte layer. Resistor and capacitor, R2 and C2, correlate to the electrode's resistance,
which, when plotted with ac impedance, creates a semi-circle graph where the diameter of the semi-circle is the resistance associated with the electrodes. All R" (electrolyte resistance) and R2 (electrodes/fuel cell resistance) are extracted from the collected data in
order to compare test results.
AC impedance spectroscopy measurements were conducted on a Solartran 1260 frequency response analyzer connected to a Solartron 1296 dielectric interface in the frequency range of -OMHz to -100 Hz using an ac voltage amplitude of 30-5OmV with zero dc bias. The integration time varied between 10-30seconds depending on the clarity of the data obtained. Each data experiment was run 2-3 times and averaged together to account for measuring variability.
a Electrolyte Resistance -Im(Z) lectrodes/Fuel Cell Resistance (RIO-R 2) Re(Z) b
Figure 18: Simplified fuel cell circuit diagram where R. and C. represent the effects imposed by the electrolyte and R2 and C2 represent the electrode effects (a). Ideal ac
impedance plot for the circuit above (b) (46).
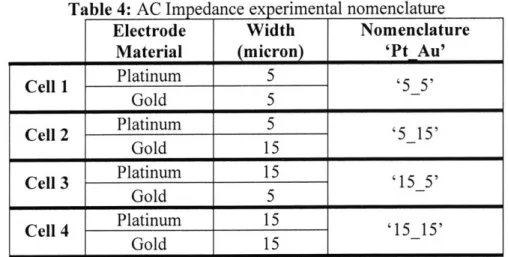
The main experiments conducted evaluate the resistance characteristic for different electrode configurations. The four main electrode configurations evaluated are all the combinations of gold and platinum electrodes with widths of 5micron and 15micron. Table 4 lays out the main types of cells tested and the nomenclature for the collected data.
Table 4: AC Impedance experimental nomenclature Electrode Material Width (micron) Nomenclature 'Pt Au' Cell 1 Platinum 5 '5 5' Gold 5 Cell 2 Platinum 5 '5_15' Gold 15 Cell 3 Platinum 15 '15_5' Gold 5 -Cell 4 Platinum 15 '15 15' Gold 15
2.4.4 Scanning Electron Microscopy (SEM) and Transmission Electron Microscopy
(TEM)
Images of the tested samples were obtained by scanning electron microscopy (SEM) on a Jeol 6320 operating at an accelerating voltage of 15kV for imaging and x-ray energy dispersive spectroscopy (EDS). Images revealing the molecular structure for certain samples were achieved by transmission electron microscopy (TEM) on a Jeol 201 Of operating at an accelerating voltage of 200kV.
2.4.5 X-ray Diffraction
Thin film X-ray diffraction was performed to help confirm the initial molecular composition of the samples before and after experimentation to determine if any changes occurred in the materials structure or composition after testing. Thin film X-ray diffraction patterns were collected by Bruker D8 DISCOVER equipped with a two-dimensional general area-detector diffraction system (GADDS). The K alpha radiation of
1.5418 angstroms was generated in a Cu tube at 40 kV and 40 mA. The X-ray beam was
focused using a collimator with a 0.5 mm beam diameter. The angle between a thin film sample and the incident X-ray beam (omega angle) was set to 10 degrees.