HAL Id: hal-01985277
https://hal-mines-albi.archives-ouvertes.fr/hal-01985277
Submitted on 17 Jan 2019HAL is a multi-disciplinary open access archive for the deposit and dissemination of sci-entific research documents, whether they are pub-lished or not. The documents may come from teaching and research institutions in France or abroad, or from public or private research centers.
L’archive ouverte pluridisciplinaire HAL, est destinée au dépôt et à la diffusion de documents scientifiques de niveau recherche, publiés ou non, émanant des établissements d’enseignement et de recherche français ou étrangers, des laboratoires publics ou privés.
10% Loss of Incident Power through Solar Reactor
Window: Myth or Good Rule of Thumb?
Victor Pozzobon
To cite this version:
Victor Pozzobon. 10% Loss of Incident Power through Solar Reactor Window: Myth or Good Rule of Thumb?. Applied Solar Energy, Springer Verlag, 2018, 54 (2), pp.131-133. �10.3103/S0003701X18020093�. �hal-01985277�
10% Loss of Incident Power through Solar Reactor Window:
Myth or Good Rule of Thumb?
V. Pozzobon
Université de Toulouse, France e-mail: victor.pozzobon@mines-albi.fr
Abstract—It is known that a solar beam crossing a window losses 10% of its incident power. Yet, this affirma-tion is not supported by many published scientific evidences. In this work, a heat f lux mapping method was used to determine the heat f lux distributions at the focal spot of a solar concentrating device without and with a window on the incident beams' trajectory. The presence of a window on the beams' trajectory induces a 12% loss of the total power and a 11% decrease of the peak heat f lux density.
INTRODUCTION
Concentrated solar power can be used to supply heat at high temperature. It features several advantages compared to conventional fossil fuel burning methods. Among them is the fact that concentrated solar power supplies clean heat, i.e., without combustion fumes. Indeed, those fumes may alter or even destroy the heated material, e.g. decomposition of limestone [1]. In addition, whenever the reacting atmosphere needs to be controlled, it is common to add a windowed aperture to the reactor design [2–4]. This window ensures the airtightness of the reactor while allowing the solar heat f lux to enter it.
Nevertheless, adding a window comes with one main drawback: it lowers the amount of energy enter-ing the reactor. Indeed, the incident f lux crosses the window and therefore loses part of its power because of in medium absorption and dioptres ref lections. It is, most of the time, quoted as common knowledge in the field of solar reactor design that crossing a window induces a 10% loss of the incident power. Yet, only one research paper was found to support this claim, in the very particular case of a dome [5], and not of a f lat window. Furthermore, this claim is not complete for it only regards the total power: it does not precise whether or not the heat f lux distribution is modified.
In order to assess for the validity of this claim, the heat f lux distributions at the focal spot of a solar con-centrating system were mapped with and without a quartz window on the beams' trajectory. Then, the total incident power and the shape of the heat f lux dis-tribution were compared.
MATERIALS AND METHODS
Figure 1 shows a schematic of the solar concentrat-ing device, i.e. an artificial sun, and the heat f lux mea-surement material. To map the incident heat f lux, a screen is set in front of the artificial sun at the focal spot. Thus, the beams coming out of it are intercepted by the screen. As beams’ energy is absorbed by the screen, its temperature rises. The temperature varia-tions are recorded by IR camera. Then by inverse methods using the temperature elevation is used to compute the incident heat f lux distribution over the screen. A 2D model is used to link temperature (T) rise with incident heat f lux (Φ). It accounts for the contri-bution of the incident radiative heat f lux as well as convective and radiative heat losses:
(1)
where ρ, cp, λ, α, ε, e screen density, heat capacity, conductivity, absorptivity, emissivity and thickness respectively, Tsur and h, surrounding temperature and
convective heat f lux coefficient.
The model is solved for each pixel of the recorded images using ordinary least square method. Once completed, this procedure yields a map of the incident heat f lux. The solar concentrating system and the heat f lux mapping method used in this work have been extensively described in [6].
A 3 mm thick f lat quartz sheet was used to simulate a reactor window. The window was set 5 cm above the screen, parallel to it and perpendicular to the system revolution axis. The repeatability of the measured heat f lux distributions was assessed by repeating the
mea-(
)
(
)
∂ ρ αΦ ∂ − − − ∈ σ 4 − 4 sur sur λ Δ 2 2 , p T c e = e T + t h T T T Tsurement twice in both configurations. The repeat-ability is very good. The absorption of the window was computed with respect to the lamp radiation
spec-trum. The quartz window was found to absorb 7.5% of the incident power.
RESULTS
Figure 2 reports the determined heat f lux distribu-tions at the focal spot without and with the additional quartz window. The spatial distributions are similar; furthermore they both exhibit revolution symmetry. Figure 3 reports cut views of the heat f lux distribution along x and y axes at the focal spot. In both configura-tions, the distributions along the two axes are very close. They exhibit a Gaussian shape, which is con-gruent with literature [7–10].
The peak heat f lux was measured to be 1201 kW/m2
without the window and 1072 kW/m2 with the
win-dow. The window therefore induces an 11% decrease of the peak heat f lux with respect to the unshaded con-figuration. Furthermore, adding a window leads the total incident power to decrease from 936 W, without the quartz sheet, to 820 W. It represents a 12% loss of the incident power. Owing regards to the window Fig. 1. Experimental apparatus schematics [6]. (1) 4 kW
xenon arc lamp, (2) elliptical mirror, (3) a ray, (4) remov-able quartz window, (5) screen, (6) camera.
(1) (2) (3) (4) (5) (6)
Fig. 2. Heat f lux map at the focal spot without additional window (on the left) and with additional window (on the right).
–0.02 –0.02 –0.01 –0.01 0 0 0.01 0.01 0.02 0.02 y , m x, m
Incident heat flux, kW/m2
100 100 10 0 10 0 250 250 250 250 500 500 500 500 750 750 1000 1000 –0.02 –0.02 –0.01 –0.01 0 0 0.01 0.01 0.02 0.02 y , m x, m
Incident heat flux, kW/m2
100 100 10 0 10 0 250 250 250 250 500 500 500 500 750 750 1000 1000
Fig. 3. Heat f lux distributions at the focal spot without additional window (on the left) and with additional window (on the right).
Continuous line: along x axis, dashed line: along y axis.
1250 1000 750 500 250 0 –4 –2 0 2 4 In c id e nt h e at flux, k W/m 2 Axis length, cm 1250 1000 750 500 250 0 –4 –2 0 2 4 In c id e nt h e at flux, k W/m 2 Axis length, cm
absorption, it can be concluded that ref lections induce a 4.5% loss of the incident power.
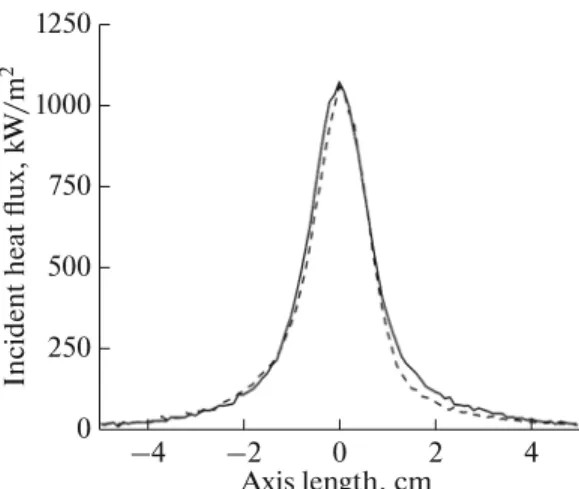
In order to assess for the similarity in the shape of the two heat f lux distributions, the heat f lux distribu-tion along x axis without the windows was multiplied by 0.88 and compared to the one measured along x axis with the window. Figure 4 shows both experimen-tally observed and computed heat f lux distributions. The two distributions are very close. It can therefore be concluded that crossing a window does not modify the shape of the heat f lux distribution.
CONCLUSIONS
This brief note presents heat f lux mappings, with-out and with an intermediate window, at the focal spot
of a solar concentrating system. From the experimen-tal measurements, it can be concluded that crossing a window induces a 12% loss of the incident power and a 11% reduction of the peak heat f lux density. Further-more, the heat f lux distribution shape after crossing the window is almost identical to the one before. The two heat f lux distribution shape can be linked by a simple multiplication by a 0.88 factor. As a conclusion, it can be stated that: as a good rule of thumb, one can consider that crossing a window reduces by 12% the total power and the peak density while conserving the shape of the heat f lux distribution.
REFERENCES
1. Imhof, A., Renewable Energy, 1997, vol. 10, nos. 2–3,
pp. 239–246.
2. Z’Graggen, A. and Steinfeld, A., Int. J. Hydrogen Energy, 2008, vol. 33, pp. 5484–5492.
3. Salikhov, T.P., Kan, V.V., and Kan, S.N., Appl. Sol. Energy, 2007, vol. 43, no. 1, pp 54–55.
4. Faiziev, Sh. A., Paizullakhanov, M. S., and Nurma-tov, Sh.R., Features of zirconium carbonitride synthe-sis in a large solar furnace, Appl. Sol. Energy, 2010,
vol. 46, no. 1, pp. 53–55.
5. Guesdon, C., Alxneit, I., Tschudi, H.R., et al., Sol. Energy, 2006, vol. 80, pp. 1344–1348.
6. Pozzobon, V. and Salvador, S., Sol. Energy, 2015,
vol. 117, pp. 29–35.
7. Sarwar, J., Georgakis, G., LaChance, R., and Ozalp, N.,
Sol. Energy, 2014, vol. 100, pp. 179–194.
8. Petrasch, J., Coray, P., Meier, A., et al., J. Sol. Energy Eng. – Trans. ASME, 2007, vol. 129, pp. 405–411.
9. Llorente, J., Ballestrin, J., and Vazquez, A.J., Sol. Energy, 2011, vol. 85, pp. 1000–1006.
10. Abdurakhmanov, A.A., Klychev, Sh.I., Nurmatov, Sh.R., Faiziev, Sh.A., and Paizullakhanov, M.S., Appl. Sol. Energy, 2009, vol. 45, no. 4, pp. 279–280.
Fig. 4. Heat f lux distributions at the focal spot.
Continu-ous line: with additional window, dashed line: without additional window multiplied by 0.88.
1250 1000 750 500 250 0 –4 –2 0 2 4 In c id e nt h e at flux, k W/m 2 Axis length, cm
![Fig. 1. Experimental apparatus schematics [6]. (1) 4 kW xenon arc lamp, (2) elliptical mirror, (3) a ray, (4) remov-able quartz window, (5) screen, (6) camera.](https://thumb-eu.123doks.com/thumbv2/123doknet/7756720.254318/3.918.156.757.810.1046/experimental-apparatus-schematics-elliptical-mirror-quartz-window-screen.webp)