Publisher’s version / Version de l'éditeur:
Analytical Chemistry, 89, 17, pp. 8988-8994, 2017-07-21
READ THESE TERMS AND CONDITIONS CAREFULLY BEFORE USING THIS WEBSITE.
https://nrc-publications.canada.ca/eng/copyright
Vous avez des questions? Nous pouvons vous aider. Pour communiquer directement avec un auteur, consultez la
première page de la revue dans laquelle son article a été publié afin de trouver ses coordonnées. Si vous n’arrivez pas à les repérer, communiquez avec nous à PublicationsArchive-ArchivesPublications@nrc-cnrc.gc.ca.
Questions? Contact the NRC Publications Archive team at
PublicationsArchive-ArchivesPublications@nrc-cnrc.gc.ca. If you wish to email the authors directly, please see the first page of the publication for their contact information.
NRC Publications Archive
Archives des publications du CNRC
This publication could be one of several versions: author’s original, accepted manuscript or the publisher’s version. / La version de cette publication peut être l’une des suivantes : la version prépublication de l’auteur, la version acceptée du manuscrit ou la version de l’éditeur.
For the publisher’s version, please access the DOI link below./ Pour consulter la version de l’éditeur, utilisez le lien DOI ci-dessous.
https://doi.org/10.1021/acs.analchem.7b01601
Access and use of this website and the material on it are subject to the Terms and Conditions set forth at
Determination of the relationship between expression and functional
activity of multidrug resistance-associated protein 1 using scanning
electrochemical microscopy
Polcari, David; Hernández-Castro, Javier Alejandro; Li, Kebin; Geissler,
Matthias; Mauzeroll, Janine
https://publications-cnrc.canada.ca/fra/droits
L’accès à ce site Web et l’utilisation de son contenu sont assujettis aux conditions présentées dans le site LISEZ CES CONDITIONS ATTENTIVEMENT AVANT D’UTILISER CE SITE WEB.
NRC Publications Record / Notice d'Archives des publications de CNRC:
https://nrc-publications.canada.ca/eng/view/object/?id=8ba6c034-f020-49ef-870a-6513ade854d3 https://publications-cnrc.canada.ca/fra/voir/objet/?id=8ba6c034-f020-49ef-870a-6513ade854d3Determination of the Relationship between Expression and
Functional Activity of Multidrug Resistance-Associated Protein 1
using Scanning Electrochemical Microscopy
David Polcari,
†Javier Alejandro Hernández-Castro,
‡Kebin Li,
‡Matthias Geissler,
‡and Janine Mauzeroll
*
,††
Department of Chemistry, McGill University, 801 Sherbrooke Street West, Montreal, QC H3A 0B8, Canada
‡
Life Sciences Division, National Research Council of Canada, 75 de Mortagne Boulevard, Boucherville, QC J4B 6Y4, Canada
*
S Supporting InformationABSTRACT: Cancer cells can develop multidrug resistance (MDR) after prolonged exposure to chemotherapeutic drugs, which is a severe impediment to successful treatment. MDR is typically associated with transmembrane proteins mediating efflux of administered drugs, thereby keeping their intracellular concentration below the threshold required to kill cells. Although expression assays based on flow cytometry and immunostaining have shown that multidrug resistance-associated protein 1 (MRP1) is prevalent in many cancer types, the functional activity of this efflux pump is more
difficult to elucidate, especially at the single-cell level. Herein, we report the measurement of MRP1 functional activity in individual cancer cells using scanning electrochemical microscopy (SECM). Cells were cultured onto plastic substrates containing selective adhesion sites. Optical microscopy and SECM revealed that cells adapt to the underlying surface, while MRP1 functional activity increases once the dimensions of the adhesive islands become smaller than those of the cell itself. Time-lapse SECM imaging revealed a suitable window of 30 min to complete each measurement before the cell undergoes blebbing, which is associated with a considerable increase in functional activity. Distinct cell populations were produced by performing a doxorubicin drug challenge on two parental cell lines (e.g., wild-type HeLa cells and MRP1-overexpressing HeLa-R cells). Expression and functional activity of MRP1 were determined using flow cytometry and SECM, and our findings show that these parameters do not directly correlate. This suggests that functional activity may represent a powerful indicator of a cancer cell’s response to chemotherapeutic treatment and should improve our understanding of efflux mechanisms based on MRP1.
M
ultidrug resistance (MDR) has been attributed to severalproteins within the ATP-binding cassette (ABC) superfamily of transporters, including multidrug resistance-associated protein 1 (MRP1).1−3The prognostic significance of MRP1 expression remains controversial, as several reports have described a direct correlation between MRP1 expression and patient survival,4−6 while others have demonstrated that no such relationship exists.7,8However, an important consideration that is often overlooked is the relationship between transporter expression and functional activity.9Elucidation of this relation-ship could help clarify the role of MRP1 as a prognostic indicator for cancer patient survival.
The measurement of MRP1 expression has been achieved using chromatography,10immunostaining,11 reverse transcrip-tion polymerase chain reactranscrip-tion (RT-PCR),12 and western blotting. The most common assay remains flow cytometry, due to its ease of use and high throughput capabilities.13 The majority of expression assays use intracellular MRP1 antibodies, requiring fixed or lysed cells. Unlike these assays, the determination of functional activity is more challenging, since cell viability and function must be maintained throughout the
measurement. Consequently, the number of techniques available is limited. They include inverted membrane vesicles,14 positron emission tomography,15and flow cytometry.16On the single-cell level, determination of functional activity is even more difficult.
For this purpose, scanning electrochemical microscopy (SECM) can be particularly useful, as it is relatively noninvasive and does not require the use of labels. By scanning a poised microscale electrode over a surface and measuring its current response, it is possible to image both topography and local reactivity with high resolution.17 This electroanalytical technique has been extensively used for the investigation of live cell processes, including respiratory activity,18cellular redox state,19 neurotransmitter release,20 and cytotoxicity.21 We recently demonstrated that SECM could also be used to identify a difference in functional activity between wild-type HeLa cells and genetically modified MPR1-overexpressing
Received: May 1, 2017
Accepted: July 21, 2017
Published: July 21, 2017
HeLa-R cells.22By measuring the faradaic current produced at a microelectrode during the oxidation or reduction of two complementary redox mediators, the topography of the cell surface and the associated MRP1 functional activity could be determined. Koley and Bard also demonstrated the use of SECM for quantitative studies of MRP1.23They showed that in the presence of the MRP1 inhibitor MK571, the functional activity of MRP1 was significantly reduced.
Herein, we rely on SECM to monitor functional activity at the single-cell level. A membrane-based patterning scheme was used to prepare culture substrates on which cells were arranged in a regular array format to facilitate imaging. We utilize complementary SECM and flow cytometry measurements with cells that have undergone a doxorubicin drug challenge to investigate the relationship between MRP1 functional activity and expression.
■
EXPERIMENTAL SECTIONChemicals.All reagents were purchased from either Fisher Scientific (Ottawa, ON, Canada) or Sigma-Aldrich (Oakville, ON, Canada), unless noted otherwise.
Cell Lines. HeLa cells (human cervical adenocarcinoma) were purchased from the American Type Culture Collection (ATCC, Manassas, VA, U.S.A.), and MRP1-overexpressing HeLa-R cells were a generous gift from Dr. Susan Cole (Queen’s University, Kingston, ON, Canada). Both cell lines were maintained in Dulbecco’s Modified Eagle Medium (DMEM, ThermoFisher Scientific, Waltham, MA, U.S.A.) supplemented with 10% v/v fetal bovine serum (FBS), defined as DMEM+, while DMEM without FBS is defined as DMEM−.
Medium for HeLa-R cells also contained 50 μg mL−1 of
gentamicin.
Drug Challenge.Cells (3 × 10⁴) were seeded in a six-well
plate containing DMEM+ and a predetermined concentration
of doxorubicin. For each cell line, one well contained an untreated control population and two others contained doxorubicin-treated populations (i.e., three populations for each cell line, six populations total). Cells were passed when confluence was greater than 70% (typically 3−4 days).
MTS Assay. The doxorubicin sensitivity of parental HeLa cells was determined using the MTS assay (Promega, Madison, WI, U.S.A.). Cells were added to a 96-well plate (2500 cells/ well) and incubated in standard culture medium for 24 h to allow adhesion. The cell medium was then replaced, and increasing amounts of doxorubicin were added. After 72 h of incubation, 20 μL of MTS reagent (3,4-(5-dimethylthiazol-2- yl)-5-(3-carboxymethoxphenyl)-2-(4-sulfophenyl)-2H-tetrazo-lium salt) was added to each well, followed by incubation for 2 h, during which a soluble formazan product was formed in metabolically active cells. The absorbance of each well was measured at 490 nm using a Synergy H4 microplate reader (Biotek Instruments, Winooski, VT, U.S.A.). Cells were treated with 0.4% Triton X-100 as a dead control, untreated cells were used as a negative control, and DMEM+ with 10 μM
doxorubicin was used as a positive control. Untreated cells were assumed to have 100% viability, and all other samples were normalized based on this value.
Western Blotting.Adherent cells were washed twice with PBS, mechanically dislodged with a cell scraper, and resuspended in ice-cold RIPA cell lysis buffer (150 mM NaCl, 0.1% sodium dodecyl sulfate (SDS), 0.5% sodium deoxycholate, 1% Triton X-100, 25 mM TrisHCl, and 1% Halt Protease and Phosphatase Inhibitor Cocktail). After 30 min of
constant agitation at 4 °C, the suspension was centrifuged (20 min, 14000 rpm), and the supernatant was conserved for further analysis. The protein concentration of the cell lysate was determined using the Bradford Protein Assay (Bio-Rad, Mississauga, ON, Canada).
Lysate samples were boiled at 95 °C for 5 min, and 20 μg of sample protein was loaded onto a hand-cast 7.5% poly-acrylamide gel (Bio-Rad). Electrophoretic separation was carried out for 90 min at 110 V. The separated proteins were transferred onto a polyvinylidene fluoride membrane using wet transfer (4 °C, 30 V, 90 mA, overnight). The membranes were then incubated for 1 h at room temperature in blocking solution (5% bovine serum albumin in Tris-buffered saline containing 0.3% Tween). After washing, the membranes were exposed to MRP1 mouse monoclonal antibody QCRL3 (BD Biosciences, San Jose, CA, U.S.A.) and GAPDH mouse monoclonal antibody (ThermoFisher) at 4 °C overnight. Following this treatment, membranes were exposed to horseradish peroxidase-conjugated goat antimouse IgG (Abcam, Cambridge, MA, U.S.A.) for 1 h at room temperature. Finally, membranes were treated with the Clarity Western ECL Blotting Substrate Kit (Bio-Rad) and imaged with a Chemidoc MP System (Bio-Rad). Band-intensity units were measured using Image Lab analysis software (Bio-Rad). The amount of each protein was corrected for loading variations by taking the ratio to the GAPDH control housekeeping protein.
Flow Cytometry. Cells were prepared using a Fixation/ Permeabilization Solution Kit (BD Biosciences). After harvest-ing with trypsin solution, cells were washed twice with PBS (5 min, 1500 rpm) and resuspended to a concentration of 106cells
mL−1. Cells were fixed (Cytofix, 1 mL, 4 °C, 20 min) and then
washed twice with permeabilizing solution (Cytoperm, 5 min, 1500 rpm). Samples were incubated for 30 min at room temperature with FITC-tagged QCRL3 or a FITC Mouse IgG2a, κ isotype Control. Unstained cells were used as a negative control. After incubation, all samples were washed twice with PBS, filtered using a filter with 40 μm pore diameter, and analyzed using a FACS Aria III (BD Biosciences) equipped with a 488 nm laser and 530/30 filter. Data was analyzed using FlowJo, LLC data analysis software (Ashland, OR, U.S.A.).
Preparation of Cell-Culture Substrates. Cell culture substrates had the shape of a disk (2.3 cm in diameter, 0.5 mm in thickness) and were produced by injection molding of Zeonor 1060R (Zeon Chemicals, Louisville, KY, U.S.A.) using an e-motion 110 injection molding tool (Engel, Schwertberg, Austria) operated at a temperature of 250−260 °C, an injection speed of 40 mm s−1, and a pressure of 132 bar. Substrates were
rinsed with ethanol, methanol, and DI water (18.2 MΩ cm), followed by drying with a stream-on nitrogen gas. Open though-hole polymer membranes were fabricated from Fluorolink MD 700 (Solvay Group, Bruxelles, Belgium) using a procedure that is described in detail elsewhere.24,25 Each membrane was cut into smaller pieces (e.g., 10 to 100 mm2in
size) which were placed onto the Zeonor disks. Substrates were then exposed to oxygen plasma at 40 W sccm−1(50 mTorr) for
4 min using a Plasmalab 80 Plus apparatus (Oxford Instruments, Bristol, UK). The membrane was peeled off the Zeonor surface before the substrate was incubated with cell culture medium.
Electrochemical Measurements. SECM imaging was performed using an Electrochemical Probe Scanner 3 (Heka Elektronik, Lambrecht, Germany) with a three-electrode configuration. All potentials were recorded relative to a
Analytical Chemistry Article
DOI:10.1021/acs.analchem.7b01601
Anal. Chem. 2017, 89, 8988−8994
chloridized silver wire (in house) quasi-reference electrode and a Pt-wire counter electrode. The SECM probe was a 7 μm carbon-fiber disk microelectrode, fabricated using a previously reported protocol.26 SECM imaging was performed in constant-height feedback mode, at a scan speed of 10 μm s−1,
in a DMEM−
solution containing 1 mM ferrocenemethanol (FcMeOH) and hexaammineruthenium(III) chloride (Ruhex). Prior to SECM imaging, cells were exposed to 1 mM FcMeOH in DMEM+ for 75 min. All SECM data was analyzed using
MATLAB R2016b (MathWorks, Natick, MA, U.S.A.).
■
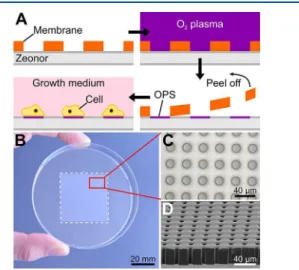
RESULTS AND DISCUSSIONCell Patterning for SECM. Conditioning of a Zeonor cell culture substrate involves exposure to oxygen plasma in conjunction with a soft, open through-hole membrane whose openings enable the formation of oxygen plasma-treated spots (OPS) on the surface (Figure 1A). Previous work has shown
that hydrophilic, oxygen-containing groups (e.g., hydroxyl and carboxylic acid) generated during this process promote attachment, proliferation, and growth of HeLa cells on Zeonor.27 Activating selected sites on an otherwise non-responsive surface makes it possible to direct and confine adhesion of cells in a regular format, which offers several advantages for single-cell SECM investigations. First, it facilitates positioning of the microelectrode above the cells, reducing preparation and analysis time. Second, measurements can be repeated using a similar configuration on the same substrate, which improves the reliability and the significance of the acquired electrochemical response. Finally, it enables the formation of coculture patterns comprising two different cell lines in close proximity, making it possible to investigate their behavior in a single experiment and with the exact same conditions.22We have shown that coculture can be achieved by selectively masking portions of the OPS array to prevent adhesion in these regions during a first incubation step with HeLa-R cells. Upon removal of the mask, the substrate was incubated with HeLa cells to fill the remainder of the array in a complementary fashion. Superimposing the OPS array with a multichannel microfluidic system should, in principle, provide a plausible means for increasing the number of cell lines to be included simultaneously in a coculture pattern while controlling
their distribution on the substrate with superior precision and spatial resolution.28
Open through-hole membranes were produced from a UV-curable polymer resin through a novel process that involves molding against an enclosed micropillar structure.24,25 The method offers a high degree of reliability and promotes the fabrication of membranes over a relatively large area (Figure 1B). Our previous work relied on elastomeric membranes obtained by hot embossing featuring holes between 50 and 400 μm. However, further reduction of the pore dimensions using this approach was challenging and plagued by high failure rates (e.g., pores partially open or not open at all). The method employed herein makes it possible to consistently generate arrays that comprise through-holes with comparatively small dimensions while providing a high degree of porosity (Figure 1C,D). We produced membranes featuring both circular and square openings with dimensions ranging from 10 to 50 μm.
SECM Imaging of MRP1 Functional Activity. The current response measured in SECM depends on the topography and electrochemical activity of the substrate, making it necessary to deconvolute the signal in order to correctly assess MRP1 functional activity for each cell. We recently demonstrated that such a deconvolution can be achieved with a dual redox mediator system comprising FcMeOH and Ruhex.22
FcMeOH is a neutral, hydrophobic redox mediator capable of passively diffusing through the cell membrane, as demonstrated in previous studies on bladder cancer cells.29 At a biased microelectrode (E = +350 mV), FcMeOH is oxidized to [FcMeOH]+. In HeLa cells, FcMeOH passively
diffuses through the membrane, inducing an increased production of glutathione (GSH) within the cell. GSH, a well-established MRP1 substrate, is then effluxed outside the cell by MRP1 and reduces [FcMeOH]+ back to FcMeOH
(Figure 2A). This homogeneous reaction between GSH and
[FcMeOH]+strongly influences the flux of material toward the
microelectrode tip, producing positive feedback (i.e., an increased apparent heterogeneous rate constant measured at the microelectrode), which is representative of the functional activity of the MRP1 pump. It should be noted that before performing SECM experiments, the cells are pre-equilibrated in Figure 1.Cell patterning for SECM. (A) Schematic representation of
the cell patterning process. (B) Photograph of an open through-hole membrane deposited on the bottom of a Petri dish. (C) Top and (D) side view SEM images of open through-hole membranes.
Figure 2.Assessment of MRP1 functional activity using SECM. (A) The cell is scanned in the presence of FcMeOH (abbreviated as Fc), a cell-permeable redox mediator, producing a positive feedback image that represents both topography and functional activity. (B) The cell is scanned in the presence of Ruhex (abbreviated as Ru), a cell-impermeable redox mediator, producing a negative feedback image representing solely topography.
a solution of 1 mM FcMeOH in DMEM+at 37 °C. Ruhex, on
the other hand, is a positively-charged mediator that is reduced at the microelectrode. Contrary to FcMeOH, expelled GSH does not participate in the electrochemical transformation process. Much like other hydrophilic mediators, Ruhex cannot diffuse through the cell membrane, and the cell effectively acts as an insulator.30As the microelectrode approaches the cell, the diffusion of Ruhex toward the microelectrode is hindered, creating negative feedback (Figure 2B).
Using this principle, the measured current responses can be deconvoluted to produce distance and kinetic profiles, as shown in Figure 3. First, the raw current is normalized using the
steady-state current in bulk solution, which was measured prior to the acquisition of each SECM image using chronoamper-ometry at the appropriate potential (EFcMeOH = +350 mV and
ERuhex= −350 mV). This produces a normalized current image
for each mediator (Figure 3A,B), representing positive (IFcMeOH) and negative feedback (IRuhex). Using a grid search
in conjunction with analytical expressions defining negative feedback current,31it is possible to extract a normalized tip-to-substrate distance (defined as L) for each point, and transform the IRuheximage (Figure 3B) into a distance image, representing
the topography of the surface (Figure 3C). Using the data from these images (IFcMeOH, IRuhex, and L) and a grid search, it is
possible to extract an apparent heterogeneous rate constant (defined as k) profile, which is indicative of the MRP1 functional activity of each cell (Figure 3D). Consequently, this SECM methodology allows for the measurement of MRP1 activity at the single cell level, which is currently not possible using other techniques.
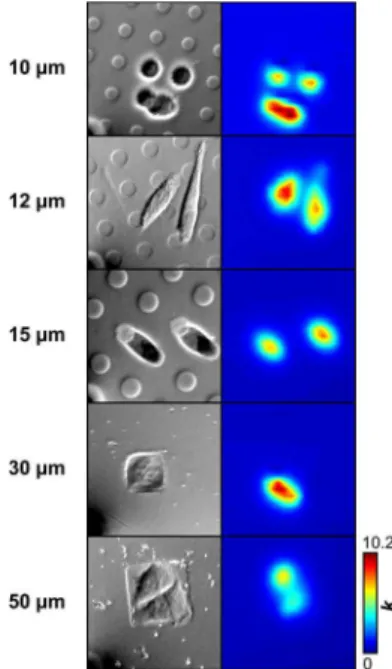
Effect of Pattern Size. We prepared OPS arrays using different membrane configurations (e.g., with pore diameters ranging from 10 to 50 μm) to investigate whether the size and layout of the pattern affect functional activity of HeLa cells (Figure 4). Although HeLa cells typically have a triangular morphology, optical micrographs for each sample show that cells adapt to the available area, either by expanding or retracting. In the case of 10 μm OPS, the cells lack sufficient space and only a small portion can attach to the surface, creating a globular morphology. The corresponding k profile
shows that these cells have a relatively high functional activity, caused by increased stress and unstable attachment. Cells can equally span over several OPS as can be seen for 12 and 15 μm features. Previous studies have shown that cells exceeding the dimensions of the adhering islands are prone to apoptosis unless these features are provided at sufficient density to promote spreading.32As the available area increases (i.e., 30 μm OPS), the cells begin to exhibit a more triangular shape, which is accompanied by a decrease of the measured apparent heterogeneous rate constant. With 50 μm square OPS, the cells exhibit triangular morphology, while k values are comparable to typical levels found for HeLa cells on nonpatterned substrates (Figure S1). On the basis of these findings, we selected OPS with a footprint of 50 × 50 μm2as the most adequate substrate
for conducting all further experiments presented in this study. As a control, an empty OPS (i.e., no adhered cells) was also imaged using both mediators, and no significant response was observed, demonstrating that the conditioning process did not result in changes with respect to topography and electro-chemical activity on the Zeonor surface (Figure S2).
Effect of Time. A particular challenge with live cell SECM imaging derives from the fact that the measurement conditions differ considerably from those of the more ideal physiological environment required for cell culture, including composition of the medium, CO2 levels, and temperature. The cell’s
metabolism and morphology are both subject to alteration when changes in environmental conditions occur. We have previously demonstrated that low concentrations (≤1 mM) of FcMeOH and Ruhex can be used in solution for up to 4 h without causing cell death.33Furthermore, serum-free DMEM is used for all measurements, as serum can cause electrode Figure 3.SECM imaging methodology. (A) SECM negative-feedback
image obtained over the cells using 1 mM Ruhex (E = −350 mV vs Ag/AgCl). Currents are normalized by the steady-state current in bulk solution. (B) SECM positive-feedback image obtained over the same cells using 1 mM FcMeOH (E = +350 mV vs Ag/AgCl). Currents are normalized by the steady-state current in bulk solution. (C) Extracted normalized distance profile (i.e., topography). (D) Extracted apparent heterogeneous rate-constant profile. Values are presented as 10−3cm
s−1. All images have an area of 100 × 100 μm2. (Imaging conditions: a
= 3.5 μm; v = 10 μm s−1).
Figure 4.Effect of OPS size on SECM measurement of functional activity. Left panel: Optical micrographs of HeLa cells patterned on OPS of different sizes and feature densities. The contour of each feature can be seen due to phase contrast induced during imaging and does not represent topography. A small section of the carbon-fiber microelectrode can be seen in the bottom left corner of each micrograph, representing the starting point of each scan. Right panel: Extracted apparent heterogeneous rate constant profile for each substrate. Values are presented as 10−3cm s−1. All images have an area
of 100 × 100 μm2. (Imaging conditions: a = 3.5 μm; v = 10 μm s−1).
Analytical Chemistry Article
DOI:10.1021/acs.analchem.7b01601
Anal. Chem. 2017, 89, 8988−8994
fouling. Measurements were performed at room temperature (24 °C) upon removal of the cell culture substrate from the incubator (37 °C), while the concentration of CO2in solution
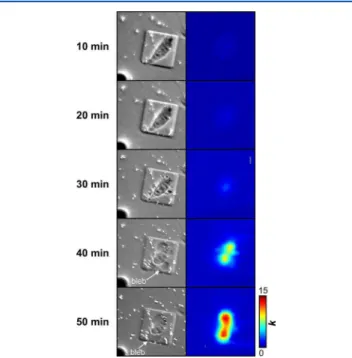
remained uncontrolled. We monitored individual HeLa cells using SECM and optical microscopy for a period of 50 min (using 10 min intervals) to determine the possible effect that this transition may have on cell behavior (Figure 5). Initially,
the cell exhibits a fairly triangular shape, representative of typical HeLa cell morphology. The concurrent k profile shows low functional activity. However, with each sequential scan, the optical micrographs reveal that the cell slowly begins to retract, while at the same time, its functional activity increases. After 40 min (i.e., four consecutive scans), the cell has lost its triangular shape and has progressed toward a more globular morphology, indicative of a stressed state. The optical micrograph also shows a particularly important feature, as blebs can be observed around the cell membrane. Blebbing occurs when the cell
membrane detaches from the actin cortex and cytosol flows from the cell body, inflating the detached area. This effect has been described in other SECM reports and can be indicative of apoptotic cell death.34 In this case, the concurrent k profile reveals very high activity with maximum values almost triple the initial rate. This time-lapse SECM imaging suggests that measurements of MRP1 functional activity should ideally be completed within 30 min to prevent accumulating effects of stress. Likewise, the morphology of the cell should be continuously monitored using optical microscopy, as the formation of blebs results in increased apparent heterogeneous rate constants and could create a false positive response.
Drug Challenge.In order to establish cell populations with varying degrees of expression, a drug challenge was performed, whereby parental cell lines are treated with increasing amounts of a chemotherapeutic agent.35Here, we used doxorubicin, an anticancer drug that is utilized in many chemotherapy regimens. Prior to beginning the drug challenge, the cytotoxicity of doxorubicin on HeLa cells was determined using a colorimetric cell proliferation assay (Figure S3), which revealed that the LD50is equivalent to 0.5 μM. To produce cell
populations with increased MRP1 expression while maintaining cell viability, each parental cell line (e.g., HeLa and HeLa-R) was treated with 1/10 and 1/5 of the LD50, corresponding to
doxorubicin concentrations of 0.05 and 0.1 μM, respectively. MRP1 Functional Activity. The functional activity of six different cell populations was determined using SECM (Figure 6). Cells were patterned onto 50 μm square OPS and allowed to adhere for 24 h. After incubation with FcMeOH for 75 min, a carbon-fiber microelectrode was positioned over the Zeonor using an approach curve. Cells were imaged in constant-height feedback mode in the presence of both FcMeOH and Ruhex redox mediators. The scanning area for all images was maintained at 100 × 100 μm2, which allowed for each image
to be acquired in less than 5 min.
In each case, 2−4 cells have attached within the OPS, and most importantly, no blebbing was observed, indicating that cells were not in a stressed state during the measurement. The microelectrode, characterized by small electroactive radius (a = 3.5 μm) and a low Rg(glass radius/electroactive radius = 3.2),
provided ideal spatial resolution to distinguish individual cells within each OPS. Using IFcMeOH, IRuhex, and L, in conjunction
with a grid search, a final k profile was generated, representing the MRP1 functional activity of each cell population. By compiling the maximum k value (cm s−1) above an individual
cell, the functional activity of each cell population can be Figure 5.Effect of imaging time on SECM measurement of functional
activity. Left panel: Sequence of optical micrographs depicting a single cell attached on a square OPS (50 × 50 μm2) over a duration of 50
min. Right panel: Extracted apparent heterogeneous rate constant profile of cell for each time interval. All images have an area of 100 × 100 μm2. (Imaging conditions: a = 3.5 μm; v = 10 μm s−1).
Figure 6.MRP1 functional activity of six different cell populations obtained through a doxorubicin drug challenge. Top panel: Optical micrographs of the cell populations during SECM imaging. Bottom panel: Extracted apparent heterogeneous rate constant profile. A single scale is used for all populations to visualize differences in contrast. Values are presented as 10−3cm s−1. (Imaging conditions: a = 3.5 μm; v = 10 μm s−1).
quantified. Doxorubicin treatment stimulates a cellular response, which leads to increasing MRP1 functional activity with higher drug doses, both in HeLa and HeLa-R cells.
MRP1 Expression.Prior to starting the drug challenge, the baseline MPR1 expression level of both parental cell lines was verified using western blotting with a monoclonal intracellular MRP1 antibody (e.g., QCRL3,Figure 7A).
Glyceraldehyde-3-phosphate dehydrogenase (GAPDH, 37 kDa) was used as a housekeeping gene to control for protein loading. HeLa cells lacked any expression of MRP1, while HeLa-R cells showed a positive expression of the 190 kDa protein, which is consistent with previous literature reports.36 This large initial difference also suggests that the three populations originating from the HeLa-R parental cell line should express much higher levels of MRP1 relative to the three HeLa populations.
Following the SECM experiments, the MRP1 expression of the exact same six cell populations (e.g., same passage number) was measured using flow cytometry with a FITC-tagged monoclonal antibody (e.g., QCRL3, Figure 7B). An isotype control was also used to account for nonspecific antibody binding. The mean fluorescence intensity of each cell population was determined after applying several gates, including both debris- and doublet-exclusion gates (Figure S4). As expected, all three populations of HeLa-R cells showed a significantly higher expression when compared to their HeLa counterparts.
Expression vs Functional Activity. The functional activity and expression level of six different cell populations were determined using SECM and flow cytometry. In order to assess the relationship between these two important parame-ters, each data set was normalized by the value for untreated HeLa cells. Using this approach, an activity factor (AF) and an expression factor (EF) was calculated, whose values for each cell population are presented inFigure 8.
Each treated population showed a small yet significant increase in EF relative to their parental cell line (95% CL), confirming the presence of six distinct cell populations. EF for HeLa-R populations was at least 6.7× higher than that of HeLa populations, which is consistent with the large difference in initial expression between the parental cell lines. Interestingly,
despite this rather large difference in expression level, AF values of both parental cell lines (i.e., nontreated HeLa and HeLa-R) were not significantly different from each other (95% CL). Stimulation with doxorubicin resulted in an increase in AF for all treated populations (0.05 and 0.10 μm).
The most important observation fromFigure 8is that despite large differences in EF, the change in AF among populations remains relatively small, indicating that in fact these two parameters do not directly correlate. This finding has substantial implications considering that a clear correlation between MRP1 expression and disease-free survival has yet to be established. The determination of functional activity using the described methodology, in conjunction with expression measurements, could provide improved insight into the prognostic value of MRP1 in different types of cancer.
■
CONCLUSIONWe have successfully applied SECM to the measurement of functional activity for both nonresistant and MRP1-over-expressing HeLa cells in real-time and with high spatial resolution. The use of micropatterned substrates allowed for confinement of individual cells to selected adhesion sites to limit additive or interfering effects caused by larger assemblies. Pattern size and geometry were both tailored to achieve maximum isolation while inflicting minimum stress to the adhering cells. The functional activity and expression level of six different cell populations, produced through a doxorubicin drug challenge, were measured using SECM and flow cytometry, respectively. Comparison of both data sets showed that functional activity and expression do not directly correlate. This finding is important insofar as it suggests that perhaps the measurement of functional activity, rather than expression, should be prioritized for the investigation of MDR pumps and their effects, a concept that is gaining traction within the literature.9,37 One limitation of the present work is that the experimental window for SECM investigation is relatively narrow (e.g., <30 min), thus preventing observation of long-term effects on cells when challenged with a chemotherapeutic drug. It would be interesting, however, to use the described methodology for gaining insight into the temporal evolution of MDR-related drug efflux and cell detoxification in general. Figure 7. Assessment of MRP1 expression. (A) Measurement of
MRP1 expression in both parental cell lines (HeLa vs HeLa-R) using western blotting. (B) Flow cytometry measurement of MRP1 expression in drug-selected HeLa and HeLa-R cells.
Figure 8. Comparison of MRP1 functional activity and expression. The plot shows activity and expression factors calculated by normalizing the data to the untreated HeLa population. Values represent mean ± standard error of the mean.
Analytical Chemistry Article
DOI:10.1021/acs.analchem.7b01601
Anal. Chem. 2017, 89, 8988−8994
Observing drug efflux concurrently with MRP1 activity would thereby complement this study in a useful fashion.38 For example, combining SECM with an integrated perfusion system to selectively administer drugs to a single cancer cell might be a suitable step in this direction. This could be achieved using a multifunctional electrode (e.g., which comprises an adjacent delivery channel) as to enable activity and drug uptake being monitored simultaneously in a spatially controlled manner.39 Additionally, it would be interesting to investigate the effect of FcMeOH concentration, as previous SECM reports have demonstrated an increase in the apparent heterogeneous rate constant when the concentration of the mediator was decreased.40
■
ASSOCIATED CONTENT*
S Supporting InformationThe Supporting Information is available free of charge on the
ACS Publications website at DOI: 10.1021/acs.anal-chem.7b01601.
Control SECM image over nonpatterned cells, control SECM image over bare cell culture substrate, cell-viability assay results, and flow cytometry gating strategy (PDF)
■
AUTHOR INFORMATIONCorresponding Author
*E-mail: janine.mauzeroll@mcgill.ca; Phone: 514-398-6545
ORCID
David Polcari:0000-0003-0712-3903 Janine Mauzeroll:0000-0003-4752-7507
Notes
The authors declare no competing financial interest.
■
ACKNOWLEDGMENTSWe thank Dr. Susan Cole (Queen’s University) for providing the MRP1-overexpressing cells. We also thank Isabelle Beaulieu, Samantha Gateman, Nicholas Payne (all McGill University), and Dr. Teodor Veres (NRC) for assistance and useful discussion. This work was supported by the Natural Sciences and Engineering Research Council of Canada.
■
REFERENCES(1) Cole, S. P. C. Annu. Rev. Pharmacol. Toxicol. 2014, 54, 95−117. (2) Gottesman, M. M.; Fojo, T.; Bates, S. E. Nat. Rev. Cancer 2002, 2, 48−58.
(3) Cole, S. P. C.; Bhardwaj, G.; Gerlach, J. H.; Mackie, J. E.; Grant, C. E.; Almquist, K. C.; Stewart, A. J.; Kurz, E. U.; Duncan, A. M. V.; Deeley, R. G. Science 1992, 258, 1650−1654.
(4) Hsia, T. C.; Lin, C. C.; Wang, J. J.; Ho, S. T.; Kao, A. Lung 2002, 180, 173−179.
(5) Triller, N.; Korošec, P.; Kern, I.; Košnik, M.; Debeljak, A. Lung Cancer 2006, 54, 235−240.
(6) Li, J.; Li, Z. N.; Du, Y. J.; Li, X. Q.; Bao, Q. L.; Chen, P. Clin. Lung Cancer 2009, 10, 414−421.
(7) Kim, Y. H.; Ishii, G.; Goto, K.; Ota, S.; Kubota, K.; Murata, Y.; Mishima, M.; Saijo, N.; Nishiwaki, Y.; Ochiai, A. Lung Cancer 2009, 65, 105−111.
(8) Chen, Y.; Zhu, S. M.; Xu, X. L.; Zhao, A.; Hu, J. L. Oncol. Lett. 2016, 11, 745−752.
(9) Krawczenko, A.; Bielawska-Pohl, A.; Wojtowicz, K.; Jura, R.; Paprocka, M.; Wojdat, E.; Kozłowska, U.; Klimczak, A.; Grillon, C.; Kieda, C.; Duś, D. PLoS One 2017, 12, e0172371.
(10) Habicht, K. L.; Singh, N. S.; Khadeer, M. A.; Shimmo, R.; Wainer, I. W.; Moaddel, R. J. Chromatogr A 2014, 1339, 80−85.
(11) Scheffer, G. L.; Kool, M.; Heijn, M.; de Haas, M.; Pijnenborg, A. C. L. M.; Wijnholds, J.; van Helvoort, A.; de Jong, M. C.; Hooijberg, J. H.; Mol, C. A. A. M.; et al. Cancer Res. 2000, 60, 5269−5277.
(12) Kourti, M.; Vavatsi, N.; Gombakis, N.; Sidi, V.; Tzimagiorgis, G.; Papageorgiou, T.; Koliouskas, D.; Athanassiadou, F. Int. J. Hematol. 2007, 86, 166−73.
(13) Leith, C. P.; Kopecky, K. J.; Chen, I. M.; Eijdems, L.; Slovak, M. L.; McConnell, T. S.; Head, D. R.; Weick, J.; Grever, M. R.; Appelbaum, F. R.; Willman, C. L. Blood 1999, 94, 1086−1099.
(14) Marchan, R.; Hammond, C. L.; Ballatori, N. Biochim. Biophys. Acta, Biomembr. 2008, 1778, 2413−2420.
(15) Okamura, T.; Kikuchi, T.; Okada, M.; Toramatsu, C.; Fukushi, K.; Takei, M.; Irie, T. J. Cereb. Blood Flow Metab. 2009, 29, 504−511. (16) Olson, D. P.; Taylor, B. J.; Ivy, S. P. Cytometry 2001, 46, 105− 113.
(17) Polcari, D.; Dauphin-Ducharme, P.; Mauzeroll, J. Chem. Rev. 2016, 116, 13234−13278.
(18) Takii, Y.; Takoh, K.; Nishizawa, M.; Matsue, T. Electrochim. Acta 2003, 48, 3381−3385.
(19) Sun, P.; Laforge, F. O.; Abeyweera, T. P.; Rotenberg, S. A.; Carpino, J.; Mirkin, M. V. Proc. Natl. Acad. Sci. U. S. A. 2008, 105, 443−448.
(20) Hengstenberg, A.; Blochl, A.; Dietzel, I. D.; Schuhmann, W. Angew. Chem., Int. Ed. 2001, 40, 905−908.
(21) Henderson, J. D.; Filice, F. P.; Li, M. S.; Ding, Z. J. Inorg. Biochem. 2016, 158, 92−98.
(22) Kuss, S.; Polcari, D.; Geissler, M.; Brassard, D.; Mauzeroll, J. Proc. Natl. Acad. Sci. U. S. A. 2013, 110, 9249−9254.
(23) Koley, D.; Bard, A. J. Proc. Natl. Acad. Sci. U. S. A. 2012, 109, 11522−11527.
(24) Meunier, A.; Hernández-Castro, J. A.; Turner, K.; Li, K.; Veres, T.; Juncker, D. Anal. Chem. 2016, 88, 8510−8517.
(25) Hernández-Castro, J. A.; Li, K.; Meunier, A.; Juncker, D.; Veres, T. Lab Chip 2017, 17, 1960−1969.
(26) Danis, L.; Polcari, D.; Kwan, A.; Gateman, S. M.; Mauzeroll, J. Anal. Chem. 2015, 87, 2565−2569.
(27) Beaulieu, I.; Geissler, M.; Mauzeroll, J. Langmuir 2009, 25, 7169−7176.
(28) Zhou, H.; Zhao, L.; Zhang, X. Anal. Chem. 2015, 87, 2048− 2053.
(29) Li, M. S. M.; Filice, F. P.; Ding, Z. J. Inorg. Biochem. 2014, 136, 177−183.
(30) Li, X.; Bard, A. J. J. Electroanal. Chem. 2009, 628, 35−42. (31) Lefrou, C.; Cornut, R. ChemPhysChem 2010, 11, 547−556. (32) Chen, C. S.; Mrksich, M.; Huang, S.; Whitesides, G. M.; Ingber, D. E. Science 1997, 276, 1425−1428.
(33) Kuss, S.; Cornut, R.; Beaulieu, I.; Mezour, M. A.; Annabi, B.; Mauzeroll, J. Bioelectrochemistry 2011, 82, 29−37.
(34) Li, M. S. M.; Filice, F. P.; Henderson, J. D.; Ding, Z. J. Phys. Chem. C 2016, 120, 6094−6103.
(35) Mirski, S. E.; Gerlach, J. H.; Cole, S. P. C. Cancer Res. 1987, 47, 2594−2598.
(36) Grant, C. E.; Valdimarsson, G.; Hipfner, D. R.; Almquist, K. C.; Cole, S. P.; Deeley, R. G. Cancer Res. 1994, 54, 357−361.
(37) Sakamoto, A.; Suzuki, S.; Matsumaru, T.; Yamamura, N.; Uchida, Y.; Tachikawa, M.; Terasaki, T. J. Pharm. Sci. 2016, 105, 876− 883.
(38) Lu, H.; Gratzl, M. Anal. Chem. 1999, 71, 2821−2830. (39) Page, A.; Kang, M.; Armitstead, A.; Perry, D.; Unwin, P. R. Anal. Chem. 2017, 89, 3021−3028.
(40) Cai, C.; Liu, B.; Mirkin, M. V.; Frank, H. A.; Rusling, J. F. Anal. Chem. 2002, 74, 114−119.