ORIGINAL ARTICLE
Laboratory validation of a new gas-enhanced dentine liquid
permeation evaluation system
Anas Al-Jadaa&Thomas Attin&Timo Peltomäki&
Christian Heumann&Patrick R. Schmidlin
Received: 10 June 2013 / Accepted: 7 January 2014 / Published online: 18 January 2014 # Springer-Verlag Berlin Heidelberg 2014
Abstract
Aim To validate a new automated dentine permeability testing platform based on pressure change measurements.
Methodology A split chamber was designed allowing for concomitant measurement of fluid permeation and pressure difference. In a first test, system reliability was assessed by interposing a solid metal disk, embedded composite resin disks, or teeth by consecutively measuring eight times under standardized conditions. Secondly, the repeatability and ap-plicability of the method was tested in a dentine wound model by using intact third molars: Class I (2×5 mm) and a full occlusal preparation as well a ceramic restoration were con-secutively performed and repeatedly measured eight times each. In the last test, the system detection limit as well corre-lation between gas pressure difference and liquid permeation were evaluated: Again, third molars were used and occlusal preparations of increasing size (2×5, 3×5, 4×5, and 5×5 mm and full occlusal preparations, respectively) were made. Data was analyzed for the linearity of measurement, and R2values were calculated.
Results The embedding procedure allowed for perfect sepa-ration of the two chambers, and no significant variation in repeated measurements of evaluated samples for the respec-tive treatments (p= 0.05) was found. The detection was
0.002 hPa/min for the pressure slope and 0.0225μl/min for the fluid infiltration, respectively. The saline volume was highly correlating to the gas pressure changes (R2=0.996, p<0.0001).
Conclusions The presented method is a reliable and exact tool to assess dentine permeability by nondestructive and repeat-able measurements.
Clinical relevance This method is suitable for measurements and comparison of the effectiveness of dentine wounds sealing materials.
Keywords Dentine . Sealability . Permeability . Restoration leakage
Introduction
The unique tubular structure of dentine is mainly related to evolutionary functional adaptation to enable mastication by transducing bite pressures into tensile forces in the collagen matrix [1]. In addition, fluid-filled dentinal tubules allow for transducing stimuli to the underlying pulp [2]. This results in a sophisticated functional and sensitive organ. On the other hand, exposed dentinal tubules can lead to dentine hypersen-sitivity or—if adjacent to infectious processes—reflect patho-logical conditions like caries [3]. Effective protection of den-tinal tubules has therefore a pivotal role in clinical dentistry.
After the observation that fluids could permeate through dentinal tubules of extracted teeth [2, 4], various in vitro models were established to study dentine wounds and were modified later to test for leakage in restorations and root canal fillings. The versatile split-chamber model to test infiltration of isotopes was revolutionary in that field [5]. It had a simple design to hold and test small dentinal disk specimens. A decade later, Derkson and coworkers introduced—inspired by the fluid shift model of Brännstrom—their pressurized
A. Al-Jadaa (*)
:
T. Attin:
P. R. SchmidlinDepartment of Preventive Dentistry, Periodontology and Cariology, Center for Dental Medicine, University of Zurich, Plattenstrasse 11, 8032 Zurich, Switzerland
e-mail: [email protected] T. Peltomäki
Oral and Maxillofacial Unit, Tampere University Hospital, Tampere, Finland
C. Heumann
fluid transport model, which aimed to test the seal around restorative fillings [6]. The same setup was adapted to test the seal of root canal fillings [7]. The fluid shift model was later digitized to measure the infiltrated fluid volume in real time [8]. In 2008, Romieu and coworkers [9] introduced a new dimension in leakage measurements using a testing system with two pressurized chambers. By continuously recording the air pressure difference between the two differently pres-surized chambers, the ratio of pressure change provided an indirect value of air leakage. However, this evaluation was performed under dry conditions, which may be considered a significant shortcoming of this method and potentially results in dehydrated test specimens and an unrealistic simulation with regard to the originally intended oral cavity conditions to be tested.
Since the hydrodynamic theory is widely accepted to explain dentine sensitivity [10], the fluid infiltration method may still be considered as the gold standard in permeability/leakage testing and it can be adopted to many types of leakage testing. However, most of these currently available testing models exhibit some disad-vantages. Among them, the long testing time, the diffi-culty of establishing a repeatable setup, the lack of internal control and possible entrapment or reaction of perfusing substances with the sample are worth mentioning. Another potential bias, which was underestimated for a long time was the permanent fixation in adhesive mate-rials (epoxy resins, waxes, etc.) without adequate testing before and after treatment, which resulted in a lack of an internal quality control. Therefore—not surprising-ly—it has been shown that these embedding processes can also lead to potential overestimation in permeation testing [11]. Another disadvantage of most setups, namely to test only at a single time, additionally limits the possibility to compare between different treatments or even the same treatment at different stages using the same specimen.
Due to these limitations, a new testing platform was de-signed aiming to reliably measure sealability based on a combination of previously mentioned models, namely a split-chamber model measuring fluid permeation and the resulting gas pressure difference simultaneously. The aim of this study was to validate the accuracy as well the leakage-free embedding of samples. Reproducibility of repeated measure-ments was assessed. The working hypotheses and require-ments were as follows:
1. The embedding causes no false-positive measurements. 2. The repeated measurements of identical samples result in
reproducible results.
3. The detection limit to assess permeation is low.
4. The liquid collected during the permeation test correlates to the gas pressure differences.
Materials and methods
Setup of the leakage/permeability measuring device
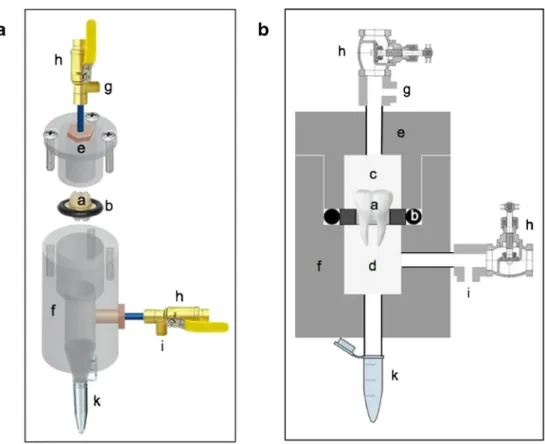
The split testing chamber model consisted of two custom-made plexiglass parts, which were tightened to-gether using three solid screws (Fig. 1). The embedded specimens were fixed between the two parts using a rubber O-ring with an outer diameter of 22 mm, an inner diameter of 15 mm, and a thickness of 3.5 mm, thus forming two fully separated chambers with the sample fixated in between. The lower chamber was opened at its lower terminal with an adapter fixed to the outside allowing the placement of an Eppendorf tube to collect the permeating liquid. The two chambers were connected to two valves to stabilize their pressure during testing once they were closed.
The temperature was controlled as follows: The permeability/leakage unit (Fig.2a) was installed in an isola-tion chamber (Fig. 2b), in which the temperature was con-stantly held at 35 °C. This chamber was situated in a second larger experimental box (Fig.2c), in which the temperature was always kept at 31 °C. The room temperature was stable at 25 °C.
Pressure difference measurements
A pressure difference measuring device (Testo 526, Testo AG, Lenzkirch, Germany) was connected by its two inlets to the tubes connected to the upper and lower chambers just before the valves, which allowed for real-time measurement. The measuring device was connected to a computer unit running a proprietary program (V 4.2 SP2, Testo AG, Germany). The O-ring was lubricated with a silicon grease (Molykote 111 compound, DOW Corning GMBH, Germany) to improve the sealability between the two chambers. The specimen was then positioned in the ring, and 2.5 ml of a pre-pressurized (N2 gas 860 hPa) 0.9 % NaCl solution was added on
top in the upper chamber. The cover was repositioned and the three screws were tightened using a torque-controlled screwdriver. The upper chamber was then pressurized with N2gas to 860 hPa. The lower chamber
was negatively pressurized down to minus 170 hPa. This resulted in an effective pressure difference of 1,030 hPa between the two chambers. Given the hy-pothesis that there is a connection between the two chambers, i.e., leakage through the sample, this would affect the pressure difference. The pressure difference would change and become smaller by penetration of the NaCl solution from the positive pressure chamber to the low pressurized chamber causing a pressure drop in the positive side and a pressure increase in the
negative side, until the pressure is equalized in both chambers and the difference reaches 0 hPa. The pres-sure difference meapres-surements were started and
continued for 40 min at a rate of 1 measurement/s. The reading resulted in a data set and a curve representing the rate of pressure change expressed as a
Fig. 1 Split chamber with the two valves connected to control pressure on both sides. a 3D graph; b enhanced schematic drawing showing the position of the mounted tooth in testing. The parts are matched in both drawings. (a) A tooth sample mounted in a disk carrier. (b) O-Ring. (c) Positive pressurized chamber. (d) Low pressurized chamber. (e) Split-chamber cover. (f) Split-chamber body. (g) Positive outlet attached to the pressure difference measuring device. (h) Securing valves. (i) Negative outlet attached to the pressure difference measuring device. (k) Eppendorf tube to collect permeating fluid
Fig. 2 Stepwise temperature control; a Split chamber mounted in the testing inner isolation room. b Inner Isolation chamber. c Outer Isolation room
drop in pressure difference over time. The pressure value at two fixed time points (1,200 and 2,400 s) were defined to calculate the slope in between:
Slope¼P2−P1
T 2−T1hPa=min:
All results were expressed as positive values for the statis-tical analysis for the ease of understanding, as we aimed to show a positive correlation with the infiltrated fluid volume.
These optimal time points to detect the slope were found by preliminary observations on repeated measurements of the same sample to be reproducible (data not shown). In addition, the infiltrated physiological saline solution was collected and weighed to calculate the volume that permeated the specimen (see“System detection limit and correlation between pressure difference and fluid permeation” below).
Specimen preparation
To test the tightness/sealability, repeatability, detection limit, correlation between the measured outcomes, and the capabil-ity of the embedding procedures in maintaining a tight seal after multiple measurements with no or minimal changes, a solid metal disk, embedded composite disks, and third molars were interposed. The solid metal disk (3 mm thick and had a diameter of 15 mm) was chosen as gold standard for tightness, as no embedding procedure was involved, and thus no addi-tional interfaces were created. The solid metal disk had the exact thickness and outer dimensions of the embedding brass rings used in the setup (Fig.5, Exp. A). It was used to measure the internal system leakage at all joints and connections. Therefore—hypothetically—this test should result in no leak-age and served as an internal system tightness control.
The round composite disks had a diameter of 7 mm and a thickness of 3 mm and were fabricated using a Teflon mold and composed of dual cure composite buildup material (Luxa Core Automix, DMG, Hamburg, Germany). This allowed for the formation of a nonporous solid biomaterial/tooth surrogate sample given the hypothesis that no leakage should occur given an adequate sealing around it. Accordingly, third molars were selected as natural products from the department’s pool of extracted teeth. They were extracted for reasons not related to the current study from patients aged 18–20 years. All teeth were free of caries and restorations. The roots were not fully developed ensuring proper pass to the pulp chamber and allowing for retrograde pulp extirpation. Samples were stored in 0.2 % thymol at a temperature of 5 °C for no longer than 1 year. Both, composite disks and teeth, were embedded in custom-made brass rings with an outer diameter of 15 mm, an inner counterpart of 10 mm, and a thickness of 3 mm. The rings were sandblasted on their inner surface using 50-μm aluminum oxide (Benzer-Dental AG, Zurich, Switzerland),
and the specimens were embedded using a light-curing nail build-up material kit (Sina, Shenzhen Cyber Technology Ltd, Mainland, China). This material consisted of a primer, a gel, and a glaze material. The teeth as well the rings were primed and light-cured for 2 min in a light-cure chamber (Spectramat, Ivoclar Vivadent, Schaan, Liechtenstein). Subsequently, the parts were fixed in position using a rubber carrier made of a putty material (Optosil, Heraeus Kulzer GmbH, Hanau, Ger-many) (Fig.3). The gel was applied in one increment to fill the space between the ring and sample. Care was taken not to allow excess material formation on the two upper or lower surfaces of the metal ring. The buildup was then light-cured for 4 min. Finally, the glaze layer was applied to the surface to eliminate any imperfections in the embedding gel buildup, which was finally light-cured for another 4 min. This embed-ding method was used for all repeatability and correlation samples tested as described in this study.
Sealing accuracy and repeatability evaluation
The metal and the composite disks as well three intact third molars were prepared as described above, and pressure differ-ence measurements were repeated eight times each (Fig.4a) to establish an initial reference baseline.
In addition, three third molar teeth were measured for permeability after creation of dentine wounds (class I prepa-rations; 2×5 mm and a depth of 2 mm from the fissure level) and a subsequent full occlusal surface preparation, which completely removed the occlusal enamel until the CI prepara-tion floor. All preparaprepara-tions were made using a tapered dia-mond bur (Number 8117, Intensiv SA, Montagnola, Switzer-land) attached to a parallel drill holder (Cendres & Metaux SA, Biel, Switzerland). To ensure no effect of the repeated measurements on the embedding, the teeth then were restored after conditioning (Clearfil SE Protect, Kuraray America Inc., USA) according to the manufacturer’s instructions using CAD/CAM onlays (Sirona Cerec Blocs, VITA Zahnfabric, Bad Säckingen, Germany) cemented with Multilink (Ivoclar Vivadent AG, Liechtenstein). Again, all samples were tested eight times at each step (Fig.5, Exp. A and B). The different measurements for each sample for the respective treatments were carried out on different days to assess potential influence of storage on the embedding and permeability. For the interim, samples were kept in physiologic saline at room temperature.
System detection limit and correlation between pressure difference and fluid permeation
To assess the correlation between the two quantitative primary outcome parameters of the device, i.e., gas pressure difference change and liquid permeation, six additional third molar teeth from the department’s collection of extracted teeth were used (molars 4–9). They were tested after embedding and before preparation to assess the baseline performance, i.e., tightness. The measured curves were used to determine the method detec-tion limit, i.e., the minimum measured permeability value that could be observed in a sample with confidence. Subsequently, consecutive preparations were performed in all specimens with increasing invasiveness and dimensions (2×5, 3×5, 4×5, and 5×5 mm and a depth of 2 mm from the fissure level) and finally a full occlusal trimming was performed as described under “Sealing accuracy and repeatability evaluation” (Fig.5, Exp. C). After each step, the pressure difference change was mea-sured as described above (Fig.4b). In addition, the saline that permeated each specimen was collected in the tube that was attached to the apparatus. The volume of liquid was measured by calculating the weight difference of the tube before and after
the experiment using a precision scale (Mettler AT261 Delta Range, Greifensee, Switzerland).
Data presentation and analysis
Repeatability of the individual pressure change difference within the same sample for the same treatment was assessed using a linear mixed model.
Permeability expressed as the slope in hectopascal per minute and the total permeating water volume were calculated separately for each of the four conditions (baseline after em-bedding, CI I preparation, full occlusal preparation, and res-toration) and results were presented as the range of data obtained in the individual measurements (original measure-ment and seven repetitions).
To assess the detection limit, the measurement background noise in the test curves of the sound 6 teeth at fixed 9 time points with 120-s intervals was calculated mathematically. It was calculated by measuring the deviation from the ideal curve drawn between the two fixed time points to determine the leakage slope value independently. When the ideal slope value (hectopascal per minute) and the time interval are
Fig. 4 a A representative graph of a tested sample with eight repeated measurements for its baseline permeability
(hectopascal per minute): (a) The gas compensation curve (each pressurized gas will behave unstable for a period of time). (b) System stabilization curve, which is related to temperature compensation. (c) The permeability curve which is related to the sample permeability status. (d) The permeability slope. b A representative graph showing the permeability curves of a sample tested for multiple treatments. Baseline curve (blue). After CI I preparation (green). After full occlusal preparation (red). After Cerec onlay restoration (purple).
known, it is possible to calculate the ideal measurement value at each point. The deviation from this was calculated, and average deviations were then pooled for each sample and used for further calculations [12].
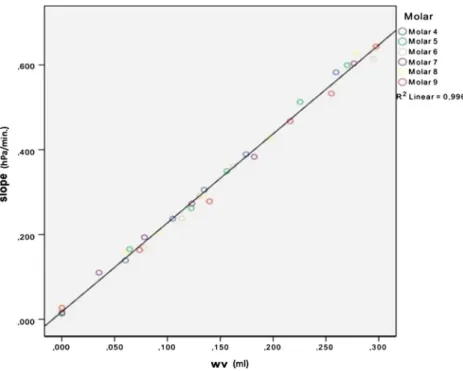
To test whether the slope in the pressure change over time correlated with the collected saline solution (N=6), the Pear-son correlation coefficient was used [13] (Fig.6).
Results
The mean slope values (Table1) for the baseline measure-ments, i.e., the measurements of the sample permeability status before treatment, ranged between 0.01 and 0.03 hPa/ min, indicating proper embedding seal of the specimens. The range of variation after repeated measurements of a sample did not exceed the 0.01 hPa/min. Testing for repeat-ability, a high linearity was shown (Table 2), indicating consistent results obtained with specimens that were mea-sured multiple times.
The detection limit of 0.043 hPa for the pressure difference was calculated, which correlated to a slope value of 0.002 hPa/ min and a fluid infiltration of 0.0225μl/min. Testing for the pressure difference–infiltrated fluid volume correlation using the Pearson coefficient with the confidence interval set at (p=0.05) showed the point estimate of 0.99785 with standard deviation of 0.0002387463 (R2=0.996). This confirmed the high correlation between pressure change and fluid filtration (Fig.6).
Consequently, all four working hypotheses were accepted.
Discussion
Permeation testing methods varied over the last years with many modifications; however, most models focussed on fluid infiltration [2]. The variance in methodology, unfortunately, still makes it difficult to interpret and compare results. There-fore, leakage testing is not any more unambiguously accepted in some scientific journals due to the fact that it cannot be ensured that leakage measured is related to actual treatment
Fig. 5 a Disk/specimen embedding quality and repeatability; one full metal disk (a,no embedding), three embedded composite disks (b), and three embedded third molars (c); eight consecutive measurements in each sample. b Repeatability of measurements in dentine wounds; three molars (of a) with 2×5 mm (a) and full occlusal preparation (b) as well as
consecutive restoration (c); eight consecutive measurements in each sam-ple. c Correlation between fluid permeation and gas pressure difference; six third molars (a) with stepwise increasing preparation size of 2×5, 3× 5, 4×5, and 5×5 mm (b–e) and full preparation (f); one measurement per sample
status only [14]. Permeation might also occur through other niches leading to false-positive results. This study therefore tried to establish and validate a novel device to test dentin permeability more reliably under standardized conditions. The focus of this study was basically to assess the accuracy of the combined determination of fluid permeation and pressure changes over time as well as the leakage-free embedding of samples and the reproducibility of their repeated measure-ments, which altogether build the basis for any kind of eval-uation using this device in the future.
The presented setup is a nondestructive technique allowing testing under environmental conditions because of the use of a net effective pressure 1,030 hPa close to atmospheric air pressure under a standardized simulated mouth temperature of 35° [15]. The repeatability and accuracy can be related to the standardized conditions.
This study showed that the embedding procedure allowed for perfect separation of the two chambers and that no to only a very minute variation in repeated measurements of the
evaluated samples for all treatments was found. In addition, the saline volume was highly correlating to gas pressure chang-es with a low detection limit. Therefore, the prchang-esented method appears to be a fast, reliable, and exact tool to assess perme-ability allowing for nondestructive and repeatable leakage measurements.
Unlike previous methods, the embedding procedure for each sample was tested independently. This allowed for the baseline status to be considered once the effective permeabil-ity is calculated for. Under normal conditions, embedding seal depends on the researcher skills and the material used. Tech-nically, this does not play a major role in the current setup, as it will be compensated for. The embedding material used was chosen after long trials with other materials. Waxes proved not to be sealing properly, especially with teeth. Epoxy glue resins were also screened: Although they were initially tight, they could not withstand storage conditions in liquids for more than 24 hours, while composite resin materials had problems to stick to brass and silicon and were not adequately sealing in
Fig. 6 Plotted linear regression line, showing the correlation between the slope value (y-axis, denoted as Slope, measurement unit: hectopascal per minute), and the permeated saline volume (x-axis, denoted by wv, measurement unit: milliliters)
Table 1 Slopes of regression lines according to respective specimen
Specimen Initial (hPa/min) Class 1 preparation (hPa/min) Occlusal full preparation (hPa/min) After restoration (hPa/min)
Metal disk 0.01 (0.01, 0.01) – – – Composite disk 1 0.02 (0.02, 0.02) – – – Composite disk 2 0.03 (0.03, 0.03) – – – Composite disk 3 0.02 (0.02, 0.03) – – – Third molar 1 0.02 (0.02, 0.02) 0.19 (0.19, 0.19) 0.36 (0.36, 0.36) 0.02 (0.02, 0.03) Third molar 2 0.02 (0.02, 0.02) 0.21 (0.21, 0.22) 0.42 (0.42, 0.42) 0.02 (0.02, 0.02) Third molar 3 0.03 (0.03, 0.03) 0.23 (0.22, 0.23) 0.48 (0.48, 0.48) 0.03 (0.03, 0.04)
thin sections. The only material found to last after long storage in liquids and multiple measurements with a proper adherence to all mounted parts was a simple nail buildup gel as presented. Although the embedding baseline measurement varied slightly among the samples, the possible false-positive error was over-come by subtracting the baseline slope value from the subsequent measurements to calculate for the absolute permeation value.
The testing under standardized temperature is usually also an ignored aspect [16]. In many studies, testing was done at room temperature [10]. The system allowed testing under moisturized conditions and a temperature of 35°, which is the average temperature in the oral cavity [15]. The need for testing at this constant temperature is important, as it was demonstrated that dentine permeability increases with higher temperatures [16, 17]. Unlike pure gas testing units and porometers, the device prevents sample dehydration, which allows for further testing of the same samples without affect-ing their physical properties. Another reason to simultaneous-ly appsimultaneous-ly pressure and vacuum is the wish to eliminate any bubble entrapment which might interfere with the permeabil-ity testing as it is the case in passive permeation testing [18]. In addition, the new chamber design and embedding makes it easy to remount specimens for consecutive testing, which overcomes the problem of calibrating the air bubble in posi-tion, a problem encountered in the latter method. In addiposi-tion, the simple small carrier system opens the door for multiple steps and interventional studies using the same sample in different conditions to produce comparative data for proper conclusions. This contrasts with substance permeation methods, in which the results depend on the permeated sub-strate molecular size, osmolarity, and possible capability of entrapment or reacting with other substrates in the tested samples, and as an end effect might result of under estimation of the real permeability status of the specimen. The current setup overcomes these shortcomings by using a physiologic saline solution, which does not have any interaction or inter-ference with the permeation process.
While validating the new method, a strong evidence of accuracy and repeatability in correlation to the permeated fluid volume for both biological as well artificial samples was found. Therefore, this method appears suitable for longitudi-nal in vitro studies with repeated measurements in the dental field. Although there was a slight deviation from 0, the corre-lation was high. This can be explained either by the difficulty
in collecting some entrapped fluids in the sample, or possible evaporation under low-pressurized conditions. The ease of embedding process and mounting of samples reduced the effort during the testing procedure; the samples pretesting before treatments ensured the compensation for the error related to the baseline status of the sample.
Conclusion
The embedding causes no false-positive measurements and the chamber model per se is tightly sealed as evidenced by the following:
1. The repeated measurement of identical samples results in reproducible results.
2. The detection limit to assess permeation is low.
3. The liquid collected during the permeation test correlates to the gas pressure differences.
Acknowledgments Special thanks to Mr. Willi Bucher for his efforts
and technical support establishing the measurement platform.
Conflicts of interest The authors declare that they have no conflict of
interest.
References
1. Kishen A, Ramamurty U, Asundi A (2000) Experimental studies on the nature of property gradients in the human dentine. J Biomed Mater Res 51:650–659
2. Brannstrom M, Linden L, Astrom A (1967) The hydrodynamics of the dental tubule and of pulp fluid. A discussion of its significance in relation to dentinal sensitivity. Caries Res 1:310–317
3. West N, Lussi A, Seong J, Hellwig E (2013) Dentin hypersensitivity: pain mechanisms and aetiology of exposed cervical dentin. Clin Oral Investig 17(Suppl 1):S9–S19
4. Spreter VKT, Lockowandt P, Stuben J (1951) Porosity in self-curing plastics and its relation to the vapor pressure of the monomer. Dtsch Zahnarztl Z 6:1328–1332
5. Outhwaite W, Mckenzie D, Pashley D (1974) A versatile split-chamber device for studying dentin permeability. J Dent Res 53:1503 6. Derkson G, Pashley D, Derkson M (1986) Microleakage measure-ment of selected restorative materials: a new in vitro method. J
Prosthet Dent 56:435–440
7. Wu M, Wesselink P (1993) Endodontic leakage studies reconsidered.
Part I. Methodology, application and relevance. Int Endod J 26:37–43
8. Ciucchi B, Bouillaguet S, Holz J, Pashley D (1995) Dentinal fluid
dynamics in human teeth, in vivo. J Endod 21:191–194
9. Romieu O, Jacquot B, Callas-Etienne S, Dutilleul P, Levallois B, Cuisinier F (2008) Gas permeability: a new quantitative method to
assess endodontic leakage. Biomed Tech (Berl) 53:181–184
10. Pashley D, Matthews W, Zhang Y, Johnson M (1996) Fluid shifts across human dentine in vitro in response to hydrodynamic stimuli.
Arch Oral Biol 41:1065–1072
11. Rechenberg D, Thurnheer T, Zehnder M (2011) Potential systematic error in laboratory experiments on microbial leakage through filled
root canals: an experimental study. Int Endod J 44:827–835
Table 2 Pearson correlation coefficient values for permeation slope values and total water volume, for repeated measurements after different treatments
Variable Initial Class 1
preparation Occlusal full preparation After restoration Slope 0.9863832 0.9964485 0.999631 0.9814998 Fluid volume 1 0.9907555 0.9992009 1
12. Gläser M, Kochsiek M (2010) Handbook of metrology. Handbook of Metrology by Michael Gläser and Manfred Kochsiek. Wiley, New York 13. Lorenz D, Datta S, Harkema S (2011) Marginal association measures
for clustered data. Stat Med 30:3181–3191
14. Rechenberg D, De-Deus G, Zehnder M (2011) Potential systematic error in laboratory experiments on microbial leakage through filled
root canals: review of published articles. Int Endod J 44:183–194
15. Moore R, Watts J, Hood J, Burritt D (1999) Intra-oral temperature
variation over 24 hours. Eur J Orthod 21:249–261
16. Outhwaite W, Livingston M, Pashley D (1976) Effects of chang-es in surface area, thicknchang-ess, temperature and post-extraction
time on human dentine permeability. Arch Oral Biol 21:599–
603
17. Pashley D, Thompson S, Stewart F (1983) Dentin permeability: effects of temperature on hydraulic conductance. J Dent Res 62:
956–959
18. Wu M, De Gee AJ, Wesselink P (1994) Fluid transport and dye