HAL Id: hal-02150640
https://hal.archives-ouvertes.fr/hal-02150640v2
Submitted on 13 Apr 2020
HAL is a multi-disciplinary open access archive for the deposit and dissemination of sci-entific research documents, whether they are pub-lished or not. The documents may come from teaching and research institutions in France or abroad, or from public or private research centers.
L’archive ouverte pluridisciplinaire HAL, est destinée au dépôt et à la diffusion de documents scientifiques de niveau recherche, publiés ou non, émanant des établissements d’enseignement et de recherche français ou étrangers, des laboratoires publics ou privés.
To cite this version:
Magdalena Oryaëlle Chevrel, Harry Pinkerton, Andrew J.L. Harris. Measuring the viscosity of lava in the field: A review. Earth-Science Reviews, Elsevier, 2019, �10.1016/j.earscirev.2019.04.024�. �hal-02150640v2�
Measuring the viscosity of lava in the field: A review
1 2
Magdalena Oryaëlle Chevrela*, Harry Pinkertonb, Andrew J.L. Harrisa 3
aUniversité Clermont Auvergne, CNRS, IRD, OPGC, Laboratoire Magmas et Volcans,
f-4
63000 Clermont-Ferrand, France 5
bLancaster Environment Centre, Lancaster University, Lancaster LA1 4YQ, United Kingdom
6 7
*Corresponding author: oryaelle.chevrel@gmail.com
8 9
Abstract
10
Many scientists who have worked on active lava flows or attempted to model lava flows have 11
recognized the importance of rheology in understanding flow dynamics. Numerous attempts 12
have been made to estimate viscosity using flow velocities in active lava channels. However, 13
this only gives a bulk or mean value, applies to channelized flow, and the need to estimate 14
flow depth leads to a large degree of uncertainty. It is for this reason that some scientists 15
resorted to more direct methods for measuring the lava viscosity in the field. Initial attempts 16
used crude instruments (such as forcing a rod into a flow using the operators body-weight), 17
and even the latest instruments (motor-driven rotational viscometer) are significantly less 18
refined than those one would encounter in a well-equipped laboratory. However, if suitable 19
precautions are taken during instrument design, deployment in the field and post-processing 20
of data, the results form an extremely valuable set of measurements that can be used to model 21
and understand the complex rheological behavior of active lava flows. As far as we are aware, 22
eleven field measurements of lava rheology have been published; the first took place in 1948, 23
and the latest (at the time of writing) in 2016. Two types of instrument have been used: 24
penetrometers and rotational viscometers. Penetrometers are suitable for relatively high 25
viscosity (104
-106
Pa s) lava flows, but care has to be taken to ensure that the sensor is at lava 26
temperature and measurements are not affected by the resistance of outer cooled crust. 27
Rotational viscometers are the most promising instruments at lower viscosities (1-104
Pa s) 28
because they can operate over a wider range of strain rates permitting detailed flow curves to 29
be calculated. Field conditions are challenging and measurements are not always possible as 30
direct approach to and contact with active lava is necessary. However it is currently the only 31
way to capture the rheology of lava in its natural state. Such data are fundamental if we are to 32
adequately model and understand the complex behavior of active lava flows. 33
34
Keywords
35
Lava flow, Rheology, Field Viscometry, Shear Stress, Strain Rate, Viscosity, Yield Strength, 36
Penetrometer, Rotational viscometer 37
1 Introduction
38
Lava flow dynamics and flow length are influenced by a number of factors including effusion 39
rate at the vent, ground slope, channel dimensions, flow velocity, eruption duration, insulation 40
and, critically, the rheology of the lava (e.g., Walker 1973; Pinkerton and Wilson 1994; 41
Keszthelyi and Self 1998; Griffiths 2000; Harris et al. 2005; Kerr and Lyman 2007; Harris 42
and Rowland 2009; Castruccio et al. 2013). During an eruption, estimates of the effusion rate 43
and mean ground slope can be made, and these can be used as source terms in lava flow 44
emplacement models to assess potential hazards (e.g., Vicari et al., 2011; Ganci et al., 2012; 45
Mossoux et al., 2016; Coppola et al., 2017). However, the rheological properties of the 46
flowing and modeled lava are subject to major uncertainties. Current lava flow models (e.g., 47
Crisci et al. 1986; Harris and Rowland 2001; Hidaka et al. 2005; A Vicari et al. 2007; Herault 48
et al. 2009; 2011; Bilotta et al. 2014; Kelfoun and Vargas 2016; Chevrel et al. 2018a) use 49
rheological data that are either unchanging during flow development or vary down flow as a 50
function of evolving temperature and crystal content. However, these do not accurately reflect 51
the behavior of lava during emplacement because they neglect the effects of volatile content, 52
oxygen fugacity, cooling rate, degassing, strain rate and bubble growth. 53
Lava is composed of crystals and bubbles in suspension in a silicate liquid and its 54
rheology depends on the viscosity of the liquid phase and on the effect of the particles 55
(bubbles and crystals) it contains (cf. Pinerton and Stevenson 1992; Crisp et al., 1994; 56
Cashman et al., 1999; Mader et al., 2013). The viscosity therefore changes down flow because 57
lava temperature, bubble content and crystallinity evolve as functions of both time (i.e., as 58
eruption progresses) and space (i.e., with distance from the source) (Lipman et al., 1985; 59
Lipman and Banks, 1987; Moore, 1987; Crisp et al., 1994; Cashman et al., 1999; Soule et al., 60
2004; Riker et al., 2009; Chevrel et al., 2013; Robert et al., 2014; Rhéty et al., 2017). Upon 61
eruption, the liquid phase is Newtonian and its viscosity depends on chemical composition 62
(including major elements and volatiles) and temperature. The viscosity of silicate melts is 63
relatively easily measured as a function of temperature in the laboratory and composition-64
based empirical models have been established (e.g., Bottinga and Weill, 1972; Shaw, 1972; 65
Hess and Dingwell, 1996; Giordano and Dingwell, 2003; Hui and Zhang, 2007; Giordano et 66
al., 2008; Sehlke and Whittington, 2016). In contrast, the effect of particles is more difficult 67
to quantify because the mixture becomes non-Newtonian and yield-strength, shear thinning 68
and thixotropic behavior may appear. The mixture (melt + particles) rheology depends on 69
particle concentration, aspect ratio (for crystals), ability to deform (for bubbles), size 70
distribution, shear stress and applied strain rate (Barnes, 1989; Larson, 1999). The effect of 71
particles has been estimated via several theoretical and empirical models based on 72
experiments of analogue material (e.g., Einstein, 1906; Krieger and Dougherty, 1959; Maron 73
and Pierce, 1956; Costa et al., 2009; Mueller et al., 2010; Castruccio et al., 2010; Cimarelli et 74
al., 2011; Moitra and Gonnermann, 2015; Klein et al., 2018). These have been applied to 75
constrain lava flow rheology in several studies (Pinkerton and Stevenson, 1992; Crisp et al., 76
1994; Cashman et al. 1999; Guilbaud et al., 2007; Harris and Allen, 2008; Riker et al., 2009; 77
Chevrel et al., 2013; Le Losq et al., 2015; Castruccio and Contreras, 2016; Chevrel et al. 78
2016; Rhéty et al., 2017). The effect of crystals has also been explored through crystallization 79
experiments of molten lavas (e.g., Ryerson et al. 1988; Pinkerton and Norton, 1995; Sato, 80
2005; Ishibashi and Sato, 2007; Vona et al., 2011; Vetere et al., 2013; Sehlke et al., 2014; 81
Soldati et al., 2014; Chevrel et al., 2015; Kolzenburg et al., 2016, 2017) and by deformation 82
of natural crystal-rich samples near the glass transition temperature (e.g., Caricchi et al., 2008; 83
Champallier et al., 2008; Cordonnier et al., 2009; Avard and Whittington, 2012; Lavallée et 84
al., 2012, 2007; Vona et al., 2013). The effect of bubbles on crystal-free lava rheology has 85
been investigated using analogue material or theoretically (e.g., Stein and Spera, 1992; Manga 86
et al., 1998; Lejeune et al., 1999; Saar and Manga, 1999; Bagdassarov and Pinkerton, 2004; 87
Rust and Manga, 2002a; Llewellin and Manga, 2005) as well as using bubble-bearing high 88
viscosity silicate melts near the glass transition (Bagdassarov et al., 1994; Bagdassarov and 89
Dingwell, 1993, 1992; Vona et al., 2016). The combined effect of bubbles and crystals has 90
been studied via laboratory experiments on magmas (Bagdassarov et al., 1994; Pistone et al., 91
2016, 2013, 2012; Vona et al., 2017, 2016) and the three-phase theory (Phan-Thien and 92
Pham, 1997; Harris and Allen, 2008). Although laboratory measurements are well controlled, 93
they are not representative of field conditions because of differences in volatile content 94
(dissolved and in the form of gas bubbles), oxygen fugacity and crystallinity changes during 95
heating episodes in the laboratory. To generate realistic models of lava flow advance and to 96
place laboratory measurements in reference to nature, we thus need a basic knowledge of the 97
rheology of the molten mixture itself in its natural setting (i.e., in the field). 98
One method that is commonly used to obtain information on the rheological properties 99
of lavas in the field involves measuring the post-emplacement dimensions of the flows (e.g., 100
Hulme, 1974; Moore and Schaber, 1975; Fink and Zimbelman, 1986; Moore, 1987; Kilburn 101
and Lopes, 1991; Wadge and Lopes, 1991). Most of these studies are based on the assumption 102
that lavas can be approximated as Bingham fluids, and that their flow dimensions are 103
controlled by the yield strength and plastic viscosity. However, post emplacement subsidence, 104
complex lava flow fields and lava flow inflation may induce under- or over-estimation of 105
flow viscosity using this method (e.g. Kolzenburg et al., 2018c). Another method involves 106
measuring the mean velocity of lava in active channels to derive the rheological parameters. It 107
is often assumed that the lava behaves as a Newtonian fluid and the flow has a parabolic 108
velocity profile. In that case, the Jeffreys (1925) equation is applied to calculate the viscosity 109
(e.g., Nichols, 1939; Krauskopf, 1948; Walker, 1973; Rose, 1973; Harris et al., 2004; James 110
et al., 2007). Other studies showed that non-Newtonian flow behavior is preferable and 111
consider a plug-flow model to extract yield strength and viscosity (e.g., Cigolini et al., 1984; 112
Moore, 1987; Harris et al., 2002; Balmforth et al., 2007;). An additional field method can be 113
used when flows undergo super-elevation when they encounter sharp bends in channels 114
(Heslop et al., 1989; Woodcock and Harris, 2006). Unfortunately, there are few situations 115
where this method can be applied. All these methods are based on the whole flow behavior, 116
and therefore, suffer from potentially large uncertainties due to difficulties to measure channel 117
shape, depth, lava density and underlying slope (cf. Hon et al., 2003; Lefler, 2011; Chevrel et 118
al., 2013; Lev and James, 2014; Kolzenburg et al., 2018b). In addition, the calculated 119
properties are not necessarily representative of the viscosity of the material itself but represent 120
the behavior of the flow as a whole (fluid interior plus brittle and viscoelastic crust). 121
Consequently, to constrain the rheological parameters of lava in its natural state, we must use 122
field-based instrumentation. 123
The only way to directly establish lava rheology in the field is to measure it by 124
inserting a viscometer into the flowing molten rock. If this technique is applied down an 125
active channel and is combined with simultaneous temperature measurement and sampling, it 126
is possible to capture the evolution of lava rheology as a function of cooling, degassing and 127
crystallization. However, in-situ viscosity measurements are challenging due to the difficulty 128
of approaching an active lava flow, and the problems of designing equipment that will make 129
reliable measurements under such difficult conditions. Besides, during eruption, lava flows 130
are continuously changing (advancing, cooling, degassing, advecting) therefore the 131
measurement timescales needs to be adapted with the timescale for which the lava is at 132
constant conditions (mainly temperature). This is often a limitation for the measurements 133
because low torques and low deformation rates are difficult to reach due to the fast thermal 134
dynamics. As a result, only a small number of investigators have accepted the challenge of 135
measuring the rheological properties in the field. Their studies are reported here. In this 136
article, we thus review how rheological properties can be measured using field 137
instrumentation. We then collate all field viscometry experiments made to date in 138
chronological order. For each of these eleven cases found, we include a discussion of the field 139
conditions, and instrument description, and review the main results and conclusions. 140
2 Measuring lava rheology in the field
141
2.1 Methods and theory
142
Quantification of rheology is described by the relationship between the applied stress, and the 143
rate of deformation i.e. strain rate. These quantities are measured using a viscometer. There 144
are essentially two types of viscometer that have been used to measure the rheological 145
properties of lava in the field. One measures the resistance to penetration of an object, which 146
moves into the lava, and the other measures the torque required to rotate a shear vane that is 147
immersed in the lava. These viscometers are based on the principle of applying either a stress 148
or a strain rate while measuring the response either of the strain rate or the stress. When using 149
a rotational viscometer, the shear strain rate is a function of the rotation rate and the geometry 150
of the vane. For a penetrometer it is a function of the penetrometer head shape and the axial 151
penetration rate. Shear stress is a function of the torque acting on the rotating spindle or the 152
force acting on the penetrating head. If the rotational viscometer or penetrometer has the 153
ability to vary the speed of rotation or penetration, or the applied force, a graph of strain rate 154
versus stress can be constructed to produce, following the term given by Lenk (1967), “flow 155
curves”. Depending on the lava properties being measured, one of the following rheological 156
models can be fitted to the data (see Chapter 5 in Chester et al., 1986). All parameters used 157
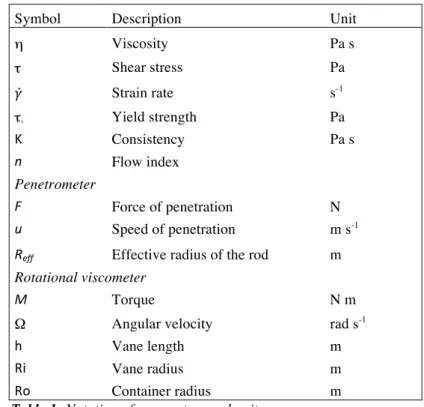
for the following equations are given in Table 1. 158
For Newtonian behavior, the strain rate (𝛾) is directly proportional to shear stress (𝜏). The 159
proportionality coefficient is the viscosity (η) and is defined by: 160
Bingham behavior is identified when a minimum stress (i.e., the yield strength, τ0) needs to
161
be overcome before deformation occurs. In that case, once the yield strength is overcome, the 162
strain rate is proportional to shear stress. The proportional coefficient is the consistency (K), 163
otherwise termed the Bingham or plastic viscosity. This is defined via: 164
𝜏 = 𝜏!+ 𝐾𝛾 (2)
When strain rate is not proportional to shear stress, and the lava has no discernible yield 165
strength, the material is best characterized as a power law flow, defined as: 166
𝜏 = 𝐾𝛾! (3)
where, if n, the flow index, equals unity this reduce to the Newtonian case (Eq.1 ). 167
The last rheological model used to describe lava behavior, is when a minimum stress is 168
present and once it is overcome the shear stress follows a power law with strain rate. This is 169
termed the Herschel-Bulkley model and described by: 170
𝜏 = 𝜏!+ 𝐾𝛾! (4)
For all fluids, the value of n in Eqs. 3 and 4, is evaluated graphically or numerically from the 171
experimentally determined values of strain rate and shear stress. When n > 1, the fluid is 172
dilatant (also termed shear thickening), i.e. viscosity increases with strain rate. Evidence for 173
this behavior has been found in dykes (Smith, 1997, 2000), but has yet to be encountered in 174
flowing lava. When 0 < n < 1, the material is thinning with deformation, so that viscosity
175
decreases with strain rate. In that case, the fluid follows a pseudo-plastic behavior. After a 176
few percent of crystallization, it has been recognized that lavas preferentially follow this 177
behavior (Pinkerton and Stevenson, 1992). 178
2.2 Instrumentation
179
2.2.1 Penetrometers
180
There are three types of penetrometer. A “simple” penetrometer is based on a penetrometer 181
used for measurement of soil physical properties (Lunne et al., 1997) and is basically a metal 182
rod, with a semi-spherical head, pushed into the lava. Penetrometers can be used to measure 183
yield strength by establishing the minimum force required to initiate movement (Pinkerton 184
and Sparks, 1978) or can be used to estimate viscosity by inserting the rod into the lava at a 185
given constant force and recording the speed of penetration (Einarsson, 1949, 1966; Gauthier, 186
1973; Pinkerton and Sparks, 1978; Panov et al. 1988; Belousov and Belousova, 2018). Using 187
a semi spherical penetration head and assuming that the potential effect of lava sticking to the 188
rod is negligible, the viscous drag is equal to half of Stokes’ force acting on a sphere 189
penetrating through a viscous medium (Panov et al., 1988; Belousov and Belousova, 2018). 190
The lava viscosity is then calculated via: 191
𝜂 = 𝐹
3𝜋 𝑢 𝑅!""
(5) where F is the force of penetration (viscous drag), u is the speed of penetration, and Reff is the
192
effective radius of the rod. The force is recorded by a hand gauge and the velocity is measured 193
from the penetration depth and time to reach that depth. This results in a single viscosity 194
measurement point, which is averaged over the duration of penetration. For a given 195
penetration depth the viscosity may then be obtained from prior calibration (Einarsson, 1966, 196
1949; Gauthier, 1973; Pinkerton and Sparks, 1978). 197
The second type of penetrometer is termed “ballistic” penetrometer as used by 198
Gauthier (1971, 1973). This technique involves shooting a spear at high-speed 199
perpendicularly into the lava and measuring its penetration depth. The viscosity is then 200
calculated based on previous laboratory calibrations using the same spear on various liquids 201
of different viscosities. The high initial penetration velocity prevents lava advance rates from 202
influencing the measurement and limits cooling of the lava around the spear during 203
penetration. The major disadvantage of such penetrometers is that they are inserted through 204
the outer, cooled part of a flow, thus the force required to penetrate the lava is the result of a 205
summation of shear stresses induced within the thickness penetrated, the major resistance to 206
shearing being due to the more viscous outer (crusted) regions. This penetrometer thus tends 207
to give a semi-quantitative measurement of the shear strength of the cooler exterior of a flow, 208
and little indication of the rheological characteristics of the hot interior. 209
This problem can be overcome using a third type of penetrometer that is first 210
preheated and inserted through the cooled outer regions before being activated, so only the 211
nose of the penetrometer that had been placed into the flow interior is moved forward 212
(Pinkerton and Sparks, 1978). This instrument used a compressed spring as the energy source 213
for penetration. The controlled reduction in axial force during penetration was recorded, 214
together with the simultaneous piston advance rates. This type of dynamic penetrometer 215
permitted the shear stress - strain rate characteristics of the lava to be determined using the 216
method outlined in Pinkerton (1978). 217
219
Symbol Description Unit
η Viscosity Pa s τ Shear stress Pa 𝛾 Strain rate s-1 το Yield strength Pa K Consistency Pa s n Flow index Penetrometer F Force of penetration N u Speed of penetration m s-1
Reff Effective radius of the rod m
Rotational viscometer
M Torque N m
Ω Angular velocity rad s-1
h Vane length m
Ri Vane radius m
Ro Container radius m
Table 1: Notation of parameters and units
220 221
2.2.2 Rotational viscometer
222
Rotational viscometers involve a rotating spindle immersed into the molten lava. Two types 223
of rotational viscometer have been employed in the field: a fixed rig sited on the top of a lava 224
lake (Shaw et al., 1968) and a portable instrument inserted by hand through the flow surface 225
and into the lava interior (Pinkerton, 1994; Pinkerton et al., 1995a, 1995b; Pinkerton and 226
Norton, 1995; Chevrel et al., 2018a). In use, the spindle can be operated in either controlled 227
strain rate or controlled shear stress mode. The theory employed with this instrument is that of 228
wide-gap concentric cylinder viscometry where the torque is converted into shear stress and 229
the rotational speed into strain-rate using the spindle geometry via the Couette theory, which 230
is similar to the theory used for the laboratory viscometers described in Dingwell (1986) and 231
Spera et al. (1988). Unlike most laboratory experiments where the immersed spindle is 232
cylindrical, vane geometry is commonly used in the field to lower the weight, ease 233
penetration, reduce disturbance of lava during insertion, minimize the effects of cooling and 234
reduce slippage between the edge of the vane and the lava. The material between the vanes is 235
trapped and therefore a virtual cylinder of sample material is used for the calculation. The 236
shear stress is then calculated via: 237
𝜏 = 𝑀 2𝜋ℎ𝑅!!
(6) where M is torque, h is vane length and Ri is the radius of the rotating cylinder (or equivalent
238
radius of the vane). The strain rate is obtained from the angular velocity of the rotating vane 239
via (Stein and Spera, 1998): 240 𝛾 = 2Ω 𝑛 1 − 𝑅! 𝑅! ! ! (7)
where Ω is angular velocity, n is flow index (obtained by calculating the slope of the 241
measured ln(τ) against ln(Ω)), and Ro is the radius of the outer cylinder.
242
3 Review of lava viscometry experiments in the field
243
3.1 An iron rod thrust into the lava by Einarsson (1949) at Hekla, Iceland
244
While observing lava emplacement on Hekla in 1948, Einarsson quickly realized that the lava 245
presented interesting changes in vesicularity, temperature, crystallinity and apparent viscosity 246
(Einarsson 1949). To measure viscosity, he used a simple iron rod and thrust it by hand into 247
the lava. Einarsson applied a force on the rod manually and measured the time needed to 248
penetrate the lava. From a qualitative approach, he could “feel” different behaviors. The most 249
fluid lava allowed him to push the iron rod in with one hand, which reached depth of 20 to 30 250
cm in one or two seconds. In the most viscous lava, he could thrust the rod only 2-3 cm into 251
the flow (also in 1 to 2 s) and this was achieved by putting his whole body weight onto the 252
rod. To quantify viscosity, back into the laboratory, Einarsson established a relationship 253
between viscosity and velocity of penetration from repeated measurements using the iron rod 254
plunged into a hot mixture of Trinidad asphalt and asphalt oil. He estimated the viscosity of 255
the lava at Hekla to be between 5 × 10⁴ Pa s and 1.5 × 10⁶ Pa s, and he estimated an error of 256
about half order of magnitude. The erupted lavas were basaltic-andesite (55 wt.% SiO2) and
257
were described as ’a’ā to block type. The maximum temperature was estimated using an 258
optical pyrometer as 1150°C (Einarsson 1949). Analyses of the lava texture revealed that the 259
low viscosity values corresponded to “spongy, uncrystallized fluid”, while the high viscosity 260
value corresponded to denser lava. Einarsson (1949) concluded that accurate measurements of 261
viscosity using this technique on this type of lava are difficult because of the lack of time 262
available to make instrumental measurements and because of hazards arising from blocks 263
falling from the steep rubbly flow margin and high radiant heat. In 1961, Einarsson intented 264
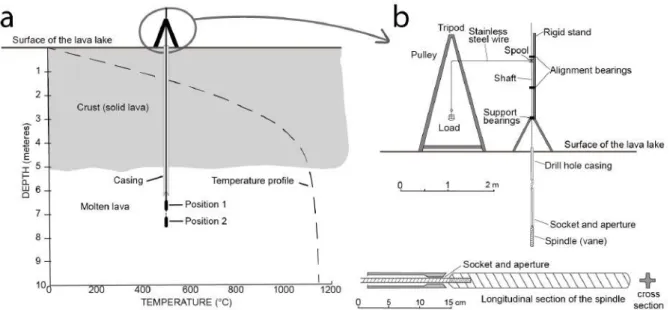
to measure the lava viscosity at Askja (Iceland; Fig. 1a) but no data were recorded. 265
266
Figure 1: a) Einarsson holding the penetrometer in one hand and a shield in another hand, advancing toward
267
the lava flow during Askja (Iceland) eruption in 1961 (photo modified from Solbnes et al. 2013). b) Pinkerton
268
using the penetrometer Mark 2 on a small channelized ‘a’ā flow of Mont Etna (Italy) in 1978 (sketch modified
269
from Pinkerton and Sparks, 1978). c) Belousov using a lava-penetrometer equipped with a dynamometric gauge
270
on a pāhoehoe lobe during the Tolbachik (Russia) eruption in 2013 (modified from Belousov and Belousova
271
2018).
272
3.2 Viscosity measurement at Surtsey, Iceland, by Einarsson (1966)
273
During the Surtsey eruption in 1964, Einarsson measured the viscosity of the flowing lava 274
using the same approach as he applied at Hekla in 1948 (Einarsson 1966). Einarsson 275
mentioned that this time the measurements were difficult to perform because the lava was too 276
fluid. Because the penetrometer was pushed by hand, it was difficult to regulate the force of 277
penetration to a minimum in order to measure the resistance of the fluid lava. After several 278
attempts, Einarsson estimated that the penetrometer moved 10 cm vertically into the lava at 279
the front of a lava lobe under its own weight in 0.5 s from which he obtained a viscosity 280
estimation of 5 × 10² Pa s. Einarsson noticed that this value was lower than expected because 281
he estimated viscosity at 103 Pa s from lava wave amplitudes in the lava lake located over the 282
vent. This underestimation was attributed to the “foamlike” texture of the lava. At that time, 283
Einarsson therefore sensed the potential effect of bubbles on lowering lava viscosity. The 284
samples of spatter that he collected showed about 45 vol. % of vesicles and 40 vol. % of 285
crystals (feldspar and olivine). The maximum temperature measured in the field with an 286
optical pyrometer was 1140 °C. Given these thermal and textural characteristics, a viscosity 287
value of 5 × 10² Pa s seems, therefore, appropriate. 288
3.3 Viscosity measurements performed by Shaw et al. (1968) at Makaopuhi lava lake,
289
Hawaii
290
Shaw et al. (1968) used the rotational viscometry method to determine the rheological 291
properties of lava at Makaopuhi lava lake in March 1965. Makaopuhi lava lake formed in 10 292
days by eruption of lava into a pit crater forming an 85 m deep and 800 m wide “pond”, and 293
after which the surface became stable and the upper part began to solidify. When the crust 294
reached a thickness of 2 m, cores were drilled periodically for temperature measurements and 295
lava sampling, as described in Wright and Okamura (1977). The viscosity measurements were 296
performed using one of the drill holes once the crust reached a thickness of about 4 m. The 297
experimental setup consisted of a support stand fixed on the top of the solidified lava lake 298
surface. A shaft, with a vane attached to its lower end, was suspended from the stand and 299
lowered vertically into the lava (Fig. 2). A casing was employed allowing the shaft to reach 300
the molten lava at the bottom of the cooled crust, where the temperature reached its maximum 301
(Fig. 2). A wire was spooled to the shaft, passed through a pulley and attached to a load, 302
permitting the shaft to rotate. In this way, by changing the load weight, different torques were 303
applied to the rotating vane. Flow curves were obtained by measuring the resulting rotational 304
speed (using stopwatches). The setup had been previously calibrated using petroleum asphalt 305
and uncertainties of 20 % on the viscosity were obtained. In the field, four different loads 306
were applied at two different depths (position 1 at 6.8 m and position 2 at 7.5 m) using the 307
same vane (Fig. 2). The temperature was measured at 1130 ± 5°C and sample analyses 308
revealed < 5 % vesicles and 25 % of crystals. Viscometry results indicated that the lava was 309
non-Newtonian and thixotropic, which means that they observed a hysteresis between values 310
acquired during increasing and decreasing load (“up” and “down” curves, i.e. the “down” 311
stress-strain-rate path does not match the “up” path). Considering the up-curves, Shaw et al. 312
(1968) established that the Bingham model was the most appropriate to fit their data. They 313
estimated the yield strength to be 120 and 70 Pa, and obtained a plastic viscosity of 6.5 × 10² 314
and 7.5 × 10² Pa s, for positions 1 and 2, respectively over strain rates 0.1 – 1 s-1. These 315
compare with values of 80 to 115 Pa s obtained for the lake interior by Wright and Okamura 316
(1977) by applying Stokes’ Law to olivine crystal setting; the difference is likely due to the 317
latter estimate being for melt only and the former for a melt-crystal mixture. A re-analysis of 318
the Shaw et al. (1968) data suggested that no yield strength was present and that power law 319
models in the form of 𝜏 = 974 𝛾!.!" and 𝜏 = 716𝛾!.!" provided a better fit with positions 1 320
and 2, respectively (Heslop et al., 1989). 321
322
323
Figure 2: Set-up of the viscosity measurements performed by Shaw et al. in 1968 at Makaopuhi lava lake,
324
Hawaii. Modified from Shaw et al. 1968. a) Schematic view of the stand fixed onto the top of the solidified lava
325
surface (thickness of the crust was of about 4-5 m at that time) showing the two positions where measurements
326
were performed and the temperature profile; b) zoom of the rotating viscometer devise and spindle.
327 328
Shaw et al. (1968) also performed a falling sphere experiment. This experiment 329
consisted of a steel sphere attached to a fine stainless steel wire that passed through the same 330
casing used for the rotational viscometer. The sphere was released into the lava at its hottest 331
part and the movement of the wire behind the descending sphere provided information to 332
calculate the viscosity. However, they obtained only one measurement because in all other 333
attempts the wire broke before a measurement was taken. The apparent viscosity they 334
obtained via Stokes Law was 6 × 10⁴ Pa s for a strain rate of 0.004 s-1. Although this is larger 335
than values calculated using the power law models, it is consistent with pseudo-plastic 336
behavior. 337
These pioneering viscosity measurements are of uncontestably good quality. However 338
the technique employed is appropriate only for stable lava lake with a thick crust. 339
Employment beyond such a setting is therefore limited. 340
3.4 A shooting spear to measure lava viscosity on Mount Etna, Italy, by Gauthier
341
(1973)
342
During the eruption of Mount Etna between 1969 and 1971, Gauthier (1971, 1973) performed 343
viscosity measurements using a crossbow to fire a ballistic penetrometer (a stainless steel 344
spear), into the lava flow. The penetrometer had an initial speed of 22 m/s. Based on 345
calibration, viscosity is determined from the final depth of penetration. The relation between 346
viscosity and penetration depth was established from laboratory experiments on materials 347
with different viscosities. The penetration depth was directly read from graduations on the 348
spear. In May 1971, Gauthier performed three sets of measurements. The first set was 349
completed during the first phase of the eruption at the lava flow front, 500 m from the vent. 350
Here, the viscosity was measured to be ~ 1 × 10³ Pa s and the temperature was 1050 °C.
351
Measurements on several incandescent blocks yielded ~ 2.2 – 5.7 × 10³ Pa s at a temperature 352
of 1080 °C. For other blocks, where the surface viscosity was clearly higher, estimates of 353
more than 107 Pa s were obtained for the outer few centimeters, ~ 4.3 × 10³ Pa s at 13 cm and 354
~ 8.5 × 10² Pa s at 33 cm. The second set of measurements, completed at the end of the first 355
eruptive phase at the vent resulted in a viscosity of ~ 1.1 – 6.3 × 10⁵ Pa s at a temperature of 356
1090 ± 14 °C. The third set of measurement was made at the beginning of the second eruptive 357
phase near the vent. Here, a temperature of 1128 °C and viscosity of ~ 1.7 - 2.4 × 10³ Pa s 358
was measured. A sample collected near the vent from a depth of 50 cm was analyzed. The 359
lava was a trachy-basalt with 44.6 vol.% of crystals, 22.8 vol.% of glass and 32.6 vol.% of 360
bubbles. 361
Although viscosity values were obtained from these measurements, Gauthier (1973) 362
concluded that “the objections to this method do not arise from difficulties of its application 363
in the field conditions, but from rheological interpretation of the length of penetration”. 364
Indeed, although the calibration fluids used in the laboratory had a vertical viscosity gradient 365
between the upper layer and the material core, they did not represent the same gradient as 366
natural lava. In other words, it was extremely difficult to calibrate the method by using a 367
similar viscous gradient to that found in a lava flow. 368
Gauthier (1971) also designed a simple penetrometer, which included a dynamometric 369
gauge and a thermocouple at the rod end. This instrument, when associated with video 370
footage, would allow measurement of the temperature of the lava and its viscosity as deduced 371
from the rate and depth of penetration. He believed that this rather simple and light-weight 372
method was well adapted for fieldwork. Unfortunately, it was never built. 373
3.5 Field measurements of rheology of lava by Pinkerton and Sparks (1978) at Mount
374
Etna, Italy
375
Pinkerton and Sparks (1978) deployed three instruments to characterize the rheological 376
properties of the lava flows erupted at Mount Etna during the 1975 eruption. The most 377
sophisticated was the “Mark 2” field viscometer. The Mark 1 was considerably heavier than 378
the Mark 2 and was used only once during the 1973 eruption on Heimay—with limited 379
success. It had two large (~100 mm diameter) pistons moving out of an even larger cylinder 380
that was inserted into the flow. It was extremely cumbersome and difficult to use, and 381
preheating it was a major issue. However, parts of the Mark 1 instrument were used in the 382
construction of the Mark 2. 383
The Mark 2 instrument was designed to overcome the problems with previous 384
penetrometer methods. The penetrometer’s head was protected from the cooler crust through 385
which it passed by an outer stainless steel tube. Once it had passed through the thermal 386
boundary layer and reached thermal equilibrium with the surrounding lava, it was propelled 387
into the flow by a compressed spring. This resulted in a gradually decreasing axial force being 388
applied and hence a decreasing shear stress being applied to the isothermal region adjacent to 389
the advancing piston (Fig. 1b). The position of the piston and hence velocity was recorded 390
using a hot wire pen recorder. On each occasion that the viscometer was used, the piston did 391
not extend fully, indicating that the lava had a measurable yield strength. Prior to field 392
deployment, the instrument had been calibrated in a viscous sucrose solution. The method 393
used to calculate the rheological properties is detailed in Pinkerton (1978). This first 394
instrument was employed 3 m down flow from the active vent. Measurements were made at a 395
depth of 20 cm where the temperature was 1086 ± 3 °C and the crystallinity of the flow 396
interior was 45 vol.%. More than 20 data points were obtained for shear rates < 0.15 s-1. The 397
results indicated that the lava behaved in a pseudo-plastic manner, though it could be 398
approximated to a Bingham fluid at the applied shear rates. The best fit revealed a yield 399
strength of 370 ± 30 Pa and a plastic viscosity of 9.4 × 10³ ± 1.5 × 10³ Pa s. 400
The second instrument employed was a conventional penetrometer, which comprised a 401
2 m long, 3 cm diameter stainless steel rod. A pressure transducer allowed the axial force 402
during insertion to be measured. This instrument was used in a dynamic mode by measuring 403
the time taken by the pre-heated penetrometer to move 10 cm when inserted into the flow 404
interior under a range of applied axial forces. Methods used to calibrate this instrument and to 405
calculate rheological properties were similar to those used for the Mark 2 viscometer 406
(Pinkerton, 1978). One apparent yield strength measurement of 860 Pa was made at the same 407
point as the Mark 2 viscometer. This value is higher than the previous measurement due to 408
shear along the length of the shaft in contact with the outer thermal boundary layer and 409
confirms the limitations of simple penetrometers. Another yield strength measurement made 410
at a depth of 10 cm inside an advancing flow front was 6500 Pa at a temperature of 1045 °C. 411
The final instrument used was a stainless steel shear vane attached to a torque wrench 412
that allowed yield strength to be measured by slowly applying torque until the shear vane 413
began to rotate. The vane was preheated to lava temperature and inserted into the isothermal 414
core to avoid the effects of the cooler flow margins. To minimize the effects of shearing by 415
the cooler flow on the shaft, a ‘dummy end’ was used at each location. Additionally, the 416
measured torque required to initiate movement of the shaft at the same immersion depth 417
without the vane was subtracted from the torque with the vane attached. This instrument was 418
used at eight locations on two lava flows at different distances from the vent. The results 419
indicated that the yield strengths measured using the torque wrench were compatible with the 420
values obtained with the Mark 2 viscometer. Values increased from 6.05 × 10² Pa at 1083 °C, 421
close to the vent, to 1.4 × 10³ Pa at 1080 °C, 7 m down flow and 2 × 10³ Pa at 1070 °C, 24 m 422
down flow from the vent. These measurements demonstrate the potential to make systematic 423
measurements down an active flow. 424
3.6 Simple penetrometer employed at Klyuchevskoy, Russia, by Panov et al. (1988)
425
During the 1983 Predskazannyi eruption at Klyuchevskoy volcano, Panov et al. (1988) 426
employed a simple penetrometer (Panov et al., 1985 in Russian, later translated into English 427
by Panov et al., 1988). The instrument was a steel pole, 14 mm in diameter and 2 m long, 428
with a rounded end. Viscosity was estimated from the measurement of the speed at which the 429
rod penetrated the lava under a known force and by assuming that the viscous drag was equal 430
to half of Stokes’ force (Eq. 5). In practice, the penetration speed was measured from the time 431
interval between the submersion of marks noted on the rod. The force acting on the rod was 432
the combined weight of the rod itself and the muscular effort applied. The rod was not pre-433
heated, therefore when it was plunged into the lava a chilled margin formed around it. To 434
correct for this effect, Panov et al. (1988) added 1 to 2 mm to the rod diameter for the 435
calculation of viscosity. During measurements, the penetration rate did not change under 436
constant applied force, independently of the depth of penetration. The viscosity was measured 437
to be between 1.1 × 10⁴
Pa s and 3.6 × 10⁵
Pa s. No systematic variation was observed with 438
distance from the vent to the measurement location (15 to 35 m). Panov et al. (1988) noticed 439
the similarity (within an order of magnitude) of the penetrometer results with estimation of 440
viscosity obtained using the Jeffreys (1925) equation. No data on the lava chemistry and 441
crystal and bubble content was given. 442
3.7 Vane rotated by hand to measure viscosity of Mount Etna 1983 lava flow by
443
Pinkerton and Norton (1995)
444
Pinkerton and Norton (1995) presented results of viscosity measurements performed during 445
the eruption of Mount Etna in 1983. These viscosity measurements were performed using a 446
rotating vane system on a breakout from the main channel where the measured temperature 447
was 1095 °C. The vane was pre-heated and then inserted into the lava and rotated at different 448
rates by hand (Fig. 3a). The system was equipped with a torque meter to measure the torque 449
required to rotate the vane and rotation speeds were monitored with an optical tachometer. 450
Four data points were acquired before the lava began to develop an impenetrable crust. In 451
view of the limited range of rotation rate (5 – 9 rad/s), no unique rheological model could be 452
applied. Assuming Newtonian behavior, the viscosity was calculated to be 1.385 × 10³ Pa s.
453
Applying a Bingham model, the yield strength was 3.7 × 10² Pa with a plastic viscosity of
454
1.26 × 10³ Pa s and at unit strain rate the apparent viscosity is 1.63 × 10³ Pa s. This range of
455
values was consistent with those measured in the laboratory on melted samples from the same 456
lava flow (Pinkerton and Norton, 1995, 1983). The lava was a trachy-basalt but unfortunately 457
crystal and bubble content was not given. However, field viscosity values are in close 458
agreement with those measured at the same temperature in the laboratory at for crystal content 459
between 30 and 40 vol. %. 460
461
Figure 3: Rotational viscometers: a) Pinkerton taking rheological measurements in 1983 at Mount Etna using a
462
manual shear vane (Chester et al., 1986) ; b) Pinkerton in 1988 at Oldoinyo Lengai using the first motor-driven
463
shear vane (Pinkerton et al. 1995); c) Pinkerton et al. (1994) at Kilauea holding the new version of the
motor-464
driven rotational viscometer: d) Chevrel et al. (2018b) using the refurbished viscometer in 2016 at Kilauea. e)
465
Schematic representation of the refurbished viscometer, modified from Chevrel et al. (2018b)
466 467
3.8 Portable rotational viscometer to measure the viscosity of carbonatite at Oldoinyo
468
Lengai, Tanzania, by Pinkerton et al. (1995a)
469
Rheological field measurements performed in November 1988 on natrocarbonatite lavas at 470
Oldoinyo Lengai by Pinkerton et al. (1995) (Fig. 3b) were made using a motor-driven version 471
of the equipment used on Etna in 1983. A 24-V DC Bosch drill was used to drive a vane at 472
different, constant, rotation rates, which were measured using an optical tachometer. Torques 473
corresponding to different rotation rates were measured using a torque meter that was 474
mounted coaxially between the drive mechanism and the vane. This set of measurements 475
revealed that the vesicle-free natrocarbonatite lavas behaved as inelastic Newtonian fluids 476
with viscosities ranging from 1 to 5 Pa s. In contrast, highly vesicular lavas had apparent 477
viscosities of 0.7 – 1.2 × 10² Pa s at a strain rate of 1 s-1 and apparent viscosities of 0.3 – 3 Pa 478
s at a strain rate of 3 s-1. These measurements were slightly higher than those measured 479
subsequently in the laboratory by Norton and Pinkerton (1997) who concluded that these 480
differences arose from differences in vesicularity and volatile contents between laboratory 481
and field measurements. 482
3.9 Portable rotational viscometer to measure the viscosity of pāhoehoe lobes at
483
Kilauea, Hawaii, by Pinkerton et al. (1995b)
484
Pinkerton (1994) and Pinkerton et al. (1995b) performed rheological measurements on small 485
pāhoehoe lobes erupted at Kilauea in September 1994 using a new rotational portable 486
viscometer based on the prototype employed at Oldoinyo Lengai. The viscometer was driven 487
by a 24-V DC Bosch drill motor connected to a (15:1) reduction gearbox, a torque limiter and 488
a torque-rotation rate sensor (Fig 3c). The sensor (DORT Optical rotary torque transducer 489
from Sensor Technology Ltd) was linked via a transducer to a data logger. After each set of 490
measurements, raw rotation rate and torque data were downloaded to a laptop and later 491
processed with custom software. The main drive shaft was protected from the cooler outer 492
layer of the flow by an outer tube with bearing assemblies (containing graphite rings to 493
minimize friction) at regular intervals. This helped to maintain alignment of the inner shaft. 494
Three pāhoehoe lobes (20 to 50 cm thick) were measured, each of which had maximum 495
internal temperatures of 1146 °C. All lavas measured had properties that could be 496
approximated by a pseudoplastic power law model with plastic viscosity ranging from 2.3 to 497
5.5 × 10² Pa s and with corresponding power law exponents of 0.77 and 0.53, respectively. 498
Pinkerton et al. (1995b) concluded that the higher viscosities resulted from lava with higher 499
crystallinity and bubble content, but quenched samples collected following each measurement 500
were not analyzed until the present study when one sample was analyzed (see appendix). The 501
lava can be classified as porphyritic basalt with 4 vol.% of olivine phenocrysts and 12 vol.% 502
of microlites (olivine + plagioclase + clinopyroxene) within a glassy matrix (55.1 wt. % SiO2
503
and Mg # = 48). The vesicle content was measured at 34 vol. % from image analyses and 504
from density-derived measurements. The viscosity of the interstitial liquid was calculated 505
from the glass composition (including 0.07 wt. % H2O) using the model of Giordano et al.
506
(2008) at 1146 °C. The effect of crystals and of bubbles on viscosity was estimated following 507
the methods of Mader et al. (2013) and Llewellin and Manga (2005), respectively. 508
Considering deformable bubbles (capillary number >1 for the strain rates applied during the 509
measurements), the viscosity is estimated at 3.5 × 10² Pa s, which is in agreement with the 510
field measurements at unit strain rate. Unfortunately no other sample could be analyzed to 511
examine whether from one lobe to another the texture was different so as to explain the range 512
of viscosities measured. 513
3.10 Viscometry using a simple penetrometer on pāhoehoe lobes at Tolbachik, Russia,
514
by Belousov and Belousova (2018)
515
In 2013, during the Tolbachik eruption, Belousov and Belousova (2018) performed viscosity 516
measurements on several pāhoehoe lobes using a simple penetrometer (Fig. 1c) based on the 517
method of Panov et al. (1985). In these experiments, Belousov and Belousova measured 518
penetration rate of the rod as it passed through the pāhoehoe lobe producing a viscosity 519
profile from the lobe top to the base (a distance of 10 to 25 cm). The speed of penetration was 520
measured via video footage where marks on the penetrometer were tracked on each frame. 521
The force of penetration was applied manually and recorded using a spring balance. Repeated 522
measurements on each lobe and/or neighboring lobes (about 20 in total) gave interior 523
viscosities between 5 × 10³ and 5 × 10⁴ Pa s. The viscosity of the upper and basal section of 524
the lobes was measured as high as 6 × 10⁴ to 4 × 10⁵ Pa s. Measurements performed at 525
various distances from the vent resulted in constant viscosity. The 'a'ā flow type could not be 526
measured because of the impenetrable crust. Where the measurements were performed, 527
maximum temperatures of 1082 °C were recorded with a K-type thermocouple at depths of 528
several centimeters. The authors did not sample the lava at the moment of the measurements, 529
but reported the chemical and textural analyses of previous studies. The lava was sub-aphyric 530
basaltic trachyandesite (52 wt. % SiO2) with 25 to 43 vol.% of crystals (mainly plagioclase
531
and olivine) and 6 vol.% of vesicles (Plechov et al., 2015). Plechov et al. (2015) estimated the 532
lava viscosity at 0.9 – 2.8 × 10³ Pa s from chemical and textural characteristics. They used the
533
model of Bottinga and Weill (1970) at 1100 °C for the melt viscosity and the Einstein-Roscoe 534
model for the effect of crystals. As noted by Belousov and Belousova (2018), this estimate is 535
in good agreement with their field viscosity measurements of the most fluid part of the 536
pāhoehoe lobes. Recently, Ramsey et al. (2019) also estimated the viscosity from textural and 537
chemical data given by Plechov et al. (2015) but using Giordano et al. (2008) for the 538
interstitial melt viscosity at 1082°C. This revealed a slightly higher viscosity of 1.9 × 10⁴ Pa s, 539
which is in better agreement with the Belousov and Belousova (2018) measurements. 540
3.11 Portable rotational viscometer to measure the viscosity of pāhoehoe lobes of the
541
61G lava flow at Kilauea, Hawaii by Chevrel et al. (2018b)
542
In 2016, Chevrel et al. (2018a) used the same instrument as Pinkerton et al. (1995b) but it 543
was refurbished and equipped with a different torque sensor (TORQSENSE E300 from 544
Sensor Technology Ltd), communication system and new vanes. Tests in the laboratory using 545
a calibrated viscosity standard, showed that the instrument could measure absolute viscosity 546
with less than 5 % error, but was limited to strain-rates > 0.6 s-1
and torque measurements 547
above 3 × 10² Pa. Chevrel et al. carried out measurements on pāhoehoe lobes from the 61G
548
lava flow of Kilauea’s Pu’u ‘Ō‘ō eruption (Fig. 3d). A Newtonian viscosity of 3.8 × 10² Pa s
549
was measured for strain-rates > 1 s-1
and at 1144 °C. No yield strength was measured 550
indicating that yield strength, if present, must be below the 300 Pa measurement limit of the 551
device. In contrast to Pinkerton et al. (1995b), low strain rates could not be measured (due to 552
torque sensor sensitivity). The data could be fitted with a power law model of the form 553
𝜏 = 424 𝛾!.!! but with a low fit coefficient of 0.79. Chevrel et al. also collected samples by 554
quenching the lava attached to the share vane and completed textural and petrographic 555
analyses, which allowed quantification of the effect of each phase on viscosity. The viscosity 556
of the interstitial liquid was calculated from the glass composition (including 0.07 wt. % H2O)
557
using the model of Giordano et al. (2008). The effect of crystals (16 vol. %) and of bubbles 558
(50 vol. %) on viscosity was estimated following the methods of Mader et al. (2013) and 559
Llewellin and Manga (2005), respectively. Considering deformable bubbles (capillary number 560
was calculated > 1), the results gave a viscosity of 2.2 × 10² Pa s, in agreement with the field
561
measurements. Considering the bubbles to be rigid spheres resulted in an overestimation of 562
the viscosity by one-to-two orders of magnitude. 563
4 Discussion
564
4.1 Field viscometers
565
Penetrometers have been employed to measure lava’s rheological properties from the 566
first published measurement by Einarsson (1948) until recently (Belousov and Belousova, 567
2018). This instrument has been favored because it is light, easy to build (it consists of a rod 568
equipped with a dynamometric gauge) and permits quick estimates of the lava viscosity 569
within a wide range (103
– 106 Pa s; Figure 4). However, as highlighted by Einarsson (1966), 570
the penetrometer is not well adapted for low viscosity lava (<103 Pa s) because it sinks too 571
rapidly into the lava. Additionally, simple penetrometers do not allow rheological flow curves 572
to be calculated because strain rate cannot be varied at the same position (viscosity is 573
estimated from penetration velocity). Furthermore, unless the rod has been pre-heated, or 574
meticulous calibration has been performed with similar condition as in the field (i.e., with a 575
gradient of viscosity due to cooler outer surface), the measurements are often biased by the 576
outer cooler surface of the lava. More sophisticated penetrometers such as the Mark 2 577
employed by Pinkerton and Sparks (1978) can prevent the effect of the cooler lava surface. 578
A falling sphere method was employed by Shaw et al. (1968), and although he obtained 579
a measurement at a low strain rate (0.004 s-1), this method can only be employed on a stable
580
lava lake of sufficient depth, and with a suitable thick crust. Nonetheless this is currently the 581
only way to measure the viscosity of silicate liquids under pressure in the laboratory (Kono, 582
2018). 583
584
Figure 4: Viscosity range measured during field campaigns. The boxes are grey-shaded according to the type of
585
viscometers.
586 587
Rotational viscometry appears to be the most promising approach for field 588
measurement on low viscosity lava (< 104 Pa s; Figure 4). This instrument can apply various 589
strain rates (0.1 – > 5 s-1; Figure 4) that permit the construction of full flow curves (Pinkerton 590
and Norton, 1995; Pinkerton et al.1995b). In 1968, the rotational viscometer set up by Shaw 591
et al. (1968) provided accurate measurements. However it is unsuitable for active lava flows 592
that are in constant motion and often have short-lived instable levées. In 1994, Pinkerton 593
(1994) built the first generation of portable, motor-driven, rotational viscometer. The 594
measurements presented in Chevrel et al. (2018a) showed that this instrument, equipped with 595
a new torque sensor communication system, continues to work well, but has some important 596
limitations. These are 1) it was not possible to achieve low strain rate (< 1 s-1) because of 597
limiting low rotation speeds and 2) this instrument is bulky and heavy (>15 kg) and requires 598
two people to handle it and a third person to monitor the results, which hinders the easy, fast 599
and flexible handling required in the field around an active lava. 600
We suggest that a combination of two instruments, a rotational viscometer for low 601
viscosity range (< 104 Pa s) and a dynamic penetrometer for higher viscosities (103 – 106 Pa 602
s), may therefore be the most appropriate procedure. For lavas with higher viscosity (> 106 Pa
603
s) no field instruments are available for such measurement. Besides, field viscometry will be 604
extremely challenging because such flows are usually ‘a‘ā to blocky with an outer thick 605
fragmented crust that is impossible to approach and penetrate. In addition, the time required to 606
measure viscosity may expose the operator to unacceptable risk from falling blocks. 607
608
4.2 Comparison of the rheological results in different geological settings
609
4.2.1 Hawaiian lavas
610
Using rotational viscometers, the viscosity of Hawaiian lavas measured in the field at 611
temperatures between 1146 °C and 1130 °C, falls within the range 1.5 × 10³ Pa s at strain 612
rates less than 1 s-1 to 2.6 × 10² Pa at strain rates higher than 1 s-1 (Figure 5). The 613
measurements of Shaw et al. (1968) were performed at low strain rate (0.1 – 1 s-1), and 614
although the data were first fitted with a Bingham model, later Heslop et al. (1989) showed 615
that a power law model would be more appropriate. Pinkerton et al. (1995) applied low-to-616
moderate strain rates (0.2 – 3.2 s-1) that also showed the pseudo-plastic behavior of the lava. 617
In contrast, Chevrel et al. (2018a) performed measurements at higher strain rates (>1 s-1) and 618
although they could be fitted with a power law, the Newtonian rheological model provided a 619
better fit at 3.8 × 10² Pa s. The similarity between the collected samples and the viscosities 620
obtained at unit strain rate in 1994 and 2016, using almost the same instrument but 22 years 621
apart, is consistent with the fact that temperature, composition and texture (amount of bubbles 622
and crystals) was similar in the two field studies. These viscosities are lower than the values 623
obtained by Shaw et al. (1968), which is consistent with a higher temperature, lower crystal 624
content and higher content of deformable bubble in the lava from Pinkerton et al. (1995) and 625
Chevrel et al. (2018b). The value obtained by Shaw et al. (1968) using a falling sphere 626
revealed even higher viscosities (> 104 Pa s) at very low strain rates (0.004 s-1). All three data 627
sets suggest a pseudo-plastic behavior of Hawaiian lavas under these conditions (Figure 5). 628
629
Figure 5: Variation of viscosity with strain rate for Hawaiian lavas as obtained from field viscometry. Boxes
630
represent the measured range of viscosity and strain rate and curves are best fits as given by the different
631
studies.
632 633
Among these field experiments at Hawaii, none have directly recorded a yield 634
strength. The estimation of yield strength given by Shaw et al. (1968) was made by fitting the 635
data to a Bingham model. According to laboratory experiments of Hawaiian lavas at 636
subliquidus condition (Ryerson et al. 1988; Sehlke et al., 2014), yield strength may appear 637
with crystallization but should be less than 200 Pa for the crystal content of the lavas 638
measured in the field (< 25 vol. %). Unfortunately, this relatively low yield strength is, to 639
date, difficult, if not impossible, to measure using current field instruments. Further 640
measurements at low shear stresses and low strain rates are needed to determine whether yield 641
strength can develop. Until then a power law model is considered to be the most appropriate 642
model to characterize the behavior of Hawaiian lava at temperatures above 1130 °C (Figure 643
5). 644
The agreement between field measurements and the model-based viscosity using 645
textural and chemical characterization shows our capacity of estimating and measuring three-646
phase mixture viscosity. However, this is only true for a given temperature and only when an 647
exhaustive sample analyses is generated. Further measurements on pāhoehoe lava need to be 648
performed so as to test the sensitivity of viscosity to the effect small thermal, physical of 649
chemical changes within a lava field. 650
4.2.2 Etnean lavas
651
At Mount Etna, measurements were performed on ‘a‘ā type lava flows using different 652
instruments including penetrometers and a manually-operated rotating viscometer (Figure 4). 653
The measured viscosities (either on lava blocks or on channelized lava) range mostly between 654
103 Pa s and 104 Pa s. Gauthier (1973) recorded very high viscosities (> 107 Pa s) using a
655
ballistic penetrometer but these high values are unduly influenced by the cooler outer crust 656
(penetration depth was only 1 cm) and therefore do not represent the flowing lava interior. 657
The viscosities measured by Pinkerton and Sparks (1978) using the Mark 2 penetrometer 658
were higher (9.4 × 10³ Pa s) than those measured by Pinkerton and Norton (1995) using a 659
rotational viscometer (approx. 1.3 × 10³ Pa s). This difference is considered to be a result of a 660
combination of factors, including different eruptive temperatures (1086 °C in 1975 compared 661
with 1095 °C in 1983), different crystal content (45 vol. % in 1975 and < 40 vol. % 1983), 662
and lower strain rates used in 1975 (0 – 0.15 s-1) compared with 1983 (0.7 – 1.4 s-1). 663
Pinkerton and Sparks (1978) measured lava yield strength using various instruments and they 664
found a clear correlation with temperature and consequently crystallinity. 665
Although the rheological properties of Etnean lavas are now well constrained from 666
laboratory experiments (e.g. Pinkerton and Norton, 1995; Vona et al., 2011; Vona and 667
Romano, 2013), there are not enough field measurements to build flow curves under field 668
conditions. 669
4.2.3 Kamchatka and Icelandic lavas
670
The measurements on basaltic-andesite lavas from Klyuchevskoy and Tolbachik 671
showed that the pāhoehoe lobes measured by Belousov and Belousova (2018) have slightly 672
lower viscosities than the ‘a‘ā flow measured by Panov et al. (1988): 0.5 – 5 × 10⁴ Pa s and 673
0.11 – 3.6 × 10⁵ Pa s, respectively. However, the investigation by Belousov and Belousova 674
(2018) at Tolbachik, revealed that the lava traveling within the ‘a‘ā channel was slightly less 675
viscous that the early erupted pāhoehoe lava. This is consistent with some observations at 676
Hawaii, where pāhoehoe flows formed from the rupture of ’a’ā front flow (Hon et al., 2003). 677
In general the Kamchatka pāhoehoe lobes are more viscous than Hawaiian lavas, which is 678
attributed to the lower temperature, higher silica content and higher crystallinity of the former 679
in comparison to the later. 680
Finally, Einarsson (1949; 1966) measured viscosities at Surtsey as low as 5 × 10² Pa s 681
and up to 1.5 × 10⁶ Pa s at Hekla both using the same penetrometer. However the value at 682
Surtsey was challenging to measure, as the rod sank too quickly under its own weight. 683
Unfortunately, there are no other field measurements to compare with. This highlights the 684
need for more data to build flow curves and determine the lava rheological behavior from 685
these field locations in Russia and Iceland. 686
4.3 Future requirements for field viscometry
687
Reducing errors associated with field measurements requires accurate sensors as well 688
as meticulous setup and calibration, which is difficult to achieve in the field where conditions 689
are more complex than in the lab. Field measurements are always constrained by the lava’s 690
thermal dynamics. To reduce the effects of crust formation during measurements the 691
instrument needs to be pre-heated and inserted into fresh molten lava, emerging through 692
breaches in the crust, or at the breaking point of pāhoehoe lobes, where little-to-no crust is 693
present. The time of the measurements then needs to be always shorter than crust formation. 694
Another procedure to minimize the effect of crust formation is to use viscometers like the 695
“Mark 2” (Pinkerton and Sparks, 1978), which allow triggering the sensor once the lava 696
isothermal core is reached. A detailed engineering drawing of the Mark 2 can be found in 697
Pinkerton (1978; Figure 2). Note also that interpretation of the results is non-trivial, but pre- 698
and post- calibration in fluids of different viscosity can be used to validate the results from an 699
analysis of the raw data. Gauthier (1971) proposed a set up similar in sophistication to that 700
used in the laboratory, where the viscometer head would float on the lava surface, protected 701
from radiant heat by a cooling carapace. This would drive a sensitive spindle plunged in the 702
lava. Although this instrument may produce useful data, it would be time-consuming and 703
expensive to build, and there would be a high risk of losing it during utilization in the field. 704
Future viscometers need to be robust, light enough to be carried over rough ground to 705
remote locations, easily mounted and easy to handle, ideally by one person. Additionally, in 706
order to capture the full rheological behavior of lava, viscometers need to apply low strain 707