HAL Id: hal-00810833
https://hal.archives-ouvertes.fr/hal-00810833
Submitted on 23 Apr 2012
HAL is a multi-disciplinary open access
archive for the deposit and dissemination of
sci-entific research documents, whether they are
pub-lished or not. The documents may come from
teaching and research institutions in France or
abroad, or from public or private research centers.
L’archive ouverte pluridisciplinaire HAL, est
destinée au dépôt et à la diffusion de documents
scientifiques de niveau recherche, publiés ou non,
émanant des établissements d’enseignement et de
recherche français ou étrangers, des laboratoires
publics ou privés.
Structural noise and coherent backscattering modelled
with the ATHENA 2D finite elements code
Sharfine Shahjahan, Fabienne Rupin, Thierry Fouquet, Alexandre Aubry,
Arnaud Derode
To cite this version:
Sharfine Shahjahan, Fabienne Rupin, Thierry Fouquet, Alexandre Aubry, Arnaud Derode. Structural
noise and coherent backscattering modelled with the ATHENA 2D finite elements code. Acoustics
2012, Apr 2012, Nantes, France. �hal-00810833�
Structural noise and coherent backscattering modelled
with the ATHENA 2D finite elements code
S. Shahjahan
a, F. Rupin
a, T. Fouquet
b, A. Aubry
cand A. Derode
ca
EDF R&D, Site des Renardi`eres, Avenue des Renardi`eres - Ecuelle, 77818 Moret Sur Loing,
France
b
EDF R&D, 1, Avenue du G´en´eral de Gaulle, 92141 Clamart, France
c
Institut Langevin, 10, rue Vauquelin, 75005 Paris, France
sharfine.shahjahan@edf.fr
The ability to detect and characterize flaws is a key element in the structural integrity and safety program of nuclear operators. Ultrasonic propagation in coarse grain steels is hampered by ultrasonic wave attenuation and high backscattered noise leading to a decrease of the detection and characterization capabilities of common ultrasonic testing techniques. Nevertheless, this structural noise can be considered as a fingerprint of the material as it contains information about its microstructure. Accurate interpretation of experimental data necessitates an accurate comprehension of complex phenomena that occurs in multiple scattering media and thus robust scattering models. In particular, numerical models can offer the opportunity to realize parametric studies on controlled microstructures. However, the ability of the model to simulate the propagation in complex media has to be validated. In this study, the finite element code ATHENA 2D developed by EDF R&D is coupled with a Voronoi tessellation description of the medium. Two different microstructural descriptions of a statistically isotropic bulk material were simulated. The structural noise was characterized by observing the coherent backscattering enhancement (a typical signature of multiple scattering), and by the singular values of the response matrix of the medium. These results were compared to experimental data carried out on nickel based alloys (Inconel 600®)
1
Introduction
Multiple scattering (MS) can occur in polycrystalline materials exhibiting coarse grain structures [1, 2]. Indeed, waves are scattered on grain boundaries that separate misoriented monocrystal. The resulting backscattered noise and attenuation induce a decrease of the signal to noise ratio. As a consequence, the ultrasonic inspection of polycristalline materials represents a challenge for the nuclear industry. Development of numerical simulations helps to better understand wave propagation in complex structures but multiple scattering remains difficult to reproduce numerically.
The finite elements code Athena 2D has been developed by an EDF R&D–INRIA collaboration and is able to simulate complex wave propagation in anisotropic and heterogeneous austenitic welds (beam skewing and/or splitting) with a domain description of the material. Nevertheless, this method cannot reproduce wave attenuation and structural noise. As a consequence, a grain-scale description of the medium is necessary to model scattering at grain boundaries. The computed miscrostructure can be derived from a Voronoï tessellation. A validation of this model requires a comparison with experimental data. Various experimental setups have been proposed in the literature to estimate scattering values [3-9]. Nevertheless, experimental measurements on attenuation or backscattering coefficients remain difficult and do not always provide accurate results [10, 11]. In this work the quantitative comparison between numerical and experimental wave scattering is based on measuring magnitudes extracted from the response matrix of the medium denoted K.
K is measured using the so-called “full matrix capture”
(FMC) technique by means of a multi-element array. The array elements are used both as transmitters and receivers to acquire a full data set of signals from each transmitter-receiver pair [12]. Recently, experiments performed in synthetic scattering media (forests of parallel steel rods immersed in water) demonstrated that when multiple scattering dominates, the probability density function ρ of the singular values of K is well described by a simple law derived from random matrix theory [13, 14]. Considering a coarse grain material as a random medium, in which multiple scattering can occur, this matrix approach is applied here to actual materials like nickel-based alloys (Inconel600®). Another use of the matrix K consists in studying the coherent backscattering (CB) phenomenon. CB is another typical signature of multiple scattering in
random media. It manifests itself as an enhancement in the emission direction of the mean backscattered intensity. It has been observed experimentally, not only in synthetic samples, but also in real materials like rocks or human bones [15-18]. Furthermore in several studies, it has been shown that in adapted configurations, CB measurements can be relevant to characterize different microstructures.
In this paper, experimental and numerical estimations of singular values distribution of K and the CB are compared, as a test of Athena 2D capacity to reproduce multiple scattering phenomena with multi-element arrays.
The first section of this paper briefly describes the general principles: how the probability density function ρ and the CB phenomenon can be obtained from the measurement of K. These two indicators are then applied to polycrystalline media used in the nuclear industry. Experimental studies are performed on Inconel600® blocks exhibiting different grain sizes, and therefore several backscattered noise levels. In the last part, the experimental results are compared to the simulation ones in order to test the ability of the finite element code Athena 2D to reproduce the phenomena related to multiple scattering.
2
The K matrix in the multiple
scattering regime
K is acquired by the FMC technique with an array
probe. The FMC in a backscattered configuration consists in emitting a pulse with a single element and recording the response with all the elements simultaneously [12]. The operation is repeated for the N elements to give N2 time domain responses hij(t) arranged in a matrix H(t). After
truncating H(t) in overlapping time windows of length T, a short-time Fourier analysis and a normalization, for each time T and each frequency f, yield a set of square N×N matrices K(T,f), with complex coefficients. Note that
K=KT in reciprocal media. K contains all the available
information of a medium and its singular values λS play an
important role for time reversal experiments and selective target detection [19].
As long as single scattering can be neglected, Aubry et al. have experimentally proven that K behaves like a classical random matrix [14]. The distribution of its singular values ρ(λS) approaches a simple law derived from
random matrix theory: the “quarter circle” law (Eq. (1)). Thus the occurrence of multiple scattering can be
characterized by comparing ρ(λS) determined in the
polycrystalline medium with the quarter circle law ρQC(λS).
( )
⎪⎩
⎪
⎨
⎧
−
<
<
=
else
everywhere
for
S S S QC,
0
2
0
4
1
λ
2λ
π
λ
ρ
(1)This comparison can be used to validate numerical simulations of a multiple scattering medium.
Moreover, signals from H(t) can also be used to study the coherent backscattering (CB) phenomenon, which is an other typical signature of multiple scattering.
The physical origin of CB lies in constructive interferences between waves following reciprocal paths in multiple scattering media (at least double scattering is required for CB to emerge) [15-18]. CB leads to an enhancement of the intensity reflected in the direction of the emission source and is characterized by a peak whose width is related to the transport properties of the medium, particularly its mean-free path l and diffusion constant D [15-18]. To make a long story short, when the source is close to the medium (near-field), the peak arises after a typical time 2l/c (the time necessary for double scattering to occur) and its typical width is the wavelength. On the contrary, in the far-field (at a distance a >>l), the width of the peak is λa Dt [15-18]. Therefore the existence of CB is not only an indication that multiple scattering takes places, it may also be utilized for characterization purposes
3
Experimental results
3.1 Material and methods
The experimental study was performed on two Inconel600® mock-ups (referenced B1 and B4). This material is purely austenistic and exhibits an equiaxed structure characteristic of isotropic elastic properties. The two blocks were harvested from the same initial forged bar. The first one remained at the reception state (B1) while the second one underwent a specific heat treatment in order to modify the microstructure of the mock-up (B4). Their microstructural characteristics were obtained using metallographic examinations. The estimated mean grain sizes are 90 and 750 µm respectively for block B1 and B4. The characteristics of the two mock-ups are summarized in Table 1.
Table 1: Characteristics of experimental blocks B1 and B4.
Block Dimensions L×W×H (mm3) Ф(µm) Heat treatment λ/Ф B1 280×90×90 90 Reception state 32.5 B4 280×90×90 750 1200°C (4hrs) water cooled 3.9
λ denotes the longitudinal wavelength and Ф is the mean grain size.
The transducer was a 128-element linear array at the frequency Fc=2MHz. For this frequency, in terms of
attenuation the block B4 can be considered in the stochastic
regime whereas the block B1 is in Rayleigh’s regime [20, 21] (see Table 1). The size of the probe element is 1.8×25mm with an array pitch of 2.05mm. The elements are considered as identical and independent. The acquisition of H(t) was carried out with a sampling frequency of 50MHz and with N=64 elements for each mock-up placed in a water tank. Contact configurations were preferred because inspections in nuclear plants are mainly performed with these techniques.
3.2 Singular values of K in Inconel600®
The study of the singular values of K was carried out on block B4, where multiple scattering occurs. The FMC technique using 64 elements of the array provided the response matrix in time domain H(t) which was truncated in overlapping time windows of length T=2µs. A Fourier transform and a normalization provided the matrix K(T,f) for each time T between 5 and 29 µs and each frequency f in the probe bandwidth 1-3MHz.
Figure 1 shows a typical representation of the real part of K. Except the symmetry due to the reciprocity of the medium (kij=kji) the matrix K exhibits an apparently
random behavior.
Figure 1: Real part of K for f =2MHz, T=28µs in block B4. The distribution of the normalized singular values of
K(T,f) denoted ρ(λS) is calculated from the singular values
λS(T,f) and compared with the expected theoretical
distributions (figure 2).
Figure 2: Comparison of singular value distribution. The experimental distribution ρ(λS) is in good agreement
with the quarter circle law representative of random matrices. It confirms that in a coarse grain medium, in this frequency range, K is dominated by multiple scattering contributions. However, significant differences are observed, in particular for singular values greater than 2. A
possible reason for that could be the presence of a weak deterministic single-scattering contribution in K (echoes coming from lateral side of the mock-up for example). Furthermore, it should be noted that the quarter-circle law is an ideal, which only applies when N>>1 [22].
3.3 Coherent backscattering experiments
Experiments in near field conditions were carried out by positioning the array probe in contact with the mock-ups. From appropriated post-processing of the matrix H(t), a virtual sub-array using only M<N elements of the linear array allows to study the backscattered intensity for each block. The central element i is used as the source and all the elements between the positions j=i+(M+1)/2 and j=i– (M+1)/2 are used as receivers. P realizations of the medium are acquired by moving P times the emitter and the receivers by steps of one. In these experiments, M and P are respectively equal to 31 and 20. The array pitch (p=2.05mm) is greater than the mean grain size, thus the P realizations can be considered as independent.
Before computing the mean intensity, each signal was time shifted by a value δtij in order to compensate the
difference of arrival times between receivers. Then the intensity is time-integrated between overlapping windows according to Eq. (2). The time window ΔT depends on the experimental configuration [23] and was evaluated to 1.5µs (=3/Fc) in this experiment. dt t t x h t x I T t T t ij ij
∫
Δ + Δ − − = 2 2 2 )] , ( [ ) , (δ
(2)where x=xj-xi is the source-receiver distance.
Finally, the mean backscattered intensity <I(x,t)> is given by averaging I(x,t) on the P realizations. Figure 3 shows <I(x,t)> for the two microstructures. The very beginning of the backscattered signal (first 15µs) is not taken into account because it is dominated by various contributions (surface waves, edge waves) other than the volume scattering from the microstructure, similarly to what was done in ref. [16].
Figure 3: Mean time-dependent intensity for blocks B1 and B4. The black part of the image corresponds to area with no
information due to the time shift.
Figure 3 clearly shows an influence of the microstructure on the CB phenomenon. Indeed, the peak due to coherent backscattering is clearly visible, at all times, for block B4 whereas it does not appear at all for B1. However, the typical time (2l/c) necessary for the peak to emerge could not be measured here. We can only conclude
that there is strong multiple scattering in B4, and that the typical mean-free path is such that 2l/c<15 µs, and that on the contrary single scattering dominates in B1 (2l/c>30µs µs). Unfortunately, the beginning of the signal is not accessible because of the existence of echoes coming from the mock-up surface.
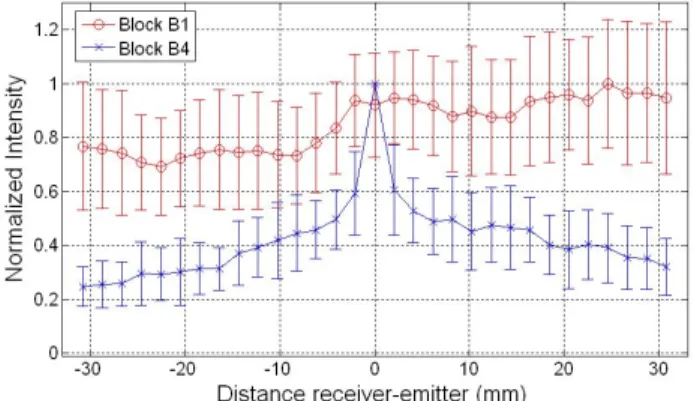
Then the mean static backscattered intensity <I(x)> was calculated by averaging <I(x,t)> in the time interval [T1,T2]
corresponding to 50-90mm depth. Figure 4 shows that for B1 the energy backscattered towards all the elements is almost homogeneously spread while block B4 exhibits an enhancement at the emitting direction.
Figure 4: Time-integrated backscattered intensity for block B1 and block B4 (P=20 realizations and time averaging over times corresponding to 50-90mm depth). Error bars
represent the standard deviation.
4
Comparison of numerical and
experimental data
4.1 Modeling with Athena code
The Athena 2D code simulates the propagation of ultrasonic waves by resolving elastodynamic equations with 2D finite elements. Equations are written in a mixed formulation of velocity and stress [24, 25]. The model uses a regular 2D mesh for the calculation zone. Calculations can be performed for various structures, especially anisotropic and heterogeneous ones and take into account wave attenuation [25-27]. Contact and immersed transducers are implemented. Defect modeling is performed thanks to the fictitious domain method. The perfectly matched layers (PML) allow to impose absorbing conditions on the frontiers of the calculation zone.
Recently, numerical studies based on grain-scale modeling have been proposed to estimate scattering properties. For example, Goshal & al. simulated scattering attenuation with Voronoi tessellations and observed a good agreement with theory for low frequencies on weakly, moderately and strongly scattering materials [28].
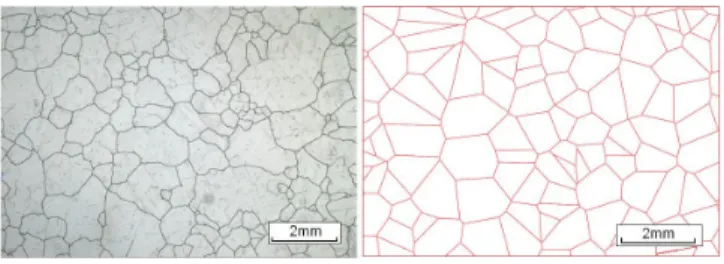
In the present work, 2D Voronoi diagrams were used to describe the polycrystalline medium at the grain scale (figure 5). The chosen mean cell sizes are 220µm and 900µm in order to match the microstructures of B1 and B4 respectively. The cell size of B1 is higher than the experimental grain size (90µm) because the present limit of the ATHENA code prevents from modeling too small cells. Furthermore, for similar reasons, the depth of block B1 was reduced to 8mm and PML were imposed on the frontiers of the calculation zone. The block B4 is also modeled with a slightly higher grain size but the ratio λ/Ф keeps the same
order. Each cell is then associated with a random crystal orientation and the elasticity tensor of each monocrystal is calculated by rotating the monocrystal elasticity tensor Cij
according to the Euler’s angles of the monocrystal.
Figure 5: Grain-scale modeling of the medium. Micrograph of block B4 (left) – Voronoi diagram’s (right). In accordance with the experimental configuration, the full matrix capture sequence is simulated with a 1.8×25 mm² probe at 2MHz, in contact with the medium.
4.2 Comparison of experiments results
and numerical results
• Numerical results on matrix K
Figure 6 confronts experimental and simulated distributions of singular values for block B4. The numerical distribution is similar to the quarter circle law but differences are observed near λS values of 0.5 and 2.
Nevertheless a very good agreement is observed with experimental data. Thus it indicates that at least one typical feature of multiple scattering is accurately predicted by ATHENA 2D, coupled with a grain-scale modeling.
Figure 6: SV distribution from simulation (900µm) compared with the experiment (Block B4). • Numerical results on the backscattered intensity The spatio-temporal representation of the mean backscattered intensity <I(x,t)> is calculated for the two media by averaging simulated results on 31 configurations with various Voronoi diagrams.
In figure 7, the behavior of <I(x,t)> is similar to experiments: a peak appears in the emitting direction for the medium with 900µm mean grain size whereas it does not appear for the medium with 220µm grain size.
Figure 8 shows a comparison between numerical and experimental time-integrated intensity: a good agreement is observed for large grain structure whereas for the weakly scattering medium it does not fit as well. Contrary to the experiments on B1, a peak emerges (though not as sharply as for B4), which seems to indicate that the simulated
structure is more scattering (i.e., has a lower mean-free path) than the actual block B1.
This mismatch is probably due to the fact that the cell sizes did not match either, as mentioned before, for computational reasons. Also, it should be noted that the simulations are 2D, while the actual structures are 3D. In particular, it seems logical that it should be stronger in 2D than in 3D because the energy is concentrate in the plane of propagation.
Figure 7: Mean intensity for simulation with Ф=220µm (left) and Ф=900µm (right).
Figure 8: Numerical and experimental time-integrated intensity.
5
Conclusion and perspectives
In this paper, the ability of the 2D finite element code ATHENA to reproduce typical signatures of multiple scattering in a coarse-grain structure has been investigated. The validation is based on comparisons between experimental and numerical data. The analyzed parameters were the singular values distribution ρ(λS) of K and the
coherent backscattering (CB) intensity <I(x,t)>.
A good agreement has been observed between numerical and experimental distributions ρ(λS). The CB
intensity in dynamic and time-integrated regime was measured for two different microstructures. The results are very close for the polycrystalline material with λ/Ф~1 and the CB peak is well reproduced by numerical simulations. For λ/Ф>>1 the difference is related to the modeled
microstructure, which is not exactly the same as in experiments (higher grain size in modeling). However the influence of the grain size on the backscattered field has been reproduced.
These first results indicate that the microstructural noise related to multiple scattering can be taken in account for future numerical studies based on ATHENA. The next step is the study of this backscattered noise in order to reduce it and to characterize it. In particular, work on the separation of single and multiple scattering contributions in polycristalline materials are in progress.
References
1. Turner, J.A. and R.L. Weaver, Time dependence of
multiply scattered diffuse ultrasound in polycrystalline media. Journal of the Acoustical
Society of America, 1995. 97(5): p. 2639-2644. 2. Turner, J.A., et al., Radiative transfer and multiple
scattering of diffuse ultrasound in polycrystalline media. Journal of the Acoustical Society of
America, 1994. 96(6): p. 3675-3683.
3. Roth, W., Scattering of ultrasonic radiation in polycrystalline metals. Journal of Applied Physics,
1948. 19(10): p. 901-910.
4. Serabian, S. and R. Williams, Experimental
determination of ultrasonic attenuation characteristics using the Roney generalized theory. Materials Evaluation, 1978. 36: p. 55-62.
5. Flax, S.W., et al., Spectral characterization and
attenuation measurements in ultrasound.
Ultrasonic Imaging, 1983. 5(2): p. 95-116.
6. Russell, M. and S. Neal, Grain noise power
spectrum estimation for weak scattering polycrystalline materials using experimentally estimated backscatter coefficients: normal incidence. Ultrasonics, 1994. 32(3): p. 163-171.
7. Chen, J., Y. Shi, and S. Shi, Noise analysis of
digital ultrasonic system and elimination of pulse noise. International journal of pressure vessels and
piping, 1998. 75(12): p. 887-890.
8. Prada, C., et al., Time reversal techniques in
ultrasonic nondestructive testing of scattering media. Inverse Problems, 2002. 18: p. 1761.
9. Reynolds, W. and R. Smith, Ultrasonic wave
attenuation spectra in steels. Journal of Physics D:
Applied Physics, 1984. 17: p. 109.
10. Madsen, E.L., et al., Interlaboratory comparison
of ultrasonic backscatter, attenuation, and speed measurements. Journal of ultrasound in medicine,
1999. 18(9): p. 615-631.
11. Wear, K.A., et al., Interlaboratory comparison of
ultrasonic backscatter coefficient measurements from 2 to 9 MHz. Journal of ultrasound in
medicine, 2005. 24(9): p. 1235-1250.
12. Holmes, C., B.W. Drinkwater, and P.D. Wilcox,
Post-processing of the full matrix of ultrasonic transmit-receive array data for non-destructive evaluation. NDT & E International, 2005. 38(8): p.
701-711.
13. Aubry, A. and A. Derode, Random Matrix Theory
Applied to Acoustic Backscattering and Imaging In Complex Media. Physical review letters, 2009. 102(8): p. 84301.
14. Aubry, A. and A. Derode, Detection and imaging
in a random medium: A matrix method to overcome multiple scattering and aberration.
Journal of Applied Physics, 2009. 106(4): p. 044903.
15. Derode, A., et al., Dynamic coherent
backscattering in a heterogeneous absorbing medium: Application to human trabecular bone characterization. Applied Physics Letters, 2005. 87: p. 114101.
16. Larose, E., et al., Weak localization of seismic
waves. Physical review letters, 2004. 93(4): p.
48501.
17. Margerin, L., M. Campillo, and B. Van Tiggelen,
Coherent backscattering of acoustic waves in the near field. Geophysical Journal International,
2001. 145(3): p. 593-603.
18. Tourin, A., et al., Time-dependent coherent
backscattering of acoustic waves. Physical review
letters, 1997. 79(19): p. 3637-3639.
19. Prada, C., et al., Decomposition of the time
reversal operator: Detection and selective focusing on two scatterers. The Journal of the
Acoustical Society of America, 1996. 99: p. 2067. 20. Hirsekorn, S., The scattering of ultrasonic waves
by polycrystals. The Journal of the Acoustical
Society of America, 1982. 72: p. 1021.
21. Papadakis, E.P., Revised Grain-Scattering Formulas and Tables. The Journal of the
Acoustical Society of America, 1965. 37: p. 703. 22. Marčenko, V. and L.A. Pastur, Distribution of
eigenvalues for some sets of random matrices.
Mathematics of the USSR-Sbornik, 1967. 1: p. 457.
23. Aubry, A., et al., Coherent backscattering and
far-field beamforming in acoustics. The Journal of the
Acoustical Society of America, 2007. 121: p. 70. 24. Bécache, E., P. Joly, and C. Tsogka, An analysis of
new mixed finite elements for the approximation of wave propagation problems. SIAM Journal on
Numerical Analysis, 2000. 37(4): p. 1053-1084. 25. Chassignole, B., et al., Modelling the attenuation
in the ATHENA finite elements code for the ultrasonic testing of austenitic stainless steel welds. Ultrasonics, 2009. 49(8): p. 653-658.
26. Feuilly, N., et al. Relation between ultrasonic
backscattering and microstructure for polycrystalline materials. 2009.
27. Apfel, A., et al., Coupling an ultrasonic
propagation code with a model of the heterogeneity of multipass welds to simulate ultrasonic testing. Ultrasonics, 2005. 43(6): p.
447-456.
28. Ghoshal, G. and J. Turner, Numerical model of
longitudinal wave scattering in polycrystals.
Ultrasonics, Ferroelectrics and Frequency Control, IEEE Transactions on, 2009. 56(7): p. 1419-1428.