2.8.1 Global climate change in marine stable isotope records
James D. Wright
University of Maine; Department of Geological Sciences and Institute for Quaternary Studies, Orono, ME 04469
Marine stable isotope records provide the basis for much of our understanding of past climates. During the past four decades of research, the exploitation of climatic information contained in marine stable isotopes led to the generation of a global network of marine stable isotope records. In particular, oxygen isotope records have been used to estimate past water temperatures, ice sheet sizes, and local salinity variations, while carbon stable isotope records have been used to provide constraints on water mass circulation patterns, oceanic nutrient levels, and atmospheric pCO2 concentrations. From these down-core records came a realization that the major features in marine stable isotope records were recognizable in almost all cores; and thus, if they were synchronous, these features could be used as a tool to correlate cores on a global scale (Emiliani, 1955; Shackleton and Opdyke 1973; Hays et al. 1976; Imbrie et al., 1984).
Demonstrating synchrony and establishing an numerical time scale for these changes were the first two hurdles in establishing a stable isotope-based stratigraphic scheme. Success in both of these areas resulted in stable isotope records becoming the most frequently used stratigraphic tool for the correlating Quaternary climate records. Most of the stable isotope-based
stratigraphic schemes are built on the marine oxygen isotope record, even though variations in the marine carbon isotope records were often globally synchronous as well.
OXYGEN ISOTOPIC VARIATIONS IN THE NATURAL ENVIRONMENT
The stable isotopes of oxygen used in paleoclimatic reconstructions, and hence oxygen isotope stratigraphy, are 16O and 18O. The 16O atom is the most abundant oxygen isotope in the
ocean/atmosphere system, constituting ~99.75% of the total oxygen atoms; while the 18O isotope
makes up ~0.2%. To determine oxygen isotopic ratios from various materials, unknown 18O/16O
ratios are compared to the known 18O/16O ratio of a standard. This procedure eliminates external
variations that affect the determination of 18O/16O ratios and helps to ensure consistency among
the data produced from different mass spectrometers. The resulting oxygen isotopic variations are expressed in delta notation, d18O, where:
d18O =
18O/16O
sample!-!18O/16Ostandard 18O/16O
standard x 1000 (2.8.1-1)
Two standards are used depending on whether carbonate samples or water samples are being measured. For carbonate samples, the reference standard is PDB, which was a crushed
belemnite (Belemnitella americana) from the Peedee formation (Cretaceous) in South Carolina. The original PDB material has long since been exhausted, but other standards have been
calibrated to PDB and are used as an intermediate reference standard through which a PDB value can be calculated. For measuring the isotopic composition of water samples, Standard Mean Ocean Water or SMOW is used (Craig, 1961). This is water that approximates the mean oxygen isotopic composition of the ocean.
OXYGEN ISOTOPE PALEOTHERMOMETRY
The use of stable oxygen isotopic measurements as a proxy of past environmental conditions, paleothermometry, began with Urey's (1947) theoretical prediction that the 18O/16O
ratio in calcite (CaCO3) should vary as a function of the temperature in which the mineral
precipitated. Urey's prediction was confirmed by 18O/16O measurements on the CaCO 3
precipitated by mollusks living in a wide range of temperatures. These studies led to the
development of a paleotemperature equation, from which the temperature of precipitation could be estimated by measuring the 18O/16O ratio in calcite secreting organisms (foraminifera, corals,
mollusks) and the ratio in the water the organisms lived in. Various forms of the
paleotemperature equation have been generated (e.g., Epstein et al., 1951, 1953, Craig, 1965, O'Neil et al., 1969), but all generally follow Epstein et al.'s (1951, 1953) original determination:
T = 16.5 - 4.3 x (d18Ocalcite - d18Owater) + 0.14 x (d18Ocalcite - d18Owater)2 (2.8.1-2)
where T and d18O
water are the temperature (°C) and oxygen isotope value of the water in which
the organism lived1 , and d18Ocalcite is the oxygen isotope value measured in the calcite. Similar
paleotemperature equations for aragonite have been developed (e.g., Horibe and Oba, 1970). Equation 2 shows that the changes in d18O
calcite are a function of the water temperature
and d18Owater value. To the first order, relative changes in measured d18Ocalcite values can be
approximated by: Dd18O
calcite = Dd18Owater - 0.23 x DT (2.8.1-3)
where the D notation refers to the relative change from one level to another between the variables. From this relationship we see that there is a one to one relationship between the change in the Dd18Ocalcite and the Dd18Owater. However, there is an inverse relationship between
Dd18O
calcite and DT such that for every 1°C temperature increase there is a 0.23‰ decrease in the
measured d18Ocalcite value. These relationships are routinely applied to interpret changes in
d18O
calcite records generated from foraminifera, corals, and mollusks.
ORIGIN OF OXYGEN ISOTOPIC VARIATIONS IN THE NATURAL
ENVIRONMENT
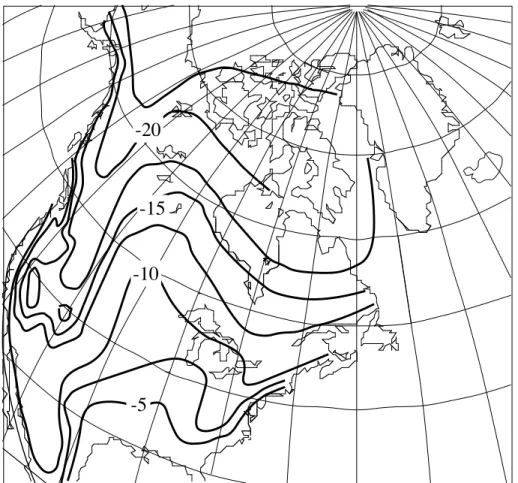
The 18O/16O ratio in the ocean/atmosphere system is not uniform and can vary spatially
and temporally (Fig. 2.8.1-1). These d18O variations are produced by a temperature-dependent
fractionation between the H218O and H
216O molecules as part of the hydrologic cycle (Craig and
Gordon, 1965) and will have a significant effect on the marine d18Ocalcite record through time. In
general, water vapor evaporates in low latitudes and is transported to and precipitates in high
1d18O
water term in Paleotemperature equations is expressed relative PDB, not SMOW. To convert from d18O
water values from the SMOW to PDB scales, on must subtract 0.22‰ from the SMOW value. See Craig (1961) or Rye and Sommer (1980) for a more detailed explanation.
-20
-5 -10
-15
Fig. 2.8.1-1. Generalized map of the d18O values of precipitation in North America (after Fairbanks, 1982), showing the regional variability. The pattern in d18O values reflect larger the surface air temperature gradients (i.e., changes with latitude and elevation).
latitudes. Fractionation between H218O and H
216O molecules during evaporation concentrates
the H216O molecules in the water vapor, leaving the water enriched in H218O molecules.
Conversely, fractionation during condensation concentrates the H218O molecules in the
precipitation (rain/snow), further enriching the clouds (water vapor) in H216O molecules relative
to H218O molecules. The resulting d18O values in precipitation vary as a function of air mass
temperature (Dansgaard, 1964). Consequently, there are large regional, but predictable,
variations in the d18O value of precipitation (Fig. 2.8.1-1). These differences affect the oceanic
environment because the d18O values at various points in the ocean represent mixing between the
more saline, high d18O waters in the evaporative regions of the oceans (subtropics) and the fresh,
low d18O riverine water (Craig and Gordon, 1965).
These d18O differences in precipitation affect the oceanic environment because the d18O
values at various points in the ocean represent mixing between the more saline, high d18O waters
in the evaporative regions of the oceans (subtropics) and the fresh, low d18O riverine water
(Craig and Gordon, 1965). In general there is a 1.5 ‰ variation in d18Owater gradients in the
marine environment with the equatorial surface waters having d18Owater values ~1‰ higher than
SMOW due to the evaporative effects and the polar surface waters having d18Owater values ~0.5
referred to as the salinity effect because these d18Owater changes correlate with salinity changes.
Therefore, d18Owater values are important in assessing oceanic temperature gradients. In the
modern ocean, the latitudinal d18O
calcite gradient (~4.5 ‰) is dominated by temperature changes
(~28°C). Therefore, it is tempting to ascribe d18Ocalcite gradients to temperature differences
alone. However, if temperature were the sole influence on the modern d18O
calcite gradient, then
we would expect a gradient of >6.0 ‰. The attenuation in the d18Ocalcite gradient results from
surface water d18O
water differences of ~1.5 ‰ and accounts for the attenuated temperature
difference (5-6°C) observed in the modern d18Ocalcite gradient. There were certainly different
d18O
water relationships for the past oceans. However, the first-order pattern of high d18Owater
values in the low latitudes and low d18Owater values in the high latitudes have persisted through
time.
On glacial to interglacial time-scales, fractionation of oxygen isotopes associated with the hydrologic cycle causes the average d18O
water value of the ocean to vary considerably. At
present, high latitude precipitation returns to the oceans through summer melting. During glacial intervals, however, building large ice sheets stores the lighter isotope (16O). The difference in
d18Owater values between the ice sheet and mean ocean was large (d18Oice = -35 to -40‰ vs.
d18O
water mean ocean = ~0‰). As a result, variations in ice sheet sizes are reflected in the
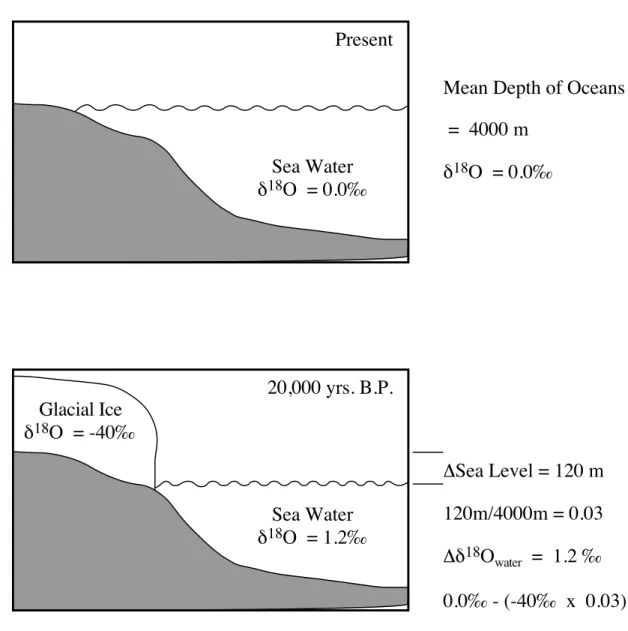
variable oceanic d18Owater values. The most recent glacial to interglacial transition provides the
best illustration of how ice sheets affect the ocean d18O
water value (Fig. 2.8.1-2). During the last
glacial maximum, the amount of water stored in ice sheets caused the global sea level to be 120 m lower than present (Fairbanks, 1989). This change in sea level represents a decrease of ~3% in the ocean volume. If 3% of the ocean water was removed with a d18Owater value 40‰ lower
than mean ocean waters, then the mean ocean d18O
water value during the last glacial maximum
was 1.2‰ higher than at present (Fig. 2.8.1-2). This is significant because the average glacial to interglacial d18Ocalcite change was 1.8‰ (Broecker, 1986). Thus, the water locked up in
continental ice sheets with low d18O
water values is the largest signal recorded in Quaternary
marine d18Ocalcite records. (Fig. 2.8.1-2). The cyclic waxing and waning of ice sheets created a
global d18O signal that is used to make global correlations based on d18O variations.
OXYGEN ISOTOPE STRATIGRAPHIES
The first systematic examination of the marine stable isotope record was made on d18Ocalcite records generated from planktonic foraminifera (calcareous marine microfossils) in
Caribbean deep-sea cores (Emiliani, 1955). Emiliani recognized the cyclic pattern of low and high d18O
calcite values and concluded that these represented cyclic glacial-interglacial intervals.
Within Emiliani's cores, he identified the seven most recent climate cycles and estimated that they spanned the last 280,000 years. (Current age estimates indicate that they represent the last 525,000 years.) To apply the Paleotemperature Equation (Eq. 2) to these records, Emiliani estimated that ice sheet induced ocean d18Owater variability was relatively small (0.3‰).
Therefore, most of the d18O
calcite variability between glacial and interglacial intervals represented
temperature changes on the order of 5 to 10°C with the glacial intervals being colder. Emiliani divided the d18Ocalcite record into stages with the warm stages designated with odd numbers
Sea Water d18O = 0.0‰ Present Glacial Ice d18O = -40‰ Sea Water d18O = 1.2‰ 20,000 yrs. B.P. DSea Level = 120 m 120m/4000m = 0.03 Dd18Owater = 1.2 ‰ 0.0‰ - (-40‰ x 0.03) Mean Depth of Oceans = 4000 m
d18O = 0.0‰
Fig. 2.8.1-2. The effect of large ice sheets on the d18O composition of the ocean can be significant. The removal of 3 % of the ocean's water during the last glacial maximum lowered sea level by 120 m. The d18O difference between the ocean and the ice is 40 ‰, causing a whole ocean d18O change of 1.2 ‰.
Stage 1" would refer to the present interglacial interval and "Isotope Stage 2" would refer to the most recent glacial period (Fig. 2.8.1-3).
A numerical time-scale was needed to convert the marine isotope stages into
chronostratigraphic units, from which age estimates in other cores could be made based on down core d18Ocalcite changes. The initial time scale for Emiliani's d18Ocalcite records evolved from
radiocarbon dates on the sediments younger than 30,000 years, correlations to existing terrestrial records, and an estimate for the last interglacial high stand of 100,000 years based on a U/Th date. Several aspects of this new oxygen isotope-based stratigraphy were questioned, most notably the assumption of small ice sheet-induced d18O
water effects (Shackleton, 1967) and the
0 500 1000 1500 1 2 3 4 5 6 7 8 9 10 11 12 13 14 15 16 17 18 19 20 21 22 -1 -2 d18O Depth in Core (cm) V28-238 3 4 5 0 500 1000 1500 2000 2500 3000 d18O ODP Site 677 2 3 4 5 0 500 1000 1500 d18O
DSDP Site 552 Fig. 2.8.1-3. Three d18O records from
different regions which show the cyclic nature in all marine d18O records.
V28-238 is a planktonic foraminiferal record from the western equatorial Pacific (Shackleton and Opdyke, 1973), Site 677 is a benthic foraminiferal record from eastern equatorial Pacific, and Site 552 is a benthic foraminiferal record from the North Atlantic. The magnetic polarity record from V28-238 is shown as the black/white column. The change at ~1200cm represents the
Brunhes/Matuyama boundary with a current age of 780,000 yrs. B.P. The isotope stages as designated by Emiliani (1955) and identified in V28-238 by Shackleton and Opdyke (1973) are shown along the right side of the V28-238 curve.
essentials of Emiliani's pioneering work have remained as the stratigraphic framework for correlating marine isotope records.
By the early 1970's, stable isotope laboratories had generated many downcore d18Ocalcite
records and it was clear from the replication of downcore patterns that the primary signal was global (Fig. 2.8.1-3). Shackleton's (1967) argument that most of the glacial to interglacial difference in d18O
calcite values was due to ice volume differences was a key in establishing that
the d18Ocalcite changes were global. Unlike sea surface temperature changes which can vary from
location to location, ice volume signal changes provided a mechanism that globally changed d18O
calcite values.
There are several caveats in using oxygen isotope-based stratigraphy. First, oxygen isotopic records are not numerical-age chronometers. Assigning ages based on measured oxygen isotopic changes depends on correlating the stratigraphic sequence of isotopic variations to a reference sequence that has been dated by numerical-age methods. To make such a correlation
one must first have a good idea about the time interval that is represented by the core. To illustrate this point, consider that one of the most commonly analyzed species in marine sediments is the benthic foraminifera, Planulina wuellerstorfi, which first appeared approximately 16 million years ago. The d18O
calcite value measured on a 12 million year old
sample of P. wuellerstorfi from the Pacific Ocean is 2.5 ‰, which is similar to values measured on this species in the modern deep oceans. Therefore, oxygen isotope-based stratigraphy works only in conjunction with other stratigraphies (i.e., those based on fossil events or magnetic polarity changes). If one is concerned with the most recent record of climate change, it is often assumed that the coretop is time-zero and this usually provides an accurate starting point to identify the oxygen isotope stages.
A second concern in generating marine isotope records is that the record should be based on isotopic analyses of the same species. This is important because d18Ocalcite values can vary
among the different species of organisms. In planktonic foraminifera, variations between species as great as 1.5‰ exist which are as large as the glacial-interglacial signal in some localities. These interspecific d18O
calcite variations result from different seasonal or depth habitats (Bé,
1977; Fairbanks et al, 1980). However, in other cases, d18Ocalcite records from mixed
assemblages of planktonic foraminifera and/or fine-grained CaCO3 are remarkably similar to mono-specific foraminiferal curves.
SUBSEQUENT REFINEMENTS IN THE OXYGEN ISOTOPE STRATIGRAPHY Age estimates for the events identified in Emiliani's oxygen isotope time scale have evolved considerably. The most dramatic revision resulted when it was demonstrated that the last interglacial high stand was 125,000 years ago and correlated with "Isotope Stage 5e" (a subdivision of Stage 5) (Broecker et al., 1968), not the 100,000 years age that Emiliani used as part of his original age model. Revisions to the older parts of the isotope record evolved primarily with the ability to measure the polarity changes in deep-sea cores and correlate the d18O
calcite records to a numerical time-scale based on paleomagnetic changes. This was first
done by Shackleton and Opdyke (1973) who measured the paleomagnetic and d18Ocalcite changes
in a core from the western equatorial Pacific (Fig. 2.8.1-3). The most recent polarity change (the Brunhes/Matuyama) was dated radiometrically (K/Ar) in lava flows as 730,000 years (more recent measurements date this change as 780,000 years). This event and other paleomagnetic reversals provided tie points in the older parts of sedimentary cores to which accurate age estimates could be assigned to stable isotope changes. The result was that oxygen isotope records could now be used as a chronostratigraphic tool for almost all of the Pleistocene (~1.8 million years).
Another major advancement in refining the oxygen isotope-based stratigraphy came with the observation that the climate/d18O
calcite changes matched orbital insolation patterns. Orbital
variations affect the distribution of the sun's radiation at the surface of the earth, and therefore the climate. Past orbital variations can be calculated, providing a testable mechanism for past climate changes. The idea that natural variations in insolation could be responsible for the cyclicity in climate has been around for a long time. Milankovitch (1941) calculated the
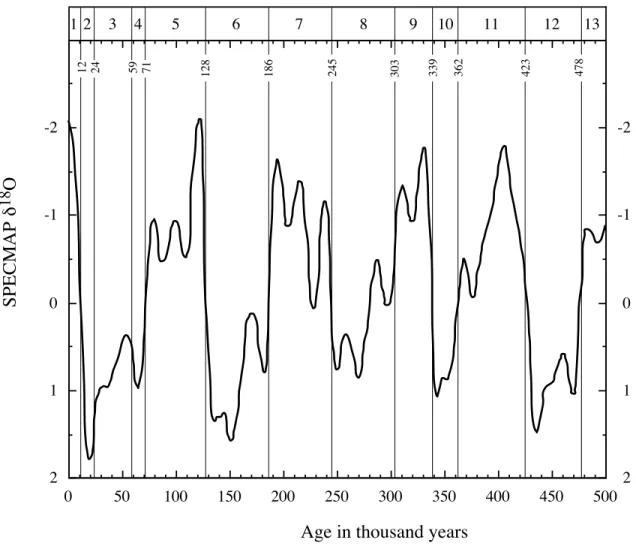
climate records from the Southern Ocean with the insolation curves and demonstrated that the climate changes were paced by insolation changes and, therefore, that they could be used to explain the cyclic nature of climate change during the past 2 million years. One implication of the "Pacemaker" discovery is that the calculation of past insolation cycle variations could be used as the basis for a numerical time-scale. Imbrie et al. (1984) developed what is now called the SPECMAP d18O record by stacking d18O
calcite records from various localities. The resulting
d18O curve was assigned ages by tuning or adjusting the d18O patterns to match the predicted
patterns based on the current astronomic calculations for orbital variations (Fig. 2.8.1-4). The estimated precision associated with using the oxygen isotope stratigraphy is now on the order of 5,000 years (Imbrie et al., 1984).
-2 -1 0 1 2 SPECMAP d 18 O 0 50 100 150 200 250 300 350 400 450 500
Age in thousand years
1 2 3 4 5 6 7 8 9 10 11 12 13 12 24 59 71 128 186 245 303 339 362 423 478 -2 -1 0 1 2
Fig. 2.8.1-4. The stacked, smoothed d18O record from SPECMAP is plotted versus age (Imbrie et al., 1984). The d18O values are expressed as standard deviation units about a mean value of zero. Typical glacial-interglacial differences range between 1.5 and 2.0 ‰. The standard Isotope Stages are identified at the top of the graph with interglacial stages denoted by odd numbers and glacial stages by even numbers. Isotope Stage boundaries with SPECMAP ages are identified as thin vertical lines (Imbrie et al., 1984). Subsequent work on the age estimates for the oxygen isotope zonation (e.g., Shackleton et al., 1990) is very similar to this time-scale for the last 750 thousand years. Finer resolution in oxygen isotope records is coherent from core to core and is demonstrated in stage 5 which has 3 distinct peaks, 5a, 5c, and 5e, having ages of 82, 105, and 122 thousand years ago. See Imbrie et al. (1984) for further discussion of the finer-scale features.
Following the work of SPECMAP, the oxygen isotope-based stratigraphy has evolved in two different directions. Several researchers have extended the oxygen isotope stratigraphic time scale from the Plio-Pleistocene boundary back into the late Miocene (~6 million years)
(Ruddiman et al., 1986, Shackleton et al., 1990; Hodell et al., 1994). Advancing the astronomically based age models for older sequences was not limited to d18O
calcite records as
Hilgen (1991) demonstrated with thick Mediterranean sapropels which further refined age estimates for the early Pliocene events. Others have shown cyclic patterns in d18Ocalcite records
in the middle Miocene, which suggests that one day the oxygen isotope stratigraphies may be extended back to 15 million years ago (Pisias et al., 1985). The other direction of refinement in oxygen isotope-based stratigraphy has involved the identification of high resolution (<1,000 years) changes during the most recent glacial interval. These events were first documented in the Greenland Ice cores (e.g., Dansgaard et al., 1982), but recent, high-resolution work on marine cores indicates that many marine sediments also recorded these high frequency events (Bond et al., 1993).
DEVILS HOLE - AN OUTSTANDING PROBLEM
In 1992, a well dated d18O
calcite record was published from a calcite vein in Nevada
indicated that the penultimate deglaciation (Isotope Stage 6 to Stage 5) occurred 15,000 years earlier than previously estimated by SPECMAP (Winograd et al., 1992). The Devils Hole d18Ocalcite record and high resolution U/Th dating created a stir in the paleoclimatic community
because it questioned not only the stratigraphic scheme, but also went to the heart of the basic mechanism for climate change (orbital forcing) that had become accepted as fact by many researchers. Attempts to explain the different chronologies have looked at the Devils Hole record as either having problems in the reliability of the U/Th dates due to a groundwater effect on Th incorporation during calcite precipitation (Shackleton, 1993), or possibly that the
d18O
calcite records from Devils Hole and marine environments represent different climatic signals
(Imbrie et al., 1993). Curiously, calcite precipitation stopped in the Devils Hole vein around 60,000 years ago which presents more uncertainty regarding the Devils Hole record. Since the introduction of the Devils Hole record and the initial response by the paleoclimatic community, the coral terrace sequences from which the 125,000 year dates were obtained have been re-examined and re-dated. The new U/Th dates confirm the original dates of 125,000 years using more rigorous methods. It seems that at present, the Devils Hole record needs to be replicated in other locations before the paleoclimate community will abandon the orbitally based oxygen stratigraphy (Imbrie et al., 1993).
CONCLUSIONS
The d18Ocalcite records from marine cores show synchronous changes that can be reliably
used as a correlation tool (Fig. 2.8.1-2). Marine d18O
calcite records in the Quaternary primarily
reflect temperature and ice volume changes associated with the glacial-interglacial cycles. These effects changed the d18Ocalcite in the same direction. Cold temperatures and increased ice
volumes during the glacial intervals caused the d18O
calcite to increase; conversely, warmer
temperatures and low ice volumes caused the d18Ocalcite to decrease. The most important fact is
that for the last 40,000 years, the d18O
synchronous by AMS 14C dating. For the older time intervals, the magnetic polarity records show that the d18Ocalcite records were synchronous as well. Marine stable isotope records contain
globally recognizable features with excellent age control, and thus provide a solid basis for the oxygen isotope stratigraphic scheme.
Acknowledgments
I thank L. Peterson, W. Ruddiman, N. Pisias, and K. Miller for critical reviews which improved this manuscript greatly. Discussions with K. Miller about the philosophy of using stable isotopes in stratigraphy were also valuable. I thank J. Sowers for her help in all stages of preparation, including comments of an earlier draft.
REFERENCES
Bé, A.W.H., 1977. An ecological, zoogeographic and taxonomic review of recent planktonic foraminifera, in Oceanic Micropaleontology, 1, p. 1-100.
Bond, G., Broecker, W.S., Johnsen, S., McManus, J., Labeyrie, L., Jouzel, J., and Bonani, G., 1993. Correlations between climate records from North Atlantic sediments and Greenland ice: Nature, v. 365, p. 143-147.
Broecker, W.S., 1986. Oxygen isotope constraints on surface ocean temperatures: Quaternary Research, v. 26, p. 121-134.
Broecker, W.S., Thurber, D.L., Goddard, J., Ku, T-L., Matthews, R.K., and Mesolella, K.J., 1968. Milankovitch hypothesis supported by precise dating of coral reefs and deep-sea sediments: Science, v. 159, p. 297-300.
Craig, H., 1957. Isotopic standards for carbon and oxygen and correction factors for mass spectrometric analysis of carbon dioxide: Geochemica et Cosmochemica Acta, v. 12, p. 133-149.
Craig, H., 1961. Standard for reporting concentrations of deuterium and oxygen-18 in natural waters: Science, v. 133, p. 1833-1834.
Craig, H., 1965. The measurement of oxygen isotope paleotemperatures, in Tongiorgi, E., ed., Stable Isotopes in Oceanographic Studies and Paleotemperatures, Spoleto: Consiglio Nazionale delle Ricerche, Laboratorio di Geologica Nucleare, Pisa, p. 161-182.
Craig, H., and L.I. Gordon, 1965. Deuterium and oxygen-18 variations in the oceans and marine atmosphere, in Tongiorgi, E., ed., Stable Isotopes in Oceanographic Studies and
Paleotemperatures, Spoleto: Consiglio Nazionale delle Ricerche, Laboratorio di Geologica Nucleare, Pisa, p. 1-122.
Dansgaard, W., 1964. Stable isotopes in precipitation: Tellus, v.16, p. 436-468.
Dansgaard, W., Johnsen, S.J., Clausen, H.B., Dahl-Hensen, D., Gundestrup, N., and Hammer, C.U., 1982. North Atlantic climate oscillations revealed by deep Greenland Ice Cores, in Hansen, J.E., and Takahashi, T., eds., Climate Processes and Climate Sensitivity: AGU Geophysical Monograph, v. 29, p. 288-298.
Emiliani, C., 1955. Pleistocene temperatures: Journal of Geology, v. 63, p. 539-578.
Epstein, S., Buchsbaum, R., Lowenstam, H., Urey, H.C., 1951. Carbonate-water temperature scale: Bulletin of the Geological Society of America, v. 62, p. 417-426.
Epstein, S., Buchsbaum, R., Lowenstam, H., Urey, H.C., 1953. Revised Carbonate-water temperature scale: Bulletin of the Geological Society of America, v. 64, p. 1315-1326.
Fairbanks, R.G., 1982. The origin of continental shelf and slope water in the New York Bight and Gulf of Maine: Evidence from H218O/H
216O ratio measurements,:Journal of
Geophysical Research, v. 87, p. 5796-5808.
Fairbanks, R.G., 1989. Glacio-eustatic record 0-16,000 years before present: influence of glacial melting rates on Younger Dryas event and deep ocean circulation: Nature, v. 342, p. 637-642.
Fairbanks, R.G., Wiebe, P.H., and Bé, A.W.H., 1980. Vertical distribution and isotopic
composition of living planktonic foraminifera in the western North Atlantic: Science, v.207, p. 61-63.
Hays, J. D., Imbrie, J., and Shackleton, N. J., 1976. Variations in the earth's orbit: pacemaker of the ice ages: Science, v. 194, p. 1121-1132,
Hilgen, F.J., 1991. Astronomical calibration of Gauss to Matuyama sapropels in the
Mediterranean and implication for the geomagnetic polarity time scale: Earth and Planetary Science Letters, v. 104, p. 226-244.
Hodell, D.A., Benson, R.H., Kent, D.V., Boersma, A., and Rakic-El Bied, K., 1994.
Magnetostratigraphic, biostratigraphic, and stable isotope stratigraphy of an Upper Miocene drill core from the Sale Briqueterie (northwestern Morocco): A high-resolution chronology for the Messinian stage: Paleoceanography, v. 9, p. 835-855.
Horibe, S., and Oba, T., 1970. Temperature scales of aragonite-water and calcite-water systems: Fossils, v. 23, p. 69-79.
Imbrie, J., Mix, A. C., Martinson, D.G., 1993. Milankovitch theory viewed from Devils Hole: Nature, v. 363, p. 531-533.
Imbrie, J., Hays, J. D., Martinson, D.G., McIntyre, A., Mix, A.C., et al., 1984. The orbital theory of Pleistocene climate: support from a revised chronology of the marine d18O record, in Berger, A. L., Imbrie, J., Hays, J. D., Kukla, G., and Saltzman, B., eds., Milankovitch and Climate (Pt. I): Dordrecht (Reidel), p. 269-305.
Milankovitch, M.M., 1941. Canon of insolation and the ice-age problem: Koniglich Serbische Akademie, Beograd. (English translation by the Israel program for scientific translation, published for the U.S. Department of Commerce and the National Science Foundation, Washington, D.C.).
O'Neil, J.R., Clayton, R.N., and Mayeda, T.K., 1969. Oxygen isotope fractionation in divalent metal carbonates: Journal of Chemical Physical, v. 51, p. 5547-5548.
Pisias, N.G., Shackleton, N.J., and Hall, M.A., 1985. Stable isotope and calcium carbonate records from hydraulic piston cored Hole 574A: high-resolution records from the middle Miocene, in Mayer, L., Theyer, F., et al., Initial Report of Deep Sea Drilling Project, Volume 85, Washington, U.S. Government Printing Office, p. 735-748.
Ruddiman, W. F., Raymo, M., and McIntyre, A., 1986. Matuyama 41,000-year cycles: North Atlantic Ocean and northern hemisphere ice sheets: Earth and Planetary Science Letters, v. 80, p. 117-129.
Rye, D.M., and Sommer, M.A., 1980. Reconstructing paleotemperature and paleosalinity regimes with oxygen isotopes, in Rhoads, D.C., and Lutz, R.A., eds., Skeletal Growth of Aquatic Organisms, Plenum Publishing, New York, p. 162-202.
Shackleton, N.J., 1967. Oxygen isotope analyses and Pleistocene temperatures re-assessed: Nature, v. 215, p. 115-17.
Shackleton, N.J., and Opdyke, N.D., 1973. Oxygen isotope and paleomagnetic stratigraphy of equatorial Pacific core V28-238: Oxygen isotope temperatures and ice volumes on a 105
year and 106 year scale: Quaternary Research, v. 3, p. 39-55.
Shackleton, N.J., Berger, A., and Peltier, W.R., 1990. An alternative astronomical calibration of the Lower Pleistocene time scale based on ODP Site 677: Transactions of the Royal Society of Edinburgh, Earth Science, v. 81, p. 251-261.
Urey, H.C., 1947. The thermodynamic properties of isotopic substances: Journal of the Chemical Society, p. 562-581.
Winograd, I.J., Coplen, T.B., Landwehr, J.M., Riggs, A.C., Ludwig, K.R., Szabo, B.J., Kolesar, P.T., and Revesz, K.M., 1992. Continuous 500,000 year climate record from vein calcite in Devils Hole Nevada: Science, v. 258, p. 255-260.