DOI: 10.3934/biophy.2015.3.245 Received date 26 February 2015, Accepted date 16 June 2015, Published date 28 June 2015 http://www.aimspress.com/
Research article
A guide to investigating colloidal nanoparticles by cryogenic
transmission electron microscopy: pitfalls and benefits
Christophe A. Monnier 1, David C. Thévenaz 1, Sandor Balog 1, Gina L. Fiore 1, Dimitri Vanhecke 1, Barbara Rothen-Rutishauser1, and Alke Petri-Fink 1,2,*
1 Adolphe Merkle Institute, University of Fribourg, Chemin des Verdiers 4, 1700 Fribourg,
Switzerland
2 Chemistry Department, University of Fribourg, Chemin du Musée 9, 1700 Fribourg, Switzerland
* Correspondence: Email: [email protected].
Abstract: Synthetic colloidal nanoparticles are nowadays omnipresent. Nonetheless, adequately
characterizing them and interpreting the data is challenging, as their surrounding environment, e.g. the medium they are dispersed in, is often an active contributor to their size, morphology and structural integrity. In this regard, cryo-transmission electron microscopy (cryo-TEM) is an ideal methodology. This article provides a general guidance for beginners and experts encountering this technique on the common benefits and pitfalls when characterizing synthetic nanoparticles. Illustrative experimental examples are presented which cover the importance of water as a supportive and structural component, along with contrast generation and electron beam damage.
Keywords: nanoparticle; vesicle; negative staining; cryo-TEM; colloid; beam damage
1. Introduction
Nanoparticles are defined as materials of which at least one of the three dimensions is less than 100 nm [1]. Their physicochemical properties may differ significantly from the bulk material, making them exceptional tools for a wide range of utilities. In this regard, they have become particularly popular over the last two decades to address unresolved or unmet expectations in modern medicine [2], electronics [3] or materials sciences [4].
In general, nanoparticles can be categorized into hard (e.g. metals, metal oxides etc.) and soft (e.g. polymers, phospholipids etc.). The latter also comprise micellar and vesicular structures which are mainly composed of synthetic or natural macromolecules. Commonly used components are amphiphilic block copolymers. These macromolecules are counterparts to generally used surfactants or lipids, as they facilitate the design of the nanoparticle in regard to tunable stability, degradation time or responsiveness to external stimuli [5]. Moreover, they auto-assemble in water to form structures of variable morphologies (e.g. vesicles, spherical or worm-like micelles etc.) [6–10]— depending on their environment and chemistry—which in turn offers a wide range of applications,
e.g. as nanoreactors [11,12,13]. Their assembly is governed by different parameters such as
temperature, salt and reactant concentrations etc. [7,14–18]. Irrespective of the category, manufacturing nanoparticles requires a meticulous mastering of the synthetic and self-assembly procedures, as their exceptional properties are generally mediated by their size and sometimes also morphology. In this regard, seeing and resolving the particle is still the gold standard when verifying and optimizing the synthetic outcome. Yet the nanoscale world is beyond the reach of standard—i.e., diffraction-limited—light and fluorescence microscopes, although nanometer resolutions (i.e., around 20 nm) [19] can nowadays be reached [20,21]. Transmission electron microscopy (TEM) is thus arguably one of the most powerful tools to visualize ultrafine structures of nanometer-scale materials and—with the development of evermore sensitive detection systems [22]—has become a leading experimental and analytical tool in materials and nanosciences. Nonetheless, there are still important challenges which limit its impact. The challenges regarding the usage of TEM in investigating nanoparticles and polymers are threefold. First and foremost, conventional TEM relies on a vacuum environment to avoid disparity of the electron beam. Samples need to be water-free, which consequently requires any specimen to be dehydrated or chemically conserved. However, both hard and soft nanoparticles often rely on water as a contributor to supramolecular and nanoscale colloidal stability: The former as a suspending medium and the latter as a supportive—or even integral—structural factor. As a second obstacle, the contrast—or the degree of separation between dark and bright areas—of structural details is often poor in soft nanomaterials, as they usually consist of elements with low atomic numbers. Staining the specimen with heavy element-containing compounds (e.g. phosphotungstic acid/PTA or uranyl acetate) is a straightforward strategy to enhance its contrast in order to be visualized [23]. However, the staining agent might alter the sample and create artifacts. For example, investigations on the self-assembly of semi-crystalline block copolymers—such as poly(ethylene glycol)−poly(ε-caprolactone) (PEG-PCL)—have recently demonstrated that changes in pH or salt concentration might influence the hydration of the hydrophilic block. This may lead to different thermodynamically favored morphologies due to different packing behavior of the hydrophilic and hydrophobic blocks [16,24]. Another point is that the location and contours provided by the heavy metal ions is dominating the result in lieu of the native polymeric specimen. The third limitation is ionization and the breaking of chemical bonds due to inelastic electron scattering processes inadvertently culminate into local beam-induced damage of the sample. These primary effects are followed by secondary effects, such as crosslinking, generation of heat and a gradual reduction of crystallinity. As an example, polymers containing quaternary carbons or sulfones in the main chains—such as poly(methyl)methacrylate or its derivatives and poly(butane)sulfones—are known to be particularly sensitive to electron beams [25].
TEM in cryogenic mode (cryo-TEM) is a way to circumvent most of these setbacks. In short, a specimen is conserved in a vitrified state [26] and is directly investigated at liquid nitrogen temperatures. The information obtained by cryo-TEM from fully hydrated specimens is far closer to their native state and incomparable to dehydrated ones. Hence, this methodology is becoming an increasingly interdisciplinary tool over a broader range of fields, a prominent example being the characterization of colloidal nanoparticles and nanocomposites.
This article recapitulates and experimentally demonstrates from a chemical and material perspective the challenges and caveats of characterizing small nanoparticles and vesicles, and visually demonstrates the general effects which may occur. In this regard, it is shown how cryo-TEM facilitates the investigation of size and morphology of three different nanoparticle systems. These include hard and soft nanoparticles which are either homo- or heterogeneous in nature. The principal demonstrative nanoparticles of this study are self-assembled lanthanide-containing polymeric nanoparticles made of PEG-PCL bockcopolymers end-functionalized with a dipicolinic acid (dpa) moiety [27]. These polymers are coordinated with lanthanide trivalent cations, offering unique optical properties to the nanoparticles, which in turn render them particularly intriguing as optical tagging devices [28,29]. The drying effect on the different nanoparticle categories are highlighted by applying conventional and cryo-TEM. The PEG-PCL nanoparticles are further exposed to phosphotungstic acid/PTA and show what kind of chemical effects staining agents may have on such polymeric assemblies. Structural insights are additionally provided, and finally the effect of the electron dose on sensible structures—in this case doxorubicin-loaded liposomes—is also demonstrated.
2. Materials and Methods
2.1. Synthetic details
2.1.1. Gold nanoparticles
Gold nanoparticles were synthesized as reported by Turkevich and colleagues [30]. In short, 0.5 mM of aqueous gold salt (tetrachloroauric acid, HAuCl4 x H2O, Sigma-Aldrich) was boiled for 20
minutes in the presence of 1.5 mM sodium citrate (Sigma-Aldrich), yielding spherical citrate-coated nanoparticles. These particles were then suspended in Milli-Q water.
2.1.2. Lanthanide-containing PEG-PCL polymeric nanoparticles
Lanthanide-containing polymeric nanoparticles were prepared by solvent displacement method [27]. dpa-PCL-PEG-OCH3 (0.023 g, 2.46 μmol) was dissolved in dimethylformamide (DMF,
2.5 mL). Portions of a triethylamine (Et3N) in DMF stock solution (0.34 mL, 49 μmol, 0.1 mL of
Et3N in 5 mL of DMF) and of an europium(III) chloride (EuCl3·6H2O) in DMF stock solution (0.28
mL, 2.88 mM, 0.82 μmol) were added dropwise. The solution was stirred at room temperature for 5 minutes, and Milli-Q water (10 mL) was added a constant rate to a vial containing a portion of the polymeric metal complex solution (1.26 mL). The resulting suspension was then stirred at room temperature for 5 minutes, and DMF was removed by extensive dialysis against Milli-Q water. Finally, the suspension volume was adjusted to 20 mL. Aliquots of the samples were filtered through
0.45 μm PVDF filters prior to analysis. Particles of various sizes and morphologies were obtained by varying the order of addition during the solvent displacement process (i.e., by adding water to the organic phase and vice versa).
2.1.3. Liposomes
All lipids were purchased from Avanti Polar Lipids. Liposomes were prepared by lipid film hydration. In short, different lipids (1,2-dihexadecanoyl-sn-glycero-3-phosphocholine/DPPC, 4 mg/20 wt%; 1,2-Distearoyl-3-trimethylammonium-propane (chloride salt)/DSTAP, 5 mg/25 wt%;
1,2-Dimyristoyl-sn-glycero-3-phosphoethanolamine/DMPE, 7 mg/35 wt%; and
1,2-distearoyl-sn-glycero-3-phosphoethanolamine-N-[amino(polyethylene glycol)]/DSPE-PEG-NH2, 2 mg/10 wt%)
and cholesterol (2 mg/10 wt%) dissolved in chloroform were mixed and dried in a round bottom flask and kept under vacuum for 2 hours, resulting in a thin solvent-free lipid film. Following this, they were rehydrated with a buffer solution (2-(N-morpholino)ethanesulfonic acid/MES and NaCl, 50:50 mM) containing 120 mM of ammonium sulfate under heating above the phase transition temperature. The suspension was then extruded down to 200 nm (mini-extruder, Avanti Polar Lipids) and dialyzed against buffer solution to remove unencapsulated ammonium sulfate. The vesicles were then actively loaded with doxorubicin following the procedure presented by Barenholz and colleagues [31]. Doxorubicin was added to the liposomes (lipid:DOX weight ratio = 10:1). The solution was then heated to 45°C for 90 minutes. Unencapsulated doxorubicin was then removed by size-exclusion chromatography (Sephadex G-25, 1 mL column).
2.2. Dynamic light scattering—measurements and reconstruction
Dynamic light scattering (DLS) measurements were performed at constant temperature (25 °C) using a commercial goniometer instrument (3D LS Spectrometer, LS Instruments AG, Switzerland). The primary beam was formed by a linearly polarized and collimated laser beam (HeNe, 632.8 nm, 21 mW), and the scattered light was collected by single-mode optical fibers equipped with integrated collimation optics. The collected light was coupled into two high-sensitivity APD detectors (Perkin Elmer, Single Photon Counting Module), and their outputs were fed into a two-channel multiple-tau correlator (Correlator.com). The signal-to-noise ratio was improved by cross-correlating these two channels.
The DLS spectrum reconstruction is based on particles observed and counted in cryo-TEM micrographs, and estimates the corresponding correlation function in the suspended state. The field auto-correlation function from uniform particles follows a negative exponential as a function of time
, (1)
where is the relaxation time corresponding to translational Brownian motion of the suspended particle. The relaxation time is a function of particle size:
where R is the hydrodynamic radius, the Boltzmann constant, the temperature, η the viscosity of
the solvent, the momentum transfer , the scattering angle, the wavelength of the
laser, and the refractive index of the solution.
Equation 1 can be extended for polydisperse particles, by considering that in a given sample each particle contributes to the scattering intensity, depending on its size. Therefore, the intensity-weighted correlation function can be approximated as
≅∑
∑ (3)
where and are respectively the volume and the correlation function corresponding to the jth particle.
2.3. Conventional and cryogenic transmission electron microscopy
Conventional and cryogenic electron microscopy was performed on a FEI Tecnai F20 transmission electron microscope operating at 200 kV. Additional TEM micrographs were acquired with a Philips CM100 transmission electron microscope operating at 80 kV. Sample solutions were dried on carbon-filmed copper mesh grids (400 mesh, Agar Scientific). For negative staining, 2 wt% of phosphotungstic acid were added to the nanoparticle solution prior to drying.
For cryogenic microscopy, five microliters of sample solution were pipetted on carbon-filmed holey copper grids (400 mesh, Agar Scientific). Excess liquid was carefully blotted away with filter paper (Whatman qualitative filter paper, grade 1). Following this, the samples were immediately plunge-frozen in a liquid ethane bath cooled by liquid nitrogen. For cryo-TEM investigation, the samples were mounted on a Gatan 626 cryo-holder (Gatan Inc.). Micrographs were recorded under low-dose conditions with defocus values varying between 0 and –5 μm.
All images were examined with ImageJ software (1.46r, http://imagej.nih.gov/ij). For the gold nanoparticles, the average NP size was determined by using the automated size distribution analysis tool. The plugin filtered the particles according to their contrast, size and circularity. The area-equivalent diameter was then determined assuming that the particles were spherical. For the lanthanide-containing PEG-PCL nanoparticles, the diameter was determined manually, as the contrast was too low for automated recognition.
Weber contrast values were acquired by manually selecting the polymeric nanoparticles. A circular region of interest of 616 pixels was drawn in the solid sphere, and the mean intensity recorded. This procedure was repeated, resulting in a dataset covering the intensity of 15 micelles for every setting. Furthermore, a random region of interest was drawn near the nanoparticles, which gave the background value.
3. Results and Discussion
3.1. Water as a surrounding medium
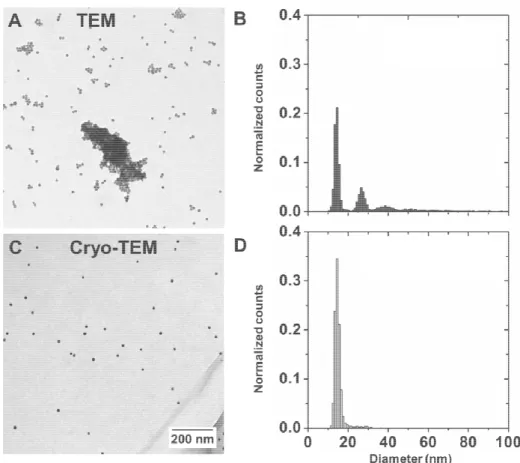
Gold nanoparticles may be considered as typical hard nanoparticles with diameters below the resolution limit of optical microscopes. When drying them on mesh grids for subsequent TEM analysis, many additional forces bear down on them. With the evaporation of water, van der Waals forces become dominant, and processes originating in surface tension gradient result in the accumulation of the nanospheres at the rim of the droplet [32]. As shown in Figure 1A, the outcome is a random deposition of both single and aggregated spheres. These drying-induced aggregates yield false interpretations in terms of nanosphere size and polydispersity, as is evidenced by the automated size distribution analysis in Figure 1B. By trapping the gold nanospheres between a thin layer of amorphous ice (Figure 1C), the necessity of drying and dehydrating them is omitted. The nanospheres remain randomly dispersed and the size, polydispersity and degree of aggregation can be accurately assessed (Figure 1D). The suspending medium remains a component of the specimen, and its importance and contribution to overall nanoparticle presentation is immediately recognizable [33].
Figure 1. Gold nanoparticles visualized by transmission electron microscopy. Drying nanoparticles on respective grids may lead to aggregation and flocculation (A). In cryo-TEM, the same sample appears monodisperse with no sign of agglomeration (C). These observations are reflected in the respective automated size distribution analysis (B, n = 3549/D, n = 1492).
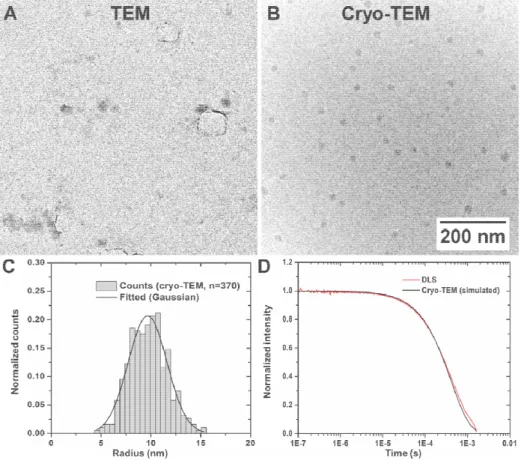
Water-based soft nanoparticles (e.g. lipo-/polymersomes or micelles) [34] are even more delicate, as their size, structure and morphology are directly determined by the environment. Changing surrounding parameters—such as the ionic strength of the buffer solution, which occurs during water evaporation [23]—might induce changes in shape and size, or even lead to a total breakdown of the nanoparticle. In this context, polymeric PEG-PCL block copolymers containing lanthanide ions are model particles, as they are dependent on water as a surrounding medium in order to self-assemble into nanostructures. Visualizing them by conventional TEM is prone to misinterpretation. Distinguishing and identifying such small particles is often not possible (Figure 2A), as the combination of low contrast and drying artifacts is too substantial to be overseen.
Figure 2. Investigating soft polymeric nanoparticles by conventional and cryo-TEM. When dried on TEM grids, small lanthanide-containing PEG-PCL micelles are barely distinguishable from the background (A). They however are easily recognizable in their native environment (B). The measured core size (C)—when used to reconstruct a DLS spectrum —is consistent with actual in situ data (D).
In opposition to this, the cryo-TEM sample remains hydrated and the structural integrity is preserved. The structures are immediately recognizable and distinguishable from common artifacts known to appear in cryo-TEM (e.g. such as ethane or ice contamination, Suppl. Figure 1). Qualitative and accurate information on the core size of the nanoparticles in question may be obtained by cryo-TEM, yet arduous to conduct (i.e., many micrographs are required to reach statistical significance). Moreover, a summarizing size distribution determination is highly dependent on the amorphous ice. The varying ice thickness within the investigated areas might lead to skewed frequency values: Large
nanoparticles generally accumulate close to the edge of the grid, where the vitreous layer may be too thick for imaging. This leads to an asymmetric sample distribution. Especially in polydisperse suspensions, determining the true weighted size distribution is challenging. Although this factor is negligible in this particular scenario, complementary techniques are still needed to provide a more global overview. In this regard, dynamic light scattering (DLS) is a method of choice. The size distribution measured by cryo-TEM—when used to simulate a DLS scattering spectrum—is well in agreement with actual experimentally data recorded in situ (Figure 2C/D). In turn, DLS compensates for the lack of quantitative data and statistical relevance provided by direct visualization methods [35], and thus provides a more global impression on the number-weighted size distribution.
3.2. Water as a structural component
Although DLS provides a statistically more relevant perspective of the matter, it is limited by one significant attribute common to synthetic polymers and nanoparticles: They are often polydisperse and heterogenous. The variations in polymers, chain lengths, polymorphism and preparation methods make generalizations of materials particularly delicate. Although DLS is widely used, size, polydispersity and/or coexisting morphologies are factors which complicate data analysis. The missing information still has to be assessed visually.
In many cases, water is not only a suspending medium, but also an integral component of the nanoparticle itself. In vesicles, this fact is incontestable, as they are supported by an aqueous core. Removing this central component compromises the structural integrity and promotes either partial or total collapse of the fragile structure. Interpretation then becomes arduous, as critical structural information is concealed. In conventional TEM, lanthanide-containing PEG-PCL nanoparticles look —as expected—like solid spheres (Figure 3A). The contrast seems strong enough to characterize them in detail (Figure 3C/E), and no irregular morphological variations or artifacts are apparent. This observation however is misleading. Investigations of the same samples by cryo-TEM show another picture (Figure 3B): The structures are only solid spheres below a critical diameter (Figure 3D), whereas above this limit they become vesicular (Figure 3F). This is apparent through the lower contrast in the center of the nanoparticle. In comparison to nanoparticles of similar sizes observed by conventional TEM, the difference is substantial. When dried, the vesicles lose their central component, and the core structural information is lost.
3.3. Generating sufficient contrast for soft nanoparticles
Sufficient contrast is a requirement to investigate a sample. Amplitude contrast originates from elastic and inelastic scattering by the specimen atoms, and phase contrast by the phase shifts of the individual electrons during their transition through the sample.
In general, imaging soft nanoparticles or biomacromolecules suffers from the low contrast of the polymer backbones, as they are usually composed of low Z-number elements (e.g. C, H, N and O). The amplitude contrast (or mass thickness contrast) is thus very low. However, the dehydration step alone may artificially increase the amplitude contrast by the higher material density of the collapsed structures, as observed in Figure 3. Another approach to circumvent this limitation is by using a staining agent to increase the background contrast. PTA is a widely used candidate and composed of atoms with high atomic numbers (i.e., tungsten, Z = 74 versus carbon, Z = 6). As a
result, the amplitude contrast is significantly higher at the edges where the agent deposits. Yet, this approach might alter the sample as well. For the presented PEG-PCL system, it has been reported that variations in pH and salt concentration may change the solvation of PEG, and might therefore influence the thermodynamically favored state [17,24]. When even more complex systems are used—such as self-assembled structures containing metal ligands [27]—the stability of the metal complex has to be considered too. As shown in Figure 2, small polymeric nanoparticles generate little to no contrast, and thus need additional treatments to become visible.
Figure 3. Vital structural information concealed in conventional TEM can be assessed in cryogenic mode. When dried on TEM grids, large lanthanide-containing PEG-PCL structures unanimously appear as spherical particles (A/C/E). When investigated by cryo-TEM however (B), both solid spheres (D) and core-shell structures (F) are distinguishable, with a structural transition around 47 nm in diameter.
PTA concentrations of 2 wt% are usually used to visualize such PEG-PCL nanoparticles. Unfortunately, the addition of 2 wt% PTA, a standard concentration used for staining, already induces morphological changes, which are even visible by eye (Figure 4B): The change in turbidity shows that the stability of the original suspension is compromised. DLS measurements confirm a significant change in nanoparticle size and distribution (Suppl. Information). Moreover, such staining agents affect the physicochemical properties. Lanthanide-containing PEG-PCL nanoparticles are luminescent at neutral pH in aqueous media (Figure 4C, left). This effect is entirely quenched by the PTA (Figure 4C, right). This indicates that the coordination between the lanthanide ion and the ligand is affected by addition of the acid. The protonation of the carboxylic acids of the ligand leads
to hydrolysis of the complex and coordination of water to the metal center, which in turn quenches the luminescence of the lanthanides (Figure 4D). Moreover, basic or acidic pH might degrade the structure. Therefore, alternative procedures relying on chemical agents that cause a pH change (e.g. cryo-negative staining [36]) are often unusable in regard to these kinds of self-assembled nanoparticles.
Figure 4. Staining agents may significantly alter polymeric macromolecular structures. Lanthanide-containing PEG-PCL nanoparticles rely on the coordination between lanthanide and ligand (A). Phosphotungstic acid disturbs this association (A). The addition of 2 wt% PTA induces visible changes to the turbidity of the nanoparticle solution (B). When placed under a UV lamp (C), no more fluorescence is visible, and the excitation and emission spectra are significantly altered (D).
In this regard, contrast can be modulated by the phase: Electrons scattered by the specimen are characterized by longer path lengths compared to non-scattered electrons and this path length difference yields a phase contrast. Phase contrast increases with objective lens defocus and spherical lens aberration, at the cost of spatial resolution. For macromolecular structures however, phase contrast needs to be exploited to a maximum degree. As seen in Figure 5A–D, high defocus settings are actually needed to see them. The consequence however is a loss in resolution, making the
distinction of nanoscale structural properties perplexing. Microstructural properties however can be elucidated to a very large degree.
Figure 5. Phase contrast generation by modulating the defocus settings. When at focus (0 μm), the micrograph appears blurred and homogeneous (A). However, when moving away from focus (B), phase contrast is increased, structural properties become prominent. At higher defocus settings, the edges of the nanoparticles are clearly visible (C/D).
Figure 6. The electron beam and its effects on fragile biostructures. When imaged at low electron doses, doxorubicin-loaded liposomes (A) appear round and with generally low contrast. However, ongoing irradiation alters surface and contrast (B), and higher doses lead to bubbling effects (C/D).
Although cryogenic imaging is usually performed under low-dose conditions (i.e., when the image is previously focused on another area of interest), sensitive materials are still prone to be damaged by the electron beam. Especially organic structures and soft nanoparticles exhibit a particular sensitivity to high-energy electron irradiation. Liposomes (Figure 6A) are general examples: Under ideal conditions, even the lipid bilayer, which is usually less than 10 nm in thickness, can be resolved owing to the phase and amplitude contrast attributed to phosphorus atoms (Z = 15) in the lipid heads [37]. Additional radiation increasingly causes deterioration of the sample, as more and more electrons interact and transfer energy to its molecules. Contrast is enhanced, but at the expense of losing structural details. Bubbling effects become visible at even higher dose levels (Figure 6C/D). In addition to radiolysis and cross-linking, the sample is heated up, which in turn
leads to significant damage to the vitreous layer. Although it is always tempting to pick a higher contrast, the sample is clearly damaged.
4. Conclusion
Nanoparticle synthesis and self-assembly are generally very delicate processes and the outcomes vary considerably between nanoparticle batches, operators and groups. Therefore, accurate and precise characterization is critical. Keeping in mind the limitations, challenges, indicators and benefits is thus paramount. In regard to polymeric macromolecules, the principal challenge lies within visualizing without damaging them, either by respecting their natural environment or keeping them minimally exposed to disrupting factors. Cryo-TEM is a reliable tool in this regard, yet not a redeemer. Correctly interpreting the data and recognizing the various effects, optical, physical or chemical, is not to be underestimated. The authors hope that the presented examples can assist in this task.
Acknowledgements
The authors thank Dr. Laura Lorenzo-Rodriguez for providing the gold nanoparticles. This work was supported by the Swiss National Science Foundation (126104, PP00P2-123373/1, 200021_140723/1 and PP00P2133597/1) and the Adolphe Merkle Foundation. The support of the Dr. Alfred Bretscher Fund is gratefully acknowledged, and access to TEM was kindly provided by the Microscopy Imaging Centre of the University of Bern. Sandor Balog and Dimitri Vanhecke acknowledge the financial support of the Swiss National Science Foundation through the National Centre of Competence in Research Bio-Inspired Materials.
Conflict of Interest
The authors declare no competing financial interest.
References
1. Nanotechnologies—Terminology and Definitions for Nano-objects—Nanoparticle, Nanofibre and Nanoplate (2008) International Organization for Standardization Geneva, Switzerland.
2. Wagner V, Dullaart A, Bock A-K, et al. (2006) The emerging nanomedicine landscape. Nat
Biotechnol 24: 1211–1217.
3. Cao Q, Rogers JA (2009) Ultrathin Films of Single-Walled Carbon Nanotubes for Electronics and Sensors: A Review of Fundamental and Applied Aspects. Adv Mater 21: 29–53.
4. Rao C, Cheetham A (2001) Science and technology of nanomaterials: current status and future prospects. J Mater Chem 11: 2887–2894.
5. Brinkhuis RP, Rutjes FP, van Hest JC (2011) Polymeric vesicles in biomedical applications. Pol
6. Du Z-X, Xu J-T, Fan Z-Q (2007) Micellar morphologies of poly (ε-caprolactone)-b-poly (ethylene oxide) block copolymers in water with a crystalline core. Macromolecules 40: 7633– 7637.
7. Du ZX, Xu JT, Fan ZQ (2008) Regulation of Micellar Morphology of PCL-b-PEO Block Copolymers by Crystallization Temperature. Macromol Rapid Comm 29: 467–471.
8. Giacomelli C, Borsali R (2006) Morphology of Poly (ethylene oxide)-block-Polycaprolatone Block Copolymer Micelles Controlled via the Preparation Method. Wiley Online Library 147– 153.
9. Ghoroghchian PP, Li G, Levine DH, et al. (2006) Bioresorbable vesicles formed through spontaneous self-assembly of amphiphilic poly (ethylene oxide)-block-polycaprolactone.
Macromolecules 39: 1673–1675.
10. Blanazs A, Armes SP, Ryan AJ (2009) Self-assembled block copolymer aggregates: from micelles to vesicles and their biological applications. Macromol Rapid Comm 30: 267–277.
11. Renggli K, Baumann P, Langowska K, et al. (2011) Selective and responsive nanoreactors. Adv
Funct Mater 21: 1241–1259.
12. Graff A, Winterhalter M, Meier W (2001) Nanoreactors from polymer-stabilized liposomes.
Langmuir 17: 919–923.
13. Nardin C, Widmer J, Winterhalter M, et al. (2001) Amphiphilic block copolymer nanocontainers as bioreactors. Eur Phys J E 4: 403–410.
14. Israelachvili JN, Mitchell DJ, Ninham BW (1976) Theory of self-assembly of hydrocarbon amphiphiles into micelles and bilayers. J Chem Soc, Faraday Transactions 2: Molecular Chem
Phys 72: 1525–1568.
15. Brinker CJ, Lu Y, Sellinger A, et al. (1999) Evaporation-induced self-assembly: nanostructures made easy. Adv Mater 11: 579–585.
16. He WN, Xu JT, Du BY, et al. (2010) Inorganic-Salt-Induced Morphological Transformation of Semicrystalline Micelles of PCL-b-PEO Block Copolymer in Aqueous Solution. Macromol
Chem Phys 211: 1909–1916.
17. He WN, Xu JT, Du BY, et al. (2012) Effect of pH on the Micellar Morphology of Semicrystalline PCL-b-PEO Block Copolymers in Aqueous Solution. Macromol Chem Phys 213: 952–964.
18. Egelhaaf S, Müller M, Schurtenberger P (1998) Size determination of polymer-like micelles using cryo-electron microscopy. Langmuir 14: 4345–4349.
19. Hao X, Kuang C, Gu Z, et al. (2013) From microscopy to nanoscopy via visible light. Light:
Science Applications 2: e108.
20. Shtengel G, Galbraith JA, Galbraith CG, et al. (2009) Interferometric fluorescent super-resolution microscopy resolves 3D cellular ultrastructure. P Natl Acad Sci U S A 106: 3125–3130.
21. Fernández-Suárez M, Ting AY (2008) Fluorescent probes for super-resolution imaging in living cells. Nat Rev Mol Cell Bio 9: 929–943.
22. McMullan G, Faruqi A (2008) Electron microscope imaging of single particles using the Medipix2 detector. Nucl Instrum Methods Phys Res A 591: 129–133.
23. Massover WH (2008) On the experimental use of light metal salts for negative staining. Microsc
Microanal 14: 126–137.
24. He Y, Li Z, Simone P, et al. (2006) Self-assembly of block copolymer micelles in an ionic liquid.
25. Oguchi K, Sanui K, Ogata N, et al. (1990) Relationship between electron sensitivity and chemical structures of polymers as electron beam resist. VII: Electron sensitivity of vinyl polymers containing pendant 1, 3-dioxolan groups. Pol Eng Sci30: 449–452.
26. Dubochet J, Adrian M, Chang J-J, et al. (1988) Cryo-electron microscopy of vitrified specimens.
Q Rev Biophys 21: 129–228.
27. Thévenaz DC, Monnier CA, Balog S, et al. (2014) Luminescent Nanoparticles with Lanthanide-Containing Poly (ethylene glycol)–Poly (ε-caprolactone) Block Copolymers. Biomacromolecules 15: 3994–4001.
28. Eliseeva SV, Bünzli J-CG (2010) Lanthanide luminescence for functional materials and bio-sciences. Chem Soc Rev 39: 189–227.
29. Wang W, Lin J, Cai C, et al. (2015) Optical properties of amphiphilic copolymer-based self-assemblies. Eur Polym J.
30. Turkevich J, Cooper SP, Hillier J (1951) A study of the nucleation and growth processes in the synthesis of colloidal gold. Discuss Faraday Soc 11: 55–75.
31. Haran G, Cohen R, Bar LK, et al. (1993) Transmembrane ammonium sulfate gradients in liposomes produce efficient and stable entrapment of amphipathic weak bases.
BBA-Biomembranes 1151: 201–215.
32. Michen B, Geers C, Vanhecke D, et al. (2015) Avoiding drying-artifacts in transmission electron microscopy: Characterizing the size and colloidal state of nanoparticles. Sci Rep 5.
33. Hirsch V, Kinnear C, Rodriguez-Lorenzo L, et al. (2014) In vitro dosimetry of agglomerates.
Nanoscale 6: 7325–7331.
34. Dinu MV, Spulber M, Renggli K, et al. (2015) Macromol. Rapid Commun. 6/2015. Macromol
Rapid Comm 36: 576–576.
35. Egelhaaf S, Wehrli E, Adrian M, et al. (1996) Determination of the size distribution of lecithin liposomes: a comparative study using freeze fracture, cryoelectron microscopy and dynamic light scattering. J Microsc 184: 214–228.
36. Adrian M, Dubochet J, Fuller SD, et al. (1998) Cryo-negative staining. Micron 29: 145–160. 37. Bonnaud C, Monnier CA, Demurtas D, et al. (2014) Insertion of nanoparticle clusters into vesicle
bilayers. ACS nano 8: 3451–3460.
© 2015, Alke Petri-Fink, et al., licensee AIMS Press. This is an open access article distributed under the terms of the Creative
Commons Attribution License (http://creativecommons.org/licenses/by/4.0)