Controlling CRUD Vapor Chimney Formation in
LWRs Through Surface Modification
by Leigh Lin
B.S. Nuclear, Plasma, and Radiological Engineering University of Illinois at Urbana-Champaign, 2012
SUBMITTED TO THE DEPARTMENT OF NUCLEAR SCIENCE AND ENGINEERING IN PARTIAL FULFILLMENT OF THE REQUIREMENTS FOR
THE DEGREE OF
MASTER OF SCIENCE IN NUCLEAR SCIENCE AND ENGINEERING AT THE
MASSACHUSETTS INSTITUTE OF TECHNOLOGY SEPTEMBER 2014
@2014
Massachusetts Institute of Technology. All rights reserved.Signature of Author: Certified by: Certified by: Accepted by:
-Signature redacted
Leigh Lin Department of Nuclear Science and Engineering August 21, 2014Signature redacted
Michael P. Short Assistant Ir sor, Nuclear Science and Engineering Thesis Supervisor
Signature redacted
-
It
VJopo Buongiorno Associate Pror, Nuclear Snce and Engineering Thesis Reader
Signature redacted,
K>-
Mujid S. Kazimi TEPCO Professor 0Nuclear Engineering Chair, Department Committee on Graduate StudentsMASSACHUSETTS INITI E
OF TECHNOLOGY
Controlling CRUD Vapor Chimney Formation in
LWRs Through Surface Modification
by Leigh Lin
Submitted to the Department of Nuclear Science and Engineering on August 21, 2014, in Partial Fulfillment of the
Requirements for the Degree of Master of Science in Nuclear Science and Engineering
Abstract
Fouling has been a persistent problem for fluid-solid interfaces, varying from heat exchangers to ship hulls. In nuclear power plants, buildup of CRUD can accelerate corrosion, increase pressure drops, cause axial power shifts, and increase radiation dose to workers. In this experiment, we studied the effect of induced microcavity and micropost patterns on CRUD morphology at atmospheric pressure. Samples with various pitches of microcavities and microposts were boiled in simulated PWR coolant. The effect of heat flux on CRUD formation was also examined.
The experiments support previous theories that subcooled nucleate boiling is en-hanced at microcavities, and that CRUD deposition is promoted at those sites. A thin ring of particles, less than a micrometer in width, was seen around most microcavities even when the surrounding areas were crudded. However, some of the samples with microcavity pitches 50 pm and smaller experienced a pattern of clean and crudded areas, with the region around the microcavities free of CRUD more often than not. A theory is put forth that this is caused by interfering forces due to bubbles collapsing. The micropost samples showed substantial CRUD growth, particularly for the sam-ple subjected to a high heat flux. The results of this experiment could have major implications for development of a self-cleaning material for heated surfaces.
Thesis Supervisor: Michael P. Short
Title: Assistant Professor, Nuclear Science and Engineering
Thesis Reader: Jacopo Buongiorno
Acknowledgments
I wish to thank Professor Michael Short for being my advisor and providing me with vital insight and support I could not have done without. I have learned an incredible amount under his guidance in terms of both lab experience and life experience. I also wish to thank Professor Jacopo Buongiorno, whose expertise and feedback was crucial to this project's success.
I wish to acknowledge Ekaterina Paramonova and Gabrielle Ledoux, from whom I inherited this project. Without them taking the first steps into this experiment, I may not be here today.
Special thanks goes to Sangtae Kim, who prepared substrates for me over the entire year. Thanks also goes to Solomon Adera, who prepared the micropost sub-strates.
I would like to extend my gratitude and thanks to my colleague Pavlina Karafillis, without whose tireless help I would not have been able to work as efficiently or accomplish as much as I have. I owe special thanks to Vikash Mishra, who helped me greatly with data analysis and was always available for trading ideas. I am grateful to have been a part of the Short lab, which provided me with a great collaborative working environment, and would like to thank Daniel Schumaker in particular for his help.
I wish to thank my family and friends for their support in all that I do. I know I can count on them if I ever have any problems, large or small.
This work was performed in part at the Center for Nanoscale Systems (CNS), a member of the National Nanotechnology Infrastructure Network (NNIN), which is supported by the National Science Foundation under NSF award no. ECS-0335765. CNS is part of Harvard University.
Contents
1 Introduction 1.1 Effects of Fouling 1.2 1.3 1.1.1 Fouling-Accelerated Corrosion 1.1.2 Blockage . . . . 1.1.3 Heat Transfer . . . . Research Objectives. . . . . Sections . . . . 2 Background 2.1 Occurrence of Fouling. . . . . 2.1.1 Types of Fouling . . . . 2.1.2 Fouling in Nuclear Power Plant 2.1.3 Fouling of Other Heated Surfac 2.1.4 Fouling of Non-heated Surfaces 2.2 Fouling Models . . . . 2.3 Prevention and Mitigation . . . .19 . . . . 19 . . . . 20 . . . . 2 1 . . . . 22 . . . . 24 . . . . 24 27 . . . . 27 . . . . 32 s . . . . 33 es . . . . 36 . . . . 36 . . . . 37 . . . . 40
2.3.1 Fouling Mitigation by Controlling Operating 2.3.1.1 Controlling Fluid Chemistry . . . . 2.3.1.2 Flow Conditions and Heat Flux . . Conditions 2.3.2 Fouling Mitigation by Filtering and Cleaning . . . . 2.3.3 Fouling Mitigation by Material and Component Choices 2.3.3.1 System Design . . . . 2.3.3.2 Choice of Materials . . . . 2.3.4 Fouling Modification by Surface Modification . . . . 2.3.4.1 Surface Treatment and Coating . . . . 2.3.4.2 Microtexturing . . . . 2.4 Sum m ary . . . . . . . 40 . . . 40 . . . . 42 44 45 45 46 46 46 48 50
3 Experimental Methods
3.1 Materials and Materials Preparation 3.1.1 Sample Preparation . . . . .
3.1.2 PWR Water Simulant . . .
3.2 Experimental System . . . .
3.2.1 Boiling Facility . . . .
3.2.2 Electronic Control Box . . .
3.2.3 Datalogger . . . .
3.3 CRUD Growth Procedure... 3.3.1 Test Matrix . . . .
3.3.2 Boiling Procedure . . . .
3.4 Analyses . . . .
3.4.1 Tools for Analysis ... 3.4.1.1 SEM . . . . 3.4.1.2 FIB . . . .
3.4.2 Analysis Methods . . . . 4 Results
4.1 Logomatic Data Analysis . . . .
4.2 SEM Analysis . . . . 4.2.1
A 9
Pre-boiling SEM Analysis Pst-b i SEMN Anal sis
4... .y les . ... .Sam .. ...
4.2.2.1 Microcavity Samples, 1 Hour, 100 ppm. 4.2.2.2 Microcavity Samples, 1 Hour, 50 ppm 4.2.2.3 Control Samples, 24 Hours, 100 ppm . 4.2.2.4 Micropost Samples, 1 Hour, 100 ppm.
4.2.3 Post-boiling EDS Analysis . . . . 4.3 FIB Analysis . . . . 4.4 Image Analysis . . . .
5 Discussion
5.1 Effects of Surface Modification on CRUD Growth . . . 5.1.1 Microcavity Samples . . . . 5.1.2 Micropost Samples . . . . 5.2 Effect of Heat Flux on CRUD Growth . . . . 5.3 Effect on Performance . . . . 51 51 . . . . 5 1 . . . . 5 3 . . . . 5 4 . . . . 54 . . . . 5 7 . . . . 5 9 . . . . 6 2 . . . . 6 2 . . . . 6 3 . . . . 6 5 . . . . 6 5 . . . . 6 5 . . . . 6 7 . . . . 6 7 71 . . . . 7 1 . . . . 73 . . . . 73 . . . . 74 . . . . 74 . . . . 78 . . . . 80 . . . . 80 . . . . 82 . . . . 85 . . . . 88 91 . . . . 91 . . . . 91 96 . . . . 97 . . . . 98
6 Conclusion 101 6.1 Key Results ... ... 101 6.2 Future W ork . . . . 102
Bibliography 104
List of Figures
1-1 Blockage due to fouling. . . . . 22
2-1 Deposition under bubble [1]. . . . . 30
2-2 Simplified Pourbaix Diagram for iron in solution at 25 'C [2]. Iron tends to be in solution as anions naturally below a pH of 6-7. At a higher pH, iron oxides are the most stable form. . . . . 30
2-3 Various fouling deposition and removal mechanisms [31. . . . . 31
2-4 Deposit thickness over time [3]. . . . . 31
2-5 Wick boiling phenomena in CRUD layer [41. . . . . 39
2-6 Flow-assisted corrosion rate as a function of fluid velocity on a metal surface with a protective oxide layer [5]. . . . . 43
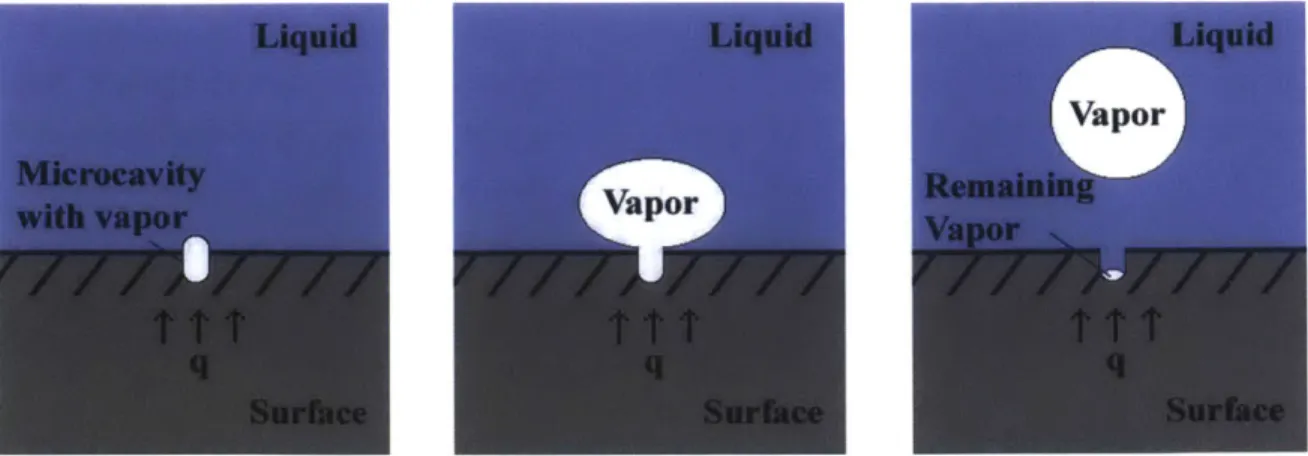
2-7 Bubble growth on heated surface with some vapor left in the micro-cavity after bubble departure. . . . . 49
3-1 Lithography process and silicon substrate after processing. . . . . 52
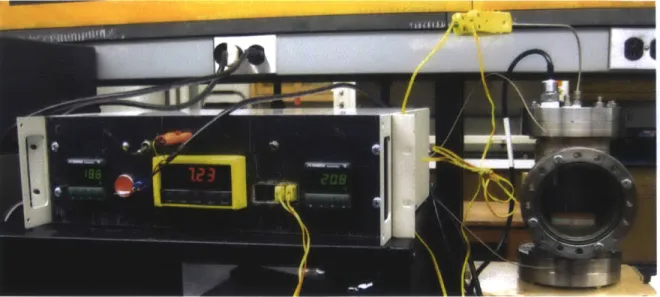
3-2 Photograph of boiling facility (right) and electronic control box (left). 54 3-3 3-D model of boiling facility internals . . . . 55
3-4 Electronic control box circuit diagram. . . . . 58
3-5 Thermocouple amplifiers circuit diagram. The inputs come from the sample and bath thermocouples in the boiling facility. Capacitors are used to filter out noise and smooth the output of the power supply. When switched on, the LED lights up to show that the circuit is work-ing. The amplified thermocouple (TC) output signals are the inputs for the logomatic. . . . . 60
3-6 Logomatic with carrier board and amplifier box. The banana plugs connect the power supply to the amplifier box. The sample and bath thermocouples from the boiling facility connect to the two standard K-type panel connectors. The outputs from the black amplifier box connect to the logomatic carrier board via BNC connectors. The logo-matic and carrier board have a LiPo battery and can also be powered via the USB connector. . . . . 61 3-7 FESEM Supra55VP. . . . . 66
4-1 Heat flux and sample temperature versus time for a sample with 30 Am pitch microcavities. It clearly shows the temperature rising and then staying at a constant temperature of around 140'C before dropping off as the sample heater is turned off at the end of the run. The heat flux matches the temperature. Heat flux increases with increasing temperature difference between the bottom of the sample and the top of the surface (which is exposed to coolant). . . . . 72 4-2 SEM images of microcavity and micropost samples before boiling. . . 73 4-3 SEM images of the process of using an OmniProbe needle to push a
large particle. . . . . 74 4-4 SEM images of two different control samples, both boiled for 1 hour
with coolant containing 100 ppm of Fe304 and NiO. All images are at the magnification of 1,080x. . . . . 75 4-5 Control sample boiled for 1 hour with coolant containing 100 ppm of
Fe304 and NiO. It shows a low amount of CRUD growth compared to some of the samples with induced microcavities. . . . . 75 4-6 SEM images of samples boiled for 1 hour with coolant containing 100
ppm of Fe30 4 and NiO, 10 ppm of H3B03, and 5 ppm of LiOH. All
im-ages are at the same magnification of 4,310 x, with each image showing an area of 70 pm x 52.5 pm . . . . . 76 4-7 SEM images of 30 pm microcavity pitch samples after boiling for 1
hour. They show conflicting results. Both images are at the magnifi-cation of 1,080x. . . . . 77 4-8 Measurement of large sedimentation particles on samples after boiling. 78 4-9 SEM images of 50 pm microcavity pitch sample boiled for 1 hour with
4-10 Samples boiled for 1 hour with coolant containing 50 ppm of Fe304
and NiO at magnifications of 1,080x. . . . . 79 4-11 SEM image of a 800 pm pitch microcavity sample boiled for 1 hour with
coolant containing 50 ppm of Fe30 4 and NiO. A modal phenomena was observed with alternating areas of more and less deposition. . . . . . 80 4-12 SEM image of one corner of a control sample after boiling that shows
some clean areas, around 5-10 pm wide, on the surface. This was not observed in the rest of the sample . . . . 81 4-13 SE images of control samples boiled for 24 hours with coolant
contain-ing 100 ppm of Fe304 and NiO. . . . . 82
4-14 Micropost samples after boiling for 1 hour with coolant containing 100 ppm of Fe304 and NiO. Both images are at a magnification of 1,080x. 83
4-15 SEM image of the region in the 6 pm tall micropost sample that had particles above the microposts, but no particles in the area beneath them. The surrounding regions have small particles both on top of the microposts and on the lower surface. The right side of the image that is devoid of particles is most likely where the rubber gasket was pressed down on the sample during boiling. . . . . 84 4-16 Area of thick CRUD growth near a microcavity that was used for EDS
analysis. . . . . 84 4-17 EDS spectrum of an area of thick CRUD growth near a microcavity.
An accelerating voltage of 18 kV was used and resulted in determining the presence of iron, nickel, oxygen, and silicon on the surface. .... 85 4-18 Image of a crystal structure that is present in some of the samples after
CRUD growth, most likely salt. . . . . 86 4-19 EDS spectrum of the foreign crystalline structure after growing CRUD
on a sample. Chlorine and potassium were present in addition to the expected elements. . . . . 86 4-20 Cross-sectional SEM images of 3 pm tall micropost after boiling. . . . 87 4-21 Circled areas of CRUD (red), sediments (yellow), and microcavities
(green) for a 30 pm microcavity pitch sample after boiling using Matlab. 89 4-22 Graphs of the percentage of clean and crudded areas on the sample as
a function of the microcavity pitch (blue circles). The control sample (orange triangle) was also included. Sediments and microcavities were excluded from the calculation of the clean and crudded areas. .... 90
5-1 A region of an 80 tim microcavity pitch sample with thick CRUD growth after boiling for 1 hour with coolant containing 100 ppm of Fe304 and NiO. Two red circles show where the vapor chimneys are
forming, about 7 pm apart. . . . . 94 5-2 SEM image of a 30 pm microcavity pitch sample after boiling for 1
hour with coolant containing 100 ppm of Fe30 4 and NiO. There is a ring of CRUD around the microcavities, though the surrounding area less than one micrometer away may be clean of CRUD. . . . . 95
List of Tables
1.1 Thermal conductivites for base metals and fouling deposits in LWRs. 23 2.1 General charactersitics of CRUD and vapor chimneys under sub-cooled
boiling conditions. . . . . 34 2.2 Antifoulant descriptions and examples of their use. . . . . 41 3.1 Microcavity pitches and microcavity density. . . . . 51 3.2 Test matrix of samples including the pitch (if microcavities or
micro-posts are present), boiling time (t), concentration of NiO and Fe3O4, average heat flux, average heat flux standard deviation (std. dev.), pH, and notes on any anomalies during the runs. . . . . 64
List of Abbreviations and Symbols
Abbreviations
APS Average Particle Size BWR Boiling Water Reactor CHF Critical Heat Flux
CIPS CRUD-Induced Power Shift CNS Center for Nanoscale Systems CRUD Chalk River Unidentified Deposits EDS Energy Dispersive X-ray Analysis EHT Extra High Voltage
FAC Flow-Assisted Corrosion
FESEM Field Emission Scanning Electron Microscope FIB Focused Ion Beam
LWR Light Water Reactor
MIT Massachusetts Institute of Technology ppm parts per million
PWR Pressurized Water Reactor SEM Scanning Electron Microscope
TC Thermocouple
Symbols a Cb Cbf CS Csf d D e E F FHYD FL h Jt kB
kt mass transfer coefficient for precursor
ktf mass transfer coefficient for foulant
K hydrophobic repulsion force
I pipe length 10 orientational correlation length no ion density R S t T particle radius
precursor conc. in fluid foulant conc. in the fluid
precursor conc. at the fluid/solid interface foulant conc. in the fluid/solid interface distance pipe diameter electron charge activation energy shear stress hydration force lift force
surface-surface sep. between particles
mass flux of precursor Boltzmann's constant
universal gas constant sticking probability
time temperature
surface temperature
velocity
flow velocity at particle friction velocity saltation friction velocity
van der Waals force electrostatic double-layer
force
fouling deposit thickness electron number
reduced surface potential Debye-Huckel-reciprocal
length viscosity
fluid density
deposit density wall shear stress
potential U UP V Vmin VA VR yf z -y K 77 p P1 T
4,
Chapter 1
Introduction
1.1
Effects of Fouling
Many systems with fluid-solid interfaces, both engineered and natural, persistently suffer from the effects of fouling. Fouling occurs when particles or microbes build up as solid or porous deposits in unwanted areas, causing problems by enhancing corrosion of the surface, increasing the pressure drop or completely blocking flow in the system, and affecting heat transfer. A study by Garrett-Price estimated that the overall cost of fouling for the US was $9 billion/year in 1985 dollars [1]. Van Nostrand, Leach, and Haluska performed a study on the economic impact of fouling in heat transfer equipment in refineries and estimated that the expenses from energy cost, production losses, and maintenance and cleaning costs was around $1,300 million/year in 1981 dollars [6].
The problems due to fouling can increase capital costs if components need to be made larger or more complex to offset deleterious effects. Sometimes backup com-ponents are desirable to keep the process on-line while parts are cleaned, and those increase the capital cost as well. Additional piping may be necessary if the component needs to be moved to a different location for easy access due to more frequent main-tenance. Operating costs increase from needing more power to get the same quality product, should heat transfer or coolant flow be reduced by fouling. Maintenance costs also increase due to a higher replacement frequency of components and clean-ing. Another major factor to consider is the loss of production when the process has to shut down for cleaning or replacement of fouled components, for example, when crude oil refineries must remove and replace a heat exchanger due to fouling. Much effort has been spent on finding ways to prevent fouling or mitigate the the effects of fouling and some remedial actions have been found to be cost-effective [1, 6].
In the nuclear industry in particular, a major concern has been the deposition of corrosion products on cladding surfaces, known as Chalk River Unidentified Deposits (CRUD) from its discovery in the Chalk River research reactor. These deposits are mainly made up of iron and nickel oxide particles about 0.1 to 2 pm in diameter [7, 81, carried by the coolant from the steam generator tubes, from other stainless steel reactor internals, or from the grid spacers holding the fuel rods in place [9, 101. In pressurized water reactors (PWRs), most deposits are nickel ferrites (NixFe3-xO 4)
with a small amount of cobalt, NiO, Ni metal, and some iron and nickel chromites (FeCr204, NiCr204, and NixFe>-Cr204) [111. In boiling water reactors (BWRs), the
predominate form of the CRUD is hematite (Fe2O3) and non-stoichiometric nickel
ferrite spinels [7]. Generally, the CRUD consists of an inner, tightly adherent layer that has relatively higher amounts of chromium from the base metal, and is depleted in iron and nickel. The outer layer is mostly nickel ferrite, which is more soluble and easily affected by chemistry variations (e.g., during shutdown) [11, 12, 8].
CRUD in reactors has been observed to grow as thick as 100 pm [13]. It can locally increase cladding temperatures, accelerate corrosion, and lead to undesired axial power shifts. Alternatively, CRUD deposits have the potential to increase heat transfer from the fuel cladding to the water coolant through enhanced boiling, under the right conditions. Increased heat transfer efficiency is desirable in nuclear reactors because it delays when the critical heat flux (CHF) occurs, thereby increasing the thermal margins and the safety of the reactor[14].
1.1.1 Fouling-Accelerated Corrosion
Fouling in systems can lead to or accelerate corrosion of the surface, resulting in failures of major equipment and components. Corrosion occurs when there is an electrochemical oxidation, and uniform corrosion tends to speed up with increasing temperature. When different metals are in solution, there is an exchange of electrons due to a difference in electrochemical potential. Corrosion and corrosion rates are also affected by heat flux, alloy impurities, solute size and composition, surface material microstructure, and fluid chemistry.
Fouling can enhance corrosion by increasing the surface temperature, due to ad-ditional thermal resistance, and by bringing together dissimilar materials [15]. Under certain conditions, some metal cations will undergo hydrolysis when in the presence of water, reducing pH locally, and resulting in an autocatalytic mechanism for local corrosion. Fouling can enhance pitting corrosion because corrosion deposits like
cop-per, iron, and nickel oxides are electrically conductive and serve as the cathode for the corrosion reaction. The fouling layer is rough, providing more bubble nucleation sites and a higher pressure drop as the fluid flows across it. This, combined with high temperatures, can increase cavitation, where bubbles collapsing on the surface erode it [5].
Increased cprrosion due to fouling is a problem in chemical processing industries, particularly in welded areas; the oil and gas industry, where sulfate-reducing bacteria are a large problem; water treatment plants; and underground pipelines, which have to deal with decaying organic matter in the soil [5]. Biological fouling can increase corrosion by depleting oxygen at the surface and by producing carbon dioxide (which becomes carbonic acid), hydrogen sulfide, or other corrosive organic acids. Biofilms catalyze the reduction of oxygen, increasing corrosion potential. Macrofouling can create a differential aeration cell where there is free charge transfer, but limited mass transfer, causing polarization differences [5]. Sometimes the areas covered by mi-croorganisms are actually more protected from corrosion by preventing oxygen from reaching the surface, though the exposed areas may then be in conditions that accel-erate corrosion [16, 61.
In nuclear power plants, CRUD increases local temperature, thereby promoting local corrosion and can damage the fuel cladding to the point of rupture, releasing radioactive material into the coolant. The percentage of failures due to corrosion from CRUD in PWRs is low, but CRUD induced localized corrosion (CILC) was a major cause of fuel failures in BWRs [9]. This was, in part, due to the copper present in the brass condenser tubes in BWRs, which resulted in a dense, tightly adherent CRUD, as well as vapor chimneys being blocked by high amounts of copper and zinc in the coolant. There were especially high failure rates in 1998 and 2003 from corrosion and CRUD, accounting for as much as 45% of the total fuel failures in BWRs. Since limiting the amount of copper concentration, heat treating the cladding for better corrosion resistance, and through careful water chemistry monitoring, there have been no further failures from CILC. In comparison, the corr6sion in PWRs is more uniform and CILC is less of a problem [9].
1.1.2
Blockage
Buildup of deposits in systems can increase the pressure drop in the system or result in a complete blockage of passageways in the most severe cases (see Figure 1-1 ).
(a) Zebra mussels completely clogging a pipe (b) Calcium carbonate deposits in condenser
1171. tubes at South Texas Project nuclear power
plant [181.
Figure 1-1: Blockage due to fouling.
than the clean surface, both of which contribute to an increased pressure drop [6]. Systems that need a certain fluid flow need to make up for this pressure drop by increasing the pumping power, which costs energy and money. If the fouling layer is not removed, fluid flow could ultimately be completely blocked.
Some PWR plants suffered a pressure drop in the secondary-side steam generator that resulted in a 4-5% reduction in electrical generating capacity. San Onofre Unit 2 experienced a cumulative pressure drop of 0.41 MPa due to fouling in the 1990's until chemical cleaning of the steam generators took place. The average CRUD thickness was approximately 0.25 mm before cleaning [191. In one plant with air inleakage, heavy CRUD deposition increased the differential pressure in the core by 15% [11]. Macbeth performed experiments on pressure drop due to CRUD buildup using an annular test section with water at 69 bar (6.9 MPa). He found a frictional pressure
drop of 0.46-1.72 bar (0.046-0.172 MPa) for CRUD thicknesses of 30-150 pm 120].
1.1.3 Heat Transfer
Heat transfer is a major element in power generation and many chemical and manu-facturing processes. A thick layer of deposits adds thermal resistance to the system, increasing local temperatures and reducing the efficiency of the system. The fouling layer usually has a lower thermal conductivity than the surface material. Tablel.1 lists some thermal conductivites for CRUD and common construction materials found in PWRs and BWRs. In the past, boilers have exploded due to scaling reducing the
Material Thermal Conductivity Ref. (W/m-K)
CRUD 1.2-4.5 [21, 22, 23]
CRUD with 66.6% porosity' 0.7-0.9 [21, 22, 241
Alloy 600 15-192 [25, 26]
Alloy 690 13.5-17.32 [25, 26]
Alloy 800 11.5-16.32 [25, 261
Stainless Steel 304 and 316 15-16 [27, 281
1This is the effective thermal conductivity.
2
Lower value is at 200C and higher value is at 300 *C.
Table 1.1: Thermal conductivites for base metals and fouling deposits in LWRs.
heat transfer coefficient and leading to overheating, but pressure vessel codes have since been implemented to prevent this [6].
The presence of a thick CRUD layer can increase temperature gradients, but if it is porous and thin enough (less than 20-30 pm), its thermal resistance will be negligible, and it may actually improve heat transfer and delay CHF [14, 22, 29]. The liquid in the CRUD layer experiences higher temperatures and can evaporate before the bulk coolant temperature reaches its boiling point. If vapor chimneys are present in the CRUD layer, the vapor can escape through these channels. There have been several studies and models developed on enhanced heat transfer through the wick boiling phenomenon [22, 30, 13].
One of the most efficient modes of heat transfer is through subcooled nucleate boiling, before the critical heat flux (CHF) is reached. The onset of nucleate boiling (ONB) for water at atmospheric pressure occurs around a heat flux of 104 W/m2 and the CHF occurs at 2x 10⁶ W/m2 for pool boiling [31]. Thermal power plants would
ideally operate as close to the CHF as possible to transfer the maximum amount of heat, but there are safety margins imposed to ensure the plant stays below the CHF. In PWRs, the departure from nucleate boiling ratio is required to be greater than 1.3, and in BWRs, the critical power ratio must be greater than 1.2 in the US. Dryout is more significant if thick CRUD is present since CRUD has a lower thermal conductivity than the cladding. Under PWR conditions, a CRUD thickness greater than 75 microns is in danger of dryout [29].
1.2
Research Objectives
The objective of this thesis is to evaluate the effect of induced microcavities and induced microposts on the formation of vapor chimneys in the CRUD layer. The bulk of the silicon substrate surfaces were lithographically etched with regular arrays of micrometer-sized holes, and a couple of the silicon substrates had micropillars deposited on them. The pitches between the microcavities and microposts were varied to determine what role, if any, the density of these sites have on CRUD formation and chimney density in a heated system. Besides pitch, nickel oxide and iron oxide concentrations were changed and boiling time was changed to see their effects on CRUD growth. Fouling has been identified as one of the major problems in heat exchangers and other systems for a long time, but still remains a problem today. If introducing defects, like microcavities, onto a surface is shown to promote boiling chimney formation, it will have important implications on controlling the formation of fouling layers and enhancing heat transfer efficiency.
1.3
Sections
Chapter 2 presents background information on the problems that arise from fouling, the types of fouling, and some of the potential solutions to prevent or mitigate foul-ing and its effects. The forces behind foulfoul-ing and the effects of fluid velocity, heat flux, and coolant chemistry on fouling rate are described. Various types of fouling are discussed, including crystallization, particulate, biological, chemical, and corro-sion fouling. Different models of fouling are covered and fouling in both heated and unheated systems are discussed, with a focus on CRUD in nuclear power plants. Pre-vention of fouling, through elimination of its percursors or inhibiting adhesion of the precursors to the surface, is discussed. Mitigating the detrimental effects of foul-ing is covered, includfoul-ing methods to remove the foulfoul-ing layer, reduce corrosion, and counteract decreased heat transfer and pressure drop.
Chapter 3 describes the experimental methods for preparing the samples, the experimental setup, the procedure for artificially growing CRUD, and the tools and methods for analyzing the samples. The microfabrication process for preparing the grid of microcavities or microposts on the surface of silicon substrates is explained. A description of the boiling facility, electronic controls, and data logging system is given. The tools used for analysis are briefly described, which include the scanning electron microscope (SEM) and the focused ion beam (FIB). Lastly, the methods of
analyzing the effect of microcavities on the fouling layer are presented.
Chapter 4 contains the results of the experiment. SEM images of samples with induced microcavities and microposts both before and after CRUD growth are shown. Runs with different parameters, including defect pitch, particle concentration in the coolant, and boiling time, are presented for comparison. Elemental Dispersive X-ray Analysis (EDS) results are shown alongside the SEM images. A cross-sectional view of samples that were milled using the FIB is also presented.
Chapter 5 discusses the results of the surface texturing on the formation of vapor chimneys on the substrates. The amount of CRUD deposition depending on micro-cavity pitch and micropost height and pitch is discussed in terms of the results seen using the SEM and FIB. The role of heat flux on boiling and vapor chimney formation are be discussed. The limitations of this experiment and potential improvements to the process are given. The effect these results have on nuclear reactor performance is
also examined.
Chapter 6 contains a brief summary and the conclusions of the study. The key findings from this experiment are reviewed. Future work for evaluating and optimizing surface texturing for anti-fouling purposes in nuclear reactors are also considered. Further testing and changes in test conditions for examining vapor chimney formation and CRUD growth are discussed.
Chapter 2
Background
2.1
Occurrence of Fouling
Fouling occurs when particles or microorganisms are carried to the surface and then accumulate or adhere to the surface. The adhesion of particles depends on London-van der Waals forces, electrostatic forces, and contact area. Other factors affecting the deposition of particles are particle sizes and amounts, pH, gravitational forces, hydrodynamic interactions, surface hydration and reactions, fluid velocity, and heat flux.
The mass flux of a foulant precursor J (in units of kg/m2/s) to the surface is
given by [61:
Jt = kt (Cb - C.) (2.1)
where k is the mass transfer coefficient for the foulant precursor, Cb is the con-centration of the precursor in the fluid, and C. is the concon-centration of the precursor at the fluid/solid interface. The mass flux of the foulant back to the fluid is [61:
Jf = ktf (Csf -Cbf) (2.2)
where ktf is the mass transfer coefficient for foulant convection, Cf is the concen-tration of the foulant in the fluid, and Cbf is the concenconcen-tration of the foulant in the fluid. The complete mass transfer of the foulant df (in units of m/s) is given by [61:
dt
dyf _ (J - Jf) (23)
dt pf
The fouling layer tends to increase with increasing flow rate for laminar flow since more particles are transported to the surface, but decreases when there is tur-bulent flow. Studies have shown that turtur-bulent flow, which results in non-uniform shear stresses at the surface, is better at removing fouling layers than uniform flow [32]. Rougher surfaces experience more fouling due to increased turbulence near the fluid/solid interface, but also due to more surface area being available for bonding and foulants in valleys being harder to remove [33, 341. The ratio of adhesion to shear stress can be represented by the sticking probability S [6]:
= exp (-E/RT) (2.4)
(V/Vmin) 2
where E is the activation energy, R is the universal gas constant, T. is the surface temperature, v is the friction velocity, and Vmin is the saltation friction velocity. The saltation velocity is the minimum velocity needed to maintain particle flow, just before the particles begin to fall out of suspension [351. The shear stress F on the wall of a pipe is given by [1]:
F = T7rDl (2.5)
where T is the wall shear stress per unit length, D is the pipe diameter, and 1 is the length of the pipe.
Repulsive van der Waals and electrostatic double-layer forces limit deposition and can be controlled, to some extent, through the choice of fluid, use of surface coatings, or by increasing the pH [7, 36, 1]. The van der Waals interaction force VA between two spherical particles is [37, 38]:
VA(d) _ + + In 1 (26)
6 d2 + 4ad (d + 2a2) (d + 2a)2
where d is the interparticle distance and a is the particle radius. The Hamaker constant AH is a material property that describes the forces between bodies. A material that is more electron-dense has a higher Hamaker constant [6]. The van der Waals forces between a spherical particle and a plane is [37, 38]:
AH [a a (d )]
VA(d) = - + - + 1n (2.7)
6 d d+2a d + a
Materials in aqueous solutions become charged due to dissociation of molecules or preferential adsorption of ions [11. When two identical particles approach each other, they repel each other due to their surface charges. The electrostatic double-layer force
VR is given by [39, 371:
VR=1281raiaVy = 2 7-y2 2nokBT
exp (-Kh) (2.8)
VR (a, + a2) K2 Y
where a1 and a2 are the radii of the first and second particle, no, is the ion density
in the bulk coolant, kB is Boltzmann's constant, T is the absolute temperature, and h is the surface-surface separation between particles. The Debye-Huckel-reciprocal length n is the inverse length of the range of influence of the ion atmosphere. The reduced surface potentials, denoted as 7y and y2, is defined by [39, 37]:
7=tanh( e,2) (2.9)
4r.T
where z is the electron number, e is the electron charge, and 0 is the potential. Hydration forces FHYD also effect the attraction or repulsion between particles and surfaces, given by the following [40, 37]:
FHYD(d) = K exp
(-)
(2.10)where K > 0 are hydrophilic repulsion forces and K<0 are hydrophobic attraction forces, d is the separation distance, and l, is the orientational correlation length of water molecules (which describes how many of the molecules nearby have the same orientation due to intermolecular forces). Hydrophilic surfaces enhances rewetting of the surface and tends to increase adhesion of species to the surface whereas hy-drophobic surfaces decreases wettability [33]. Greater contact area also increases the adhesion probability of particles.
Surface reactions can also be suppressed through changing the pH, temperature, or fluid velocity. If heat flux is increased so that boiling occurs, deposition increases as precipitates concentrate at the edges of the bubbles (see Figure 2-1). The amount of foulant deposited, in most cases, increases as pH decreases and as heat flux increases due to higher dissolution rates and higher solubility limits. Figure 2-2 shows a pH-potential diagram for iron. As can be seen from the figure, at a lower pH, iron is more likely to be an anion. On the other hand, under basic conditions, iron is more likely to precipitate out as an oxide.
Fluid flow exerts a lift force FL on particles perpendicular to the flow direction which can be calculated in the following way [411:
FL = 1.61577d2 1/2U (2.11)
s I \ I u p
d ' e Supersa u po
A4 SnlId deprsiI
Figure 2-1: Deposition under bubble [1].
1.2 Fe" 0.8 Fe 3;0.4 Corrosion PaS3Mvty >10.0 i-0.4 -0.4 Fe 2 Corrosion HFeOj 2 4 6 8 10 12 14 pH *
Figure 2-2: Simplified Pourbaix Diagram for iron in solution at 25 'C [2]. Iron tends to be in solution as anions naturally below a pH of 6-7. At a higher pH, iron oxides are the most stable form.
Flow direction DEPOSITION -~ REMOVAL Heat flow (Crystallisation) ions (Sedimentation) + -particles * *~.*.*. ** * *'.@***'. *e 0** *.**.* Dissolution Spalling Erosion .*.'.. . .. ' Deposits
Heat transfer surface
Figure 2-3: Various fouling deposition and removal mechanisms [3].
C
2 B
A
Time
Figure 2-4: Deposit thickness over time [3].
where r7 is the viscosity,
4
is the particle diameter, p is the fluid density, 2 is the velocity gradient in the y-direction, and U, is the flow velocity at the particle location. As can be seen, increasing fluid velocity increases the lift force. The particle will be removed from the surface if the lift force is greater than the sum of the adhesive van der Waals force and gravity force, assuming the particle has not bonded with material on the surface. The deposition and removal process during fouling is shown in Figure 2-3 .Fouling thickness with time follows an S-curve. There is an induction period before deposition occurs, and deposit thickness increases until equilibrium between the deposition and removal rate is reached (see Figure 2-4 ). Studies have shown that fouling can occur fairly rapidly. One shell and tube oil heater reported a heat transfer coefficient decrease of 40% in just 3 months [6]. A typical oil refinery preheater chain
was found to have a 42% drop in heat transfer after a year, though using antifoulants decreased this to 18% [6]. Depending on the environment in which the fouling layer occurs and the participating species, it can be tenacious or flaky, dense or sparse, with varying colors and thicknesses.
2.1.1 Types of Fouling
Fouling can be categorized into five types: crystallization, particulate, biological, chemical, and corrosion fouling.
" Crystallization fouling, which includes precipitation and solidification, is from deposition or formation of small particles on the surface that grow into crystal structures, many times from heating or freezing of fluid on the surface (see Figure 2-3). CRUD growth in nuclear reactors is a form of precipitation fouling. Crystallization fouling is affected by the amount of nuclei, impurities, solubility limit, how quickly solution is cooled, and if phase changes are present. Cooling quickly results in smaller crystals. On heated surfaces, it was seen that when boiling occurs, rings of particles are deposited. One theory is that when the water evaporates and the bubble grows, the particles are left behind at the
bubble's edges [42, 43].
" Particulate fouling is the accumulation of particles on a surface. The main transport mechanisms for deposition are diffusion, inertial impaction, and grav-itational settling. Heavier particles will settle onto horizontal surfaces from gravity, and finer particles will stick to inclined surfaces due to suction. A common problem is with gas-side fouling present in dryers, gas lines, reactors, combustion systems, and heat exchangers [61.
" Biological fouling is the growth of organisms, including animals, plants, bac-teria, etc., on surfaces. Fluid flow brings nutrients to surfaces where they can accumulate, and organisms that can attach to the surface will be close to a food source. In addition to the effects of physical transport and physicochemical interactions that are a part of deposition of other types of fouling, biological rate processes also affect the accumulation of biofilms on surfaces [6].
" Chemical reaction fouling is when the fouling layer is a result of chemical reactions in the fluid. Electrochemical reactions take place where metal atoms become ions in solution, and the surface is left with excess electrons. An
ex-ample of chemical fouling is coke formation in coal plants, autoxidation, and polymerization [6].
* Corrosion fouling occurs when the surface itself suffers corrodes and those particles form the fouling layer. Often the most important parameter for cor-rosion rates is the amount of oxygen available since it is usually the cathodic reactant. In most cases, more oxygen means more corrosion. However, some-times passivating oxide layers are formed, impeding further corrosion of the surface. If the passivating layer is weakly adhered to the surface though, layers that form can be torn off through shear forces, continuously exposing the surface to further corrosion. Even for tightly adherent passivating layers, if the oxide cracks, such as through mechanical forces or thermal expansion, the exposed surface will experience corrosion again. Corrosive salts such as chlorides and sulfates can prevent the development of protective layers so that corrosion of the surface continues uninhibited [6].
In many situations, there are several mechanisms that contribute to fouling and not just one. For example, industrial heat exchangers usually experience particulate, corrosion, and biological or chemical reaction fouling. Wastewater treatment and desalination systems usually experience both inorganic and biological fouling [1, 6,
36, 331.
2.1.2 Fouling in Nuclear Power Plants
Some studies on CRUD from nuclear reactors have described it has having an inner layer that is adherent and dense, while the outer layer is looser and more porous. In BWRs, the main phases of CRUD are hematite and non-stoichiometric nickel ferrite spinels. In PWRs, CRUD is mainly made up of nickel ferrite, nickel metal, or nickel oxide [7]. The upper regions of PWR fuel rods tend to have thicker CRUD, unlike in BWRs, since this is where subcooled nucleate boiling is more likely to occur. The boric acid and lithium hydroxide in the coolant can also build up in the pores of the CRUD layer, precipitating out as LiBO2, Li2B407, Ni2FeBO5, and other similar forms
[44, 101. This leads to the CIPS phenomenon in PWRs, mentioned in the previous section. Prevention and mitigation techniques for CRUD will be covered later.
CRUD on fuel rods are found to be reddish, grey, or black in color in current LWRs. The red color comes from Fe2O3, whereas Fe304 and nickel ferrite is black.
The fuel rods can also look grey or white from the presence of zirconium oxide [45]. The thickness of the CRUD layer can vary from very thin to over 100 pm after one
Property Typical Values References
Average CRUD thickness (pm) 20-60 [4, 22, 13, 471
CRUD porosity (%) 30-80 [4, 22, 131
Pore size (pm) 0.1-0.5 [4]
Chimney density (chimneys/mm2) 3000-5000 [4, 13] Chimney diameter (pm) 2.5-5 [4, 13, 481
Table 2.1: General charactersitics of CRUD and vapor chimneys under sub-cooled boiling conditions.
reactor cycle [7, 46]. The thermal properties of the CRUD depend on its thickness, density, porosity, and the size, shape, and density of vapor chimneys [14]. Vapor chimneys are tunnels that go through, or partway through, the CRUD layer. The liquid in the CRUD layer will experience high temperatures and evaporate, and the vapor can then exit from the chimneys, taking heat away from the surface of the cladding. Table 2.1 lists general characteristics of CRUD.
Bubble nucleation sites are more likely to occur when the surface has a lot of microcavities [14, 49, 50]. A larger cavity radius lowers required superheat for nu-cleation, though only a certain range of sizes will be active nucleation sites. Bubble size depends on the balance between buoyancy, surface tension, and inertial forces. For a constant superheat, increasing cavity diameter increases the bubble departure diameter. With a higher superheat, the bubble departure frequency increases [51]. A study by Shi, Jones, and Pan found that there is an optimum CRUD porosity, particle diameter, chimney density and radius for increasing CHF. A porous CRUD with high chimney population density or larger chimney radii will have a lower wall superheat in most cases, though this reduction is not as significant as the increase in
CHF [52].
Hysteresis is an important factor to where boiling occurs when increasing or de-creasing heat flux. When inde-creasing the wall superheat, heat flux increases along a certain curve up to the CHF, but does not follow the same curve down [53]. This is due to some nucleation sites, once initiated, staying active even after the wall super-heat has decreased below the temperature required for initiating subcooled boiling. Subcooled boiling is enhanced in high duty cores, which have higher coolant tem-peratures and surface heat fluxes, and in turn promotes bubble nucleation. Due to power uprates in reactors, CRUD growth is becoming more of a problem in these nu-clear plants. In addition, the change to longer cycle lengths means more CRUD can build up, and more boron compounds will deposit in them due to the higher boron concentraions needed at the beginning of the cycle [421.
In addition to increasing corrosion rate, pressure drop, and thermal resistance, fouling in nuclear power plants can negatively affect production and safety. In PWRs, CRUD tends to form near the top of the fuel rods where nucleate boiling occurs [7, 9]. Since PWR coolant has boric acid and lithium hydroxide added to it, some boron compounds precipitates out of the coolant and stay in the pores of the CRUD layer, mostly in the form of lithium tetraborate (Li2B4O7). Boron is a neutron poison, and
it acts to depress the power at the top of the core for most of the cycle where CRUD tends to grow. This leads to what is known as CRUD induced power shift (CIPS), or axial offset anomaly. CIPS is usually defined as when the axial power distribution varies by more than 3% from expected values, and is observed when the CRUD is 20 pm thick or more [42, 44].
Enough CRUD can be present for CIPS to occur as soon as 4 months into the cycle. When CIPS occurs, the plant may have to operate at lower power to provide extra shutdown margin, which decreases the efficiency of the plant. CIPS effects shutdown margin because the boron deposits at the top of the core burns at a slower rate than then bottom of the core. The axial offset at the end of the cycle will actually shift upwards since there is more unburned fuel near the top of the fuel rods. Therefore, during operations, the control rods (which come down from the top in PWRs) have less worth near the top of the core than anticipated because of the smaller neutron population there. If the reactor is brought up to full power from zero power with crudded fuel assemblies, the control rod worth is higher due to the top of the fuel rods having more fissionable material left. This also makes criticality calculations more difficult [42]. In one plant, CRUD shifted the power distribution downward and radially inward near the top of the core with a 0.45% loss in'reactivity and increased the axial peaking factor by 10% [111. In Cycle 9 of the Callaway plant, the power was reduced to 70% due to CIPS for the last third of the cycle [42, 54].
An additionals problem is that CRUD particles that deposit on cladding surfaces become activated over time. When part of these activated products redeposit on other surfaces in the system that workers access during maintenance, personnel can become exposed to higher radiation fields than expected. Cobalt-60 is the main activated product of interest in Light Water Reactors (LWRs) and has a relatively long half-life. There are also minor contributions to worker dose from cobalt-58 (an important short-term source), manganese-54, and zinc-65 [55, 11].
2.1.3 Fouling of Other Heated Surfaces
Fouling is also a large problem in other combustion systems, chemical and refining operations, and food processing. In 1987, a survey by EPRI found that 37% of US coal utilities had frequent fouling and 77% had occasional to frequent problems [561. Fouling in coal plants cause losses in efficiency in the furnace, economizer, superheater, and reheaters. In addition, steam temperatures are harder to control with furnace
slagging.
Geothermal plants suffer from crytallization fouling as after water flashes to steam, the residue water has a high concentration of dissolved salts. When extracting the remaining energy, the heat recovery system experiences fouling problems. Many chem-ical processes use catalysts to speed up reactions, but these can become deactivated due to fouling. This occurs when catalysts suffer from site blockage, mainly caused by carbon [6].
In the food and beverage industry, fouling problems occur from protein deposition in heat exchangers, biofilm growth on surfaces, ice buildup in freezers, accumulation of material in low-velocity areas, etc. and lead to increased matinenance and fuel cost as well as lower quality products or production losses. Some processes depend on heat transfer, such as boiling, sterilizng, and cooking food. Fouling is especially problematic for thermosensitive compounds, such as milk products [36, 6].
2.1.4 Fouling of Non-heated Surfaces
Fouling can occur in systems without any applied heat as well. The growth of animals and plants (e.g., barnacles, tube worms, tunicates, hydroids, bryozoan, mussels, algae) on submerged objects decreases the efficiency of propulsion on ships, can lead to failure of flying boats to get off the water, reduces the efficacy of underwater acoustic devices, and destroys corrosion-resistant coatings. Fouling of ships is mainly dependent on how much time in spent in port since many fouling organisms have a harder time attaching to the surface when water is moving across the surface at higher velocities. Microbial growth also depends on the water temperature, being most prominent when the water temperature is 70-100 "F, and nonexistent above 150 *F or below 60 *F. Sound equipment can experience decreased transmission due to reflection, scattering, and absorption from fouling, and background noise can be larger due to cavitation. Fouling of salt water pipe systems (e.g., fire mains) interferes with flow, and are difficult to break down for cleaning [161.
Unless the water is purified, scale deposits can be left behind when the water evapo-rates. Pressure-driven membrane processes are used in many water treatment plants where natural organic matter is the main foulant, and is also used in biotechnology, medicine, and food industries where proteins are the main foulant. Techniques using reverse osmosis, nanofiltration, ultrafiltration, or microfiltration suffer from deposits left behind as the liquor moves through the membranes. Fouling of membranes not only decreases the fluid flux due to hydraulic resistance, but may also suffer from concentration polarization inside the foulant layer that further contributes to flux loss [37, 57, 58]. Some systems suffer from solidification fouling, such as ice in freez-ers or wax hydrocarbons in the oil industry that deposit on cool surfaces when they are being transported through pipelines. Fouling is an important problem in boiling cryogenic fluids, such as liquid hydrogen, helium, nitrogen, or argon. For cooling superconducting magnets, very small deposits can greatly reduce heat transfer and can lead to burnout [61.
2.2
Fouling Models
The models here focus on precipitation fouling, which is the main type of fouling in heat exchangers. There are two main drivers of deposition: degree of supersaturation and mass diffusion. The removal rate is dependent on the fluid flow. Fouling models dependent on supersaturation by Kern and Seaton, and Ebert and Panchal to cal-culate the thermal resistance, which is proportional to fouling layer thickness, are in the following form [59]:
dRf = a (C., -
C.t)
- -rRf (2.12)where Rf fouling resistance, a is the deposition constant, C., is the supersaturated concentration of the fluid, Ct is the saturated concentration of the fluid, 7 is the removal constant, and r is the shear stress. Models that were dependent on mass diffusion used a similar equation:
dtf = a (CO - C8) - yrRf (2.13)
where Cb is the saturated concentration in the bulk fluid and C, is the saturated concentration at the surface. For chemical reaction fouling, the (C,,, - C,,t) can be
replaced with the Arrhenius relationship exp (-E/RT) [601.
sim-ulating thermal hydraulic and chemistry conditions. The CRUD Chemistry Model proposed by Dickinson et al. combined wick boiling, radiolysis of water, nickel and iron dissolution and hydrolysis, and boric acid chemistry to predict the heat flux, fluid flow, and chemical reactions in the CRUD layer in PWRs. The model found that at a CRUD thickness of 10-20 pm, lithium metaborate begins to precipitates out, which also lowers the pH and results in formation of zircaloy oxides. The CRUD was rich in NiO due to conditions that allow for nickel release from steam generator tubing [611.
Wang proposed a four-regime model for conditions in CRUD. The flooding model simulated the conditions of liquid filling CRUD chimneys and pores, which is present at low power conditions. The mixture model assumed vapor and liquid mixing in CRUD chimneys and pores, which is what occurs during normal operating conditions in a nuclear reactor. The third regime is the dryout model, which simulates conditions at high power when the CHF is reached. Lastly, the particle model is for CRUD pores that are filled with solid particles, which may occur due to significant impurities in the reactor coolant system [29].
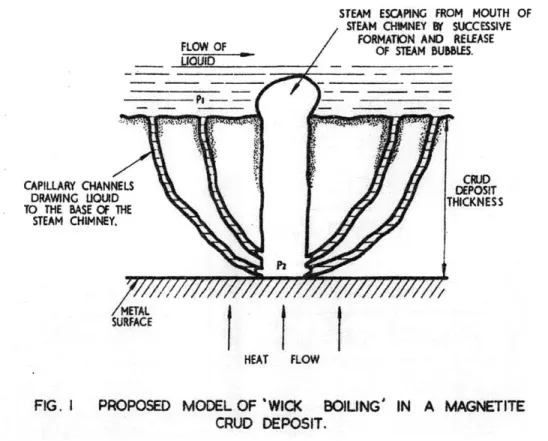
Due to the importance of fouling on heat transfer in nuclear power plants, several models have focused on boiling conditions in the CRUD layer. Studies by Cohen and by Macbeth suggested that wick boiling is the primary mechanism of heat transfer through porous media after noticing that the temperature difference across the CRUD layer was smaller than expected. Wick boiling occurs when liquid is brought to the heated surface through feed capillaries where they evaporate close to the lower part of the chimney, and the vapor then escapes through the chimney (see Figure 2-5). If the material (CRUD in this case) is not constrained, the boiling process will arrange vapour escape channels itself. Macbeth found that dryout values with CRUD is 5-10% lower than on clean surfaces, perhaps due to the continuous liquid film being interrupted by vapor emission through the chimneys [4].
Models of CRUD in PWRs using MAMBA-BDM by Short et al. indicated that the
temperature distribution is lower at the chimneys due to wick boiling, and peaks away from the chimney. The study also found that as the pitch between vapor chimneys decreased, fluid convection became increasingly important since it contributes to heat transfer more than the conduction term. A vapor chimney pitch of 5 ptm gives a reduction of 2 K in peak cladding temperature, which is estimated to reduce corrosion
STEAM ESCAPING FROM MOUTH OF
STEAM CHIMNEY BY SUCCESSIVE
FORMATION AND RELEASE
FLQW D OF S71EAM BUBBLES.
CAPILLARY CHANNELS EI
DRAWANG LIOUID DEPCOSET
TO THE BASE OF THETHCNS STEAM CHIMNEY.
METAL
SURFACE
HEAT FLOW
FIG. I PROPOSED MODEL OF 'WICK BOILING' IN A MAGNETITE
CRUD DEPOSIT.
2.3
Prevention and Mitigation
There are several methods to prevent or mitigate the negative effects of fouling. One approach is to control the operating conditions of the system to limit foulant pre-cursors, such as by preventing corrosion. The second is to choose conditions and materials that make it difficult for particles to deposit on surfaces. The third ap-proach is to remove the fouling layer after it has deposited, such as through regular cleaning using chemical or mechanical methods. Choosing construction materials that are resistant to fouling, corrosion-resistant, or will make up for the corrosion and thermal resistance of the layer of deposits can prevent or mitigate the negative effects. Alternatively, rather than changing the bulk material, a coating can be applied to the surface that is resistant to corrosion or adhesion. Another method, which is the focus of this thesis, is on physically modifying the surface geometry of the material to decrease or change the growth of the fouling layer.
2.3.1 Fouling Mitigation by Controlling Operating Conditions
2.3.1.1 Controlling Fluid Chemistry
One of the most important factors of how the fouling layer forms is the fluid chemistry. Higher pH has been found to result in less deposition due to the stable passivating oxide layer that forms on the surface [111. The amount of hydrogen and oxygen in the coolant has a large effect on fouling and is closely related to the pH. For example, high levels of oxygen in the water promotes corrosion of surfaces unless a tenacious passivating oxide layer forms.
Another form of chemistry control is to add antifoulants to the fluid to decrease fouling of surfaces. Different types of antifoulants are shown in Table 2.2. An ex-ample of commonly used antifoulants are oxidizing biocides, such as chlorine, sodium hypochlorite, and ozone, which are effective in preventing biological fouling. Adding impurities can also retard fouling in one of two ways: 1) if they are adsorbed onto the crystal surface, they can prevent further growth at that location or, 2) if they remain in solution, impurities can impede crystallizing species from getting to the surface [6]. Suspended particles can either promote or retard fouling depending on whether they have a scrubbing effect or act as nucleation sites for crystallization. If the concentration of metallic ions is increased, the deposition will generally increase
due to there being more particles available for deposition.

![Figure 2-2: Simplified Pourbaix Diagram for iron in solution at 25 'C [2]. Iron tends to be in solution as anions naturally below a pH of 6-7](https://thumb-eu.123doks.com/thumbv2/123doknet/14483273.524552/30.918.196.655.509.928/figure-simplified-pourbaix-diagram-solution-solution-anions-naturally.webp)

![Figure 2-6: Flow-assisted corrosion rate as a function of fluid velocity on a metal surface with a protective oxide layer [5].](https://thumb-eu.123doks.com/thumbv2/123doknet/14483273.524552/43.918.137.757.135.520/figure-flow-assisted-corrosion-function-velocity-surface-protective.webp)