HAL Id: hal-01110987
https://hal.archives-ouvertes.fr/hal-01110987
Submitted on 28 Oct 2020
HAL is a multi-disciplinary open access
archive for the deposit and dissemination of
sci-entific research documents, whether they are
pub-lished or not. The documents may come from
teaching and research institutions in France or
abroad, or from public or private research centers.
L’archive ouverte pluridisciplinaire HAL, est
destinée au dépôt et à la diffusion de documents
scientifiques de niveau recherche, publiés ou non,
émanant des établissements d’enseignement et de
recherche français ou étrangers, des laboratoires
publics ou privés.
deposition to Low Nutrient Low Chlorophyll regions
C. Guieu, O. Aumont, A. Paytan, L. Bopp, C.S. Law, N. Mahowald, E. P.
Achterberg, E. Marañón, B. Salihoglu, A. Crise, et al.
To cite this version:
C. Guieu, O. Aumont, A. Paytan, L. Bopp, C.S. Law, et al.. The significance of the episodic nature
of atmospheric deposition to Low Nutrient Low Chlorophyll regions. Global Biogeochemical Cycles,
American Geophysical Union, 2014, pp.1179-1198. �10.1002/2014GB004852�. �hal-01110987�
The signi
ficance of the episodic nature of atmospheric
deposition to Low Nutrient Low Chlorophyll regions
C. Guieu1, O. Aumont2, A. Paytan3, L. Bopp4, C. S. Law5,6, N. Mahowald7, E. P. Achterberg8,9, E. Marañón10, B. Salihoglu11, A. Crise12, T. Wagener13, B. Herut14, K. Desboeufs15, M. Kanakidou16, N. Olgun17,18, F. Peters19, E. Pulido-Villena13, A. Tovar-Sanchez20,21, and C. Völker22
1
Laboratoire d’Océanographie de Villefranche (LOV), UMR7093, CNRS-INSU-Université Paris 6, Villefranche sur Mer, France,
2Laboratoire de Physique des Océans, Institut Européen de la Mer, Centre IRD de Bretagne, Plouzané, France,3Institute of
Marine Sciences, University of California Santa Cruz, Santa Cruz, USA,4LSCE/IPSL, CNRS/CEA/UVSQ, Gif sur Yvette, France,
5National Institute of Water and Atmospheric Research (NIWA), Wellington, New Zealand,6Department of Chemistry,
University of Otago, Dunedin, New Zealand,7Department of Earth and Atmospheric Sciences, Cornell University, Ithaca, USA,8Ocean and Earth Science, National Oceanography Centre Southampton, University of Southampton, Southampton,
UK,9Now at GEOMAR, Helmholtz Centre for Ocean Research Kiel, Kiel, Germany,10Departamento de Ecología y Biología Animal, Facultad de Ciencias del Mar, Universidad de Vigo, Vigo, Spain,11Institute of Marine Sciences, METU, MERSİN,
Turkey,12Istituto Nazionale di Oceanografia e di Geofisica Sperimentale (OGS), Trieste, Italy,13Institut Méditerranéen d’Océanologie (MIO), UMR 7294, Université d’AIX-Marseille-CNRS-IRD, Marseille, France,14Israel Oceanographic and
Limnological Research (IOLR), National Institute of oceanography, Haifa, Israel,15Laboratoire Interuniversitaire des Systèmes Atmosphériques, UMR CNRS 7583, Université Paris Est Créteil, Université Paris Diderot, Institut Pierre Simon Laplace, Créteil, France,16Environmental Chemical Processes Laboratory, Dept. of Chemistry, University of Crete, Heraklion, Greece,
17Helmholtz-Center for Ocean Research Kiel, GEOMAR, Kiel, Germany,18Now at Eurasia Institute of Earth Sciences, Istanbul
Technical University, Istanbul, Turkey,19Institut de Ciències del Mar, CMIMA (CSIC), Barcelona, Spain,20Department of Global Change Research IMEDEA (CSIC-UIB), Instituto Mediterráneo de Estudios Avanzados, Spain,21Department of Ecology and
Coastal Management, Andalusian Institute for Marine Science, ICMAN (CSIC), Campus Universitario Río San Pedro, Puerto Real, Cádiz, Spain,22Alfred Wegener Institute for Polar and Marine Research, Bremerhaven, Germany
Abstract
In the vast Low Nutrient Low-Chlorophyll (LNLC) Ocean, the vertical nutrient supply from the sub-surface to the sunlit sub-surface waters is low, and atmospheric contribution of nutrients may be one order of magnitude greater over short timescales. The short turnover time of atmospheric Fe and N supply (<1 month for nitrate) further supports deposition being an important source of nutrients in LNLC regions. Yet, the extent to which atmospheric inputs are impacting biological activity and modifying the carbon balance in oligotrophic environments has not been constrained. Here, we quantify and compare the biogeochemical impacts of atmospheric deposition in LNLC regions using both a compilation of experimental data and model outputs. A metadata-analysis of recently conductedfield and laboratory bioassay experiments reveals complex responses, and the overall impact is not a simple“fertilization effect of increasing phytoplankton biomass” as observed in HNLC regions. Although phytoplankton growth may be enhanced, increases in bacterial activity and respiration result in weakening of biological carbon sequestration. The application of models using cli-matological or time-averaged non-synoptic deposition rates produced responses that were generally much lower than observed in the bioassay experiments. We demonstrate that experimental data and model out-puts show better agreement on short timescale (days to weeks) when strong synoptic pulse of aerosols deposition, similar in magnitude to those observed in thefield and introduced in bioassay experiments, is superimposed over the mean atmospheric depositionfields. These results suggest that atmospheric impacts in LNLC regions have been underestimated by models, at least at daily to weekly timescales, as they typically overlook large synoptic variations in atmospheric deposition and associated nutrient and particle inputs. Inclusion of the large synoptic variability of atmospheric input, and improved representation and parameterization of key processes that respond to atmospheric deposition, is required to better constrain impacts in ocean biogeochemical models. This is critical for understanding and prediction of current and future functioning of LNLC regions and their contribution to the global carbon cycle.1. Introduction
Oceans influence climate primarily due to their ability to take up and store heat, and their direct and indirect effects on global climate via regulation of atmospheric CO2and other radiatively active gases [Friedlingstein
Global Biogeochemical Cycles
RESEARCH ARTICLE
10.1002/2014GB004852Key Points:
• Episodic nature of atmospheric deposition matters in LNLC productivity
• Atmospheric impact in LNLC area is not a simple“fertilization effect” • Atmosphere supplies most of new
N & Fe to the mixed layer in some LNLC regions Supporting Information: • Readme • Text S1 • Aumontetal_in_prep_2014.pdf Correspondence to: C. Guieu, guieu@obs-vlfr.fr Citation:
Guieu, C., et al. (2014), The significance of the episodic nature of atmospheric deposition to Low Nutrient Low Chlorophyll regions, Global Biogeochem. Cycles, 28, 1179–1198, doi:10.1002/ 2014GB004852.
Received 19 MAR 2014 Accepted 13 OCT 2014
Accepted article online 15 OCT 2014 Published online 10 NOV 2014
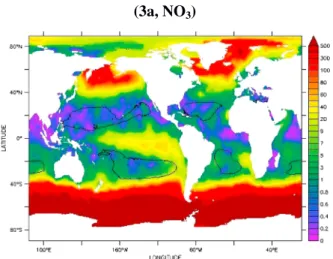
et al., 2006; Le Quéré et al., 2009; Le Quere et al., 2013]. Sixty percent of the global oceans, primarily the central ocean gyres, are depleted in the primary macronutrients nitrate and phosphate, and consequently sustain low growth of phytoplankton and other marine organisms [Antoine et al., 1996]; yet these“ocean deserts” represent ecosystems occupying a large proportion of Earth’s surface area. These oligotrophic regions are generally characterized by chlorophyll a (Chl a) concentrations<0.07 mg m 3and co-dominated by small phytoplankton and heterotrophic bacteria [Uitz et al., 2010; Cho and Azam, 1990], and are referred to as Low Nutrient Low Chlorophyll (LNLC) areas (Figure 1a).
Wet and dry atmospheric deposition transport a range of compounds from a variety of natural and anthropogenic land sources to the ocean. The compounds include macro- and micronutrients (N, P, C, Si, Fe, and other metals) [Duce et al., 1991] as well as potentially toxic elements (e.g., Cu and Pb) [Paytan et al., 2009; Jordi et al., 2012]. The main natural source of land-derived particles to the open ocean is wind-blown desert dust, which constitutes the primary atmospheric source of iron [Jickells et al., 2005]. Atmospheric nitrogen is mainly derived from anthropogenic combustion or agricultural sources from densely populated regions throughout the world [Duce et al., 2008], while phosphorus originates from both desert dust and anthropogenic sources [Mahowald et al., 2008] (Figure 1b). Atmospheric supply of dissolved constituents to the surface ocean depends on particle concentration and size spectrum, and the solubility of the element-bearing phases in aerosols [Trapp et al., 2010; Baker and Jickells, 2006] which is influenced by atmospheric processing during transport [Krishnamurthy et al., 2009]. For example, the extent to which dust interacts with anthropogenic acids (H2SO4and HNO3)
during transport increases the solubility of various elements [Desboeufs et al., 2001] resulting in enrichment of nitrogen [Geng et al., 2009], and enhanced supply of potentially bioavailable compounds to the surface ocean. Furthermore atmospheric deposition supplies N and P in both inorganic and organic forms, which are accessible to both heterotrophic organisms and autotrophic phytoplankton [Cornell, 2011; Kanakidou et al., 2012; Moore et al., 2013]. Deposition is dependent on the distance from source, with sites located between 10 and 1000 km from source areas receiving dust deposition of 1.0–50 g m 2yr 1, and sites located>1000 km receiving 0.05–1.00 g m 2annually, as determined by a compilation of direct measurements of dust deposition [Lawrence and Neff, 2009]. According to the authors, this range represents the background rate of dust deposition, such that all sites throughout the world receive, at minimum, this deposition range each year.
The supply of new nutrients to the ocean from external sources such as atmospheric deposition has been extensively addressed in iron-limited High Nutrient-Low Chlorophyll (HNLC) regions [i.e., Boyd et al., 2007], most of which receive low atmospheric inputs at the present time (Figure 1b). However, much less attention has been paid to the importance of atmospheric deposition to LNLC regions. Until recently, models considering atmospheric deposition to the ocean focused primarily on iron and typically regarded deposition as a continuous input, using mean deposition values, often without consideration of the highly episodic nature of such deposition. To our knowledge, only one study has considered the temporal variability of atmospheric deposition [Aumont et al., 2008]. This study was restricted to iron deposition and showed that a significant variability in surface iron concentrations can be generated in high deposition regions, for instance in the subtropical North Atlantic Ocean. For the other nutrients taken independently or altogether, we are not aware of any equivalent studies. Yet it is widely recognized that atmospheric deposition, and in particular dust deposition, is by nature highly episodic. Indeed, daily dust deposition rates as high as 4 times the monthly meanflux have been measured in the North Atlantic [Moxim et al., 2011]. This“pulsed character” is also well identified in the long (since 1965) aerosol sampling series in Barbados [Prospero and Lamb, 2003]. The episodic nature of deposition is also reported for the North Pacific where most of the mineral dust input to the ocean typically takes place during 3–5 events in the spring, each of which lasts 1–3 days [Donaghay et al., 1991]. Wet deposition is also not continuous as rainfall events vary from small intense storms of a few square kilometers to large frontal systems that stretch for thousands of kilometers, and so wet atmospheric inputs are both episodic and spatially patchy [Uematsu et al., 1985; Donaghay et al., 1991]. In the Mediterranean Sea a few intense events provide the majority of the annual deposition [ie Loÿe-Pilot and Martin, 1996; Guerzoni et al., 1999] with measured short (a few hours) eventfluxes exceeding 20 g.m 2[Bonnet and Guieu, 2006; Guieu et al., 2010a; Ternon et al., 2010]. These observations confirm that episodicity is the norm for deposition over the ocean.
How the ocean responds to pulses of deposition, as either transient or long-term impacts on diversity of the natural assemblage and/or carbon export, is not obvious from in situ or remote sensing observations reported in the literature. For example, atmospheric dust concentrations measured at the Canary Islands concomitantly
(a)
(b)
with upper water biogeochemistry at the oligotrophic time series station ESTOC (European Station for Time series in the Ocean, Canary Island) over 2 years have shown that higher aerosol concentrations (continuously measured) were not accompanied by higher primary production (derived from Chl a) or export production [Neuer et al., 2004]. The authors concluded that phytoplankton production remained unaffected by atmospheric nitrogen supply on annual timescales. In the Mediterranean Sea, Herut et al. [2005] observed a significant dust storm at sea (CYCLOPS cruise), which caused as a sharp reduction in Prochlorococcus abundance and a slight increase in Chl a and in bacterial activity. In the Pacific, three Asian dust storms stimulated the growth of Synechococcus but not
(c)
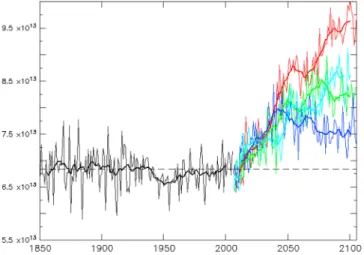
Figure 1. (a) Location of oligotrophic gyres (blue color) as derived from SeaWiFS climatology (1997–2007) with a criteria of Chl a<0.07 mg.m 3. (b) Global atmospheric dissolvedfluxes derived from models for iron, phosphate and nitrogen (from Luo et al., 2008; Mahowald et al., 2008), Lamarque et al., 2010. (c) Evolution of simulated deposition of dust (Tg/y) and soluble iron (Gg/y), phosphate (Tg/y), and nitrogen (Tg/y) over the period 1850–2100. For DFe and phosphate, dashed lines are deposition from combustion sources. For N deposition, solid lines are total N, dashed lines are NOy, and dotted lines are NHx. Uncertainties for deposition estimates are 40% for past changes, and 100% for future changes. Future estimates are from the four representational concentration pathways (RCPs) scenarios (RCP2.6 blue, RCP4.5 green, RCP6.0 light blue, and RCP8.5 red). Estimates based on Lamarque et al. [2010, 2011], Luo et al. [2008], Mahowald et al. [2008, 2009, 2010], and van Vuuren et al. [2011]; (see description in Methods).
Prochlorococcus [Chung et al., 2011]. Comparing aerosol optical thickness and chlorophyll derived from satellite color during a 4 year period in the Mediterranean Sea, Volpe et al. [2009] concluded that the methodology induces important biases arising from atmospheric correction linked to Saharan aerosols and so this could not be used to test a dust fertilization in oligotrophic systems such as the Mediterranean Sea. Yet, the authors conclude that dust inputs do not play a significant role in the phytoplankton dynamic in the Mediterranean Sea. In some of these studies, the role of grazers is suspected to play an important role in maintaining a low phytoplankton biomass but this has not been confirmed by observation and measurement. In conclusion available data indicate that the oligotrophic ocean exhibits a variety of responses to atmospheric deposition and no simple pattern can be drawn which denote the large variety of oligotrophic systems.
The published results from different models agree that increasing iron supply by atmospheric deposition stimulates marine productivity and export production in HNLC regions [Archer and Johnson, 2000; Moore et al., 2002]. This may potentially increase the LNLC ocean area, due to the resulting reduction in lateral nutrient transport from HNLC regions [Dutkiewicz et al., 2005; Aumont and Bopp, 2006]. Models also agree that an increase in Fe and P deposition to LNLC areas may enhance N2fixation in LNLC areas [Moore et al., 2002; Krishnamurthy
et al., 2009; Mahowald et al., 2011], potentially lowering atmospheric pCO2[Bopp et al., 2003; Parekh et al., 2006].
In the few modeling studies that have investigated the role of atmospheric deposition as a source of nutrients other than iron, atmospheric inputs of nitrogen were shown to have a very modest effect on marine productivity, export production, or carbon uptake on a global scale yet identified significant effects in LNLC regions [Krishnamurthy et al., 2007, 2009, 2010]. Although phosphorus deposition accounted for only a very small fraction of export production [Krishnamurthy et al., 2009, 2010] the contribution of atmospheric nitrogen deposition was significant. A further response was a decrease in N2fixation in LNLC regions, possibly due to P limitation. To examine the impact of aerosol deposition and its temporal variability in LNLC systems, wefirst examined the turnover times relative to atmospheric deposition (TTADs) in the surface mixed layer for iron, nitrate, and phosphate, to assess the contribution of atmospheric deposition to nutrient stocks in the global surface ocean. We further evaluated the potential impact of new atmospheric nutrient inputs (iron, nitrate and phosphate) in LNLC regions on primary production, N2fixation, surface Chl a concentrations, and export production by
applying atmospheric deposition to a coupled 3D ocean ecosystem-biogeochemical model. We then compared the model results with a compilation of published experimental responses of natural LNLC seawater to aerosol addition (see ref. in Table 1), to further examine the impacts of episodicity of aerosol deposition.
2. Methods
2.1. Turnover Times Relative to Atmospheric Deposition (TTADs) for Nitrate, Phosphate, and Dissolved Iron
The TTAD is defined as the time required to replace the surface mixed layer nutrient inventory solely by atmospheric deposition, and so TTADs (in years) were derived by dividing the vertically averaged nutrient concentrations (moles per cubic meter) in the surface mixed layer by the contribution of atmospheric deposition to the water volume of the mixed layer (moles per cubic meter per unit time) (see Figure 2a). Nitrate and phosphate in the surface mixed layer are obtained from the latest Levitus climatology (World Ocean Atlas 2009, http://www.nodc.noaa.gov/OC5/indprod.html). As a sensitivity analysis, we have alternatively used the CARS2009 climatology (www.cmar.csiro.au/cars) to compute the TTADs. Results are almost identical (see Figure S1). For iron in the surface mixed layer, we used a global compilation of over 13,000 published measurements of dissolved iron [Tagliabue et al., 2012]. The mixed layer depth was taken from the latest version of the global climatology [de Boyer Montégut et al., 2004] (http://www.lodyc.jussieu.fr/~cdblod/mld.html), using a density criterion of 0.03 kg m 3. Atmospheric depositionfluxes for nitrogen were based on published emissions and simulations of the historical time period and Representative Concentration Scenarios (RCPs) [van Vuuren et al., 2011; Lamarque et al., 2010, 2011]. Estimates of P and soluble P are based on [Mahowald et al., 2008], assuming that the combustion P follows the evoluation of the black carbon in the same scenarios. Estimates of iron and iron solubility are based on [Mahowald et al., 2009] including combustion iron, which follows the black carbon historical and RCP scenarios. Desert dust evolution is based for the historical time period on paleoclimate reconstructions [Mahowald et al., 2010], with future evolution based on estimates of desert area change in the future [Mahowald, 2007] assuming no carbon dioxide fertilization. Allfields have been linearly interpolated to the typical Levitus grid (1° × 1° horizontal resolution).
T able 1. Comp ilati on of Exper imental Stu dies Add ing Different Type s o f Aerosols to Sur face Seaw ater ,With Aerosol Type 1: Fine Fr action Surface Soil ;Aeroso lType 2: Fine Fraction Sur face Soil With Physico-chemical Tre atmen t Sim ulatin g Atm osphe ric Proc essing ;Aerosol Type 3: P a rticulate Phase From Rain; Aerosol Type 4: Du st Collection Durin g D u st Storm ;Aerosol Type 5: Local Aerosol o n F ilters (not Restricted to Dust) ; Aerosol T ype 6: An thropo genic Aerosols (Urba n P ar tic ulate Matter From NIST ) a Regio n Test ed P a rameters Physical Natu re of the Exper iment Time Scale of the Study Aer osol Type Aer osol Type (Deta ils) Amo unt of Aerosol/Du st Add ed or F inal Aerosol/ Du st Conc in Bottle or Simulate d Flu x E stimated Deposi tion Flux (g.m 2 ) Mimicked in the E xperim ents ( * ) Refe rences N Atlant ic Chl a, nano, and microphytoplankt on, PP 1 6 d 1 Fine fra ction of composite Saha ran soils collected in Alge ria *** 1.34 mg.l 1 13 B lain et al ., 20 04 N Atlant ic BA, BP , Chl a, Syn-, Proc -, PP , and N2 fi x 1 2 d 1 , 4 (1) fi ne fraction (< 20 μ m) of soils collected in Mal i and (2) atmo sph erically processed dust collected in the N Atl antic 2 mg.l 1 20 Mar añón et al . [2010] N Atlant ic Chl a, PP , and N2 fi x 1 2 d 1 Fine fra ction of composite Saha ran soils collected in Alge ria *** 0.5 –2 mg.l 1 5– 20 Mill s et a l. [2004 ] N Atlant ic Chl a, PP 1 2 d 1 , 4 Fine fra ction of composite Saha ran soils collected in Alge ria *** 2 mg.l 1 20 Mo ore et al . [2006 ] N Atlant ic Chl a 1 2 d 1 D u st coll ected in Barbado s (atmos phericall y processed) 2 mg.l 1 2 0 A chterberg un p. Data Sarg asso Sea S yn-, proch-, and pico-euk 1 3 d 5 Locally collected aerosols 2– 20 Ma ckey et al . [2012 ] Coast al Cali fornia Chl a 1 6 d 5 C o llected ae rosols 1 mg.l 1 10 Ma ckey et al . [2010 ] South east P aci fi c Syn -, pro ch-, pico -euk, PP , and N2 fi x 1 2 d 1 Fine fra ction of composite Saha ran soils collected in Alge ria *** 0.25 mg.l 1 3 Bonn et et al . [2008] SW P aci fi cN 2 fi x 1 , 5 5 d 1, 7 2 0– 25 mm size fraction obtain ed from sieving sur face so ils , one from A u stralia, one fro m Gobi De ser t 0.84 mg.l 1 8. 4 Law et al . [2011] Tasm an Sea Syn-and pro c-1 5 d 1 20 –25 mm size fraction obtain ed from sieving sur face so ils , one from A u stralia, one fro m Gobi De ser t 0.84 mg.l 1 8. 4 Ellw ood et al . [2013] Tasm an Sea N2 fi x 1 5 d 1 Aerosol dust collected during dust storm in Br isban e , A ustralia 0,84 mg.l 1 8 .4 Law, unp. Data Red Sea N2 fi x 1 2 d 5 Aeros ol dust fi lter s 0.71 mg.l 1 7 Fo ster et al . [2009 ] Red Sea Chl a 2 4 d 5 Aerosol dust collected 0.75 mg.l 1 8 Ma ckey et al . [2007 ] Red Sea Chl a, Syn -, Proc -, pico-euk 1 5 d 5 (1) Europe an aerosols; (2) Saha ran ae rosols 0.75 mg.l 1 8 P aytan et al . [2009] East Medit erranea n BA, BP , Chl a, sy n-, proch-, P P 1, 5 4 d 4 , 7 Colle cted dust dry dep osition with and wi thout pre -leach ing in fi lter ed SS W 0.2 –4.9 mg.l 1 2 H erut et al . [2005]
T able 1. (continued) Regio n Test ed P aram eters Phy sica l Nature of the E xperim ent Time Scale of the Study Aerosol Type Aerosol Type (Deta ils) Amo unt of Aerosol/Dus t Add ed or Final Aer osol/ Dust Co nc in Bottle or Sim ulated Flux Estim ated De positio n Flux (g.m 2 ) Mimicked in the Exp erim ents ( * ) Refere nces Med iterranean Sea BA, BP 1 2 d 1 F in e fraction of com posite Saharan soils collected in Alge ria *** 1 .25 –10 mg.l 1 13 Rida me , 2001 Med iterranean Sea N2 fi x 1 2 d 1 F in e fraction of com posite Saharan soils collected in Alge ria *** 1.1 mg.l 1 11 Rida me et al . [2011] Med iterranean Sea BA, sy n-, PP , and N2 fi x 1 2 d 2 , 5 Saharan dust ana log ** 1 mg.l 1 10 Ternon et al . [2011] W Med iterra nean Chl a, nan o and microplytop lank ton, BA, and PP 1 3 d 1 , 6 Du st = fi ne fraction of Saharan soils collected in Alge ria *** ; ant hropog enic = NIST ref. ma terial dust = 0.25 mg. l 1 . An thropo genic par ticles = 0 .01 mg.l 1 0.1 –2.5 Bonnet et al . [2005 ] W Med iterra nean BA, sy n-, pico, and nan o-eu ks 3 8 d 2 Saharan dust ana log ** 10 g.m 2 (se eding o ver mesocosm) 10 Laghd ass et al . [2011] W Med iterra nean BA, BP , Chl a, and pico -euk 2 3 d 4 P art iculat e phase of rain 50 –500 mg.l 1 50 0– 5000 # Lek unbe rri et al . [2010] W Med iterra nean BA, BR 1, 5 3 d 1 , 3 Saharan dust ana log ** and par tic ulate fraction of a Saha ran rain 0.5 –2 mg.l 1 5– 20 P ulido-Villena et al . [2008] W Med iterra nean PP , N2 fi x 3 8 d 2 Saharan dust ana log ** 10 g.m 2 (seed ing over me socosm ) 10 Rida me et al. [2013] W Med iterra nean Chl a 1 8 d 2 Saharan dust ana log ** 10 g.m 2 (seed ing over me socosm ) 10 Gu ieu et al . [2014 a] W Med iterra nean BA 3 8 d 2 Saharan dust ana log ** 10 g.m 2 (seed ing over me socosm ) 10 Pu lido-V illena unp. Data W Med iterra nean BR 3 8 d 2 Saharan dust ana log ** 10 g.m 2 (seed ing over me socosm ) 10 P ulido-Villena et al . [2014] W Med iterra nean BR 3 8 d 2 Saharan dust ana log ** 10 g.m 2 (seed ing over me socosm ) 10 Gui eu et al . [2014b ] a Also reported in situ respon se to dust stor m dep osition (7). Meas ured ch anges in bacteria abunda nce (BA) , bacteria respirat ion (B R), bacteria pro duction (BP ), ch lorophyll-a conce ntr ation (C hl a), organ ism s abunda nce (Syn. = Syn echo coccus; Proc. = Proc hloroco ccus; pico and nan o-euks = pico -and nano-e ukaryotes ,nano and micro-phy toplan kton), pri mary produ ction (PP) ,and ni trogen fi xation (N 2 fi x). The physica lframe work of the experi -men t is reported as follow: 1: bot tles with vo lumes ≤ 4 L ; 2 : mic rocosms (vol umes > 4 L); 3: me socosm s (> 50 m 3 ) and 4 : in situ. Time sc ale of the stud ies in day s (d ). * If a homog eneous dil ution of par ticles in 5– 10 m sur face mixe d layer is cons idered. ** E vapocon densed (EC) dust obtained from fi ne fraction of S aharan so ils [Guieu et al. , 2010b] . *** The sam e dust was used in those experi men ts. # these values do not corre spond to any pub lished fl uxes and have not been taken into acc ount in the calculat ion of the range of aver age valu es (0.1 –20 g.m 2 /ev ent) given in the text (see section 2 .4).
2.2. Contribution of Atmospheric Deposition to the Total Supply of Nutrient to the Surface Mixed Layer
Vertical dynamic supply of the N, P, and Fe are computed following an approach similar to Fung et al. [2000.] The upwelling rate was taken from the dynamic simulation produced by ORCA2-LIM, which is also used in our biogeochemical model experiments. Entrainment is considered to be zero when the mixed layer is shoaling or when nutrient concentrations just below the mixed layer are lower than in the mixed layer. Otherwise, it is computed as the amount of nutrients in excess of those in the mixed layer that are entrained into the mixed layer when the latter is deepening. Diffusion across the base of the mixed layer is set to 10 5m 2s 1[Law et al., 2003; Capone et al., 2005]. Nutrients supplied by lateral advection were not considered. Depositionfluxes, nutrient distributions, and the mixed layer depth are identical to those used to compute the turnover time maps.
2.3. Biogeochemical Model
The dynamic state of the ocean has been simulated using NEMO in its version 3.2 and in its global configuration ORCA2-LIM [Madec, 2008]. The spatial resolution is about 2° by 2° cos(ϕ) (where ϕ is the latitude) with a focusing to 0.5° of the meridional resolution in the equatorial domain. The model has 30 vertical layers, increasing in thickness from 10 m at the surface to 500 m at 5000 m. The ocean model is driven by climatological atmospheric fields identical to those used in Aumont and Bopp [2006]. However, the resulting dynamics simulated by the ocean model is different as several new parameterizations and new algorithms have been included in ORCA2-LIM. Ocean biogeochemistry is simulated using PISCES [Aumont and Bopp, 2006] which is forced offline by the 5 days mean ocean physical fields produced by the ocean physical model. Some significant modifications have been added to PISCES (O. Aumont, et al., PISCES: An ocean biogeochemical model for carbon and ecosystem studies, Geoscientific Model Development, in preparation 2014). Nutrients are supplied to the ocean from four different sources: atmospheric dust and N deposition, rivers, sea-ice, and sediment mobilization, with river, sea-ice, and sediment sources described in Aumont and Bopp [2006] as modified by (O. Aumont et al., in preparation 2014). Atmospheric contributions of nutrients are the same as in Figure 1b. The coupled ocean biogeochemical model is spun up offline for 4000 years, so that a quasi-steady state is reached, with primary production and CO2fluxes varying by less than 0.01 GtC yr 1. A brief description of
some new parameterizations of PISCES, relative to the previously published version of Aumont and Bopp [2006], is presented in the supporting information. This description is restricted to the processes that play a key role in this study, including N2fixation and size variability of nanophytoplankton. A validation of the
model behavior is also proposed in the supporting information (Figures S2–S10).
Figure 2. Box-Whisker plots (box portion = interquartile range (25th to 75thpercentile) of the data set. Horizontal bar within the box = median value. Black square = mean value. Also represented maximum and minimum values) showing the responses of different biological variables to aerosol additions in LNLC waters: synthesized from available data fromfield and laboratory aerosol addition bioassay experiments and mesocosm experiments (Table 1). The responses are % changes in the aerosol treatment relative to the control after 2–8 days (Table 1), with zero indicating no difference between the aerosol treatment and the control, and a positive response indicating an increase in the parameter in the aerosol treatment relative to the control. Parameters: (BA) Bacteria Abundance, (BR) Bacteria Respiration, (BP) Bacteria Production, (Syn.) Synechococcus abundance, (Proc.) Prochlorococcus abundance, (pico and euks) and picoeukaryotes abundance, (nano and microphyto) nano-and micro-phytoplankton abundance, (Chl a) Chlorophyll-a, (PP) primary production, nano-and (N2Fix) nitrogenfixation.
2.4. Sensitivity Experiments
Using the quasi-steady state obtained from the spun-up ocean biogeochemical model, two different sets of sensitivity experiments are performed, as summarized in Table 2. In afirst set of experiments, climatological monthly mean atmospheric depositions of P and Fe and climatological annual-mean atmospheric deposition of N (“Standard”) are either multiplied by five (’D’ scenarios) (based on the projection of the deposition fluxes presented on Figure 1c: from year 1900 to year 2100, changes in atmospheric deposition have been calculated to vary by a factor of 2 to 5) or set to zero (no“D” scenarios) for each nutrient independently and also for all three nutrients altogether. A total of 8 model runs were performed, 4 for the“D” scenarios and 4 for the no “D” scenarios. In each experiment, the model is integrated for 100 years. In a second set of experiments, the model has been integrated for 100 years using standard atmospheric deposition. During the last year (year 100), a strong pulse of dust (1 g m 2d 1) and N (2.8 mg N m 2d 1) is imposed arbitrarily on 15 January or on 15 July, everywhere in the LNLC regions (derived from SeaWiFS climatology (1997–2007) with a criteria of Chl a <0.07 mg.m 3, see Figure 1a). Fe and P input are related to dust deposition assuming a mean mass content
of 3.5% [Jickells et al., 2005] and 0.07% [Guieu et al., 2002] and a solubility in surface seawater of 2% [Bonnet and Guieu, 2004] and 15% [Ridame and Guieu, 2002] for Fe and P, respectively. N deposition is assumed to be fully bioavailable as NO3(a sensitivity study delivering N as ammonia did not produce significantly different
results). Thus, the last year is run twice, with one pulse of deposition added to the standard depositionfield. The magnitude of the pulse, both for dust and N, has been set to be of the same order of magnitude deposition range of observed episodic pulses (see references in introduction section) which were also used in aerosols/dust addition in bioassay experiments reported in Table 1 (0.1–20 g m 2event 1). The pulsed model rate (1 g m 2d 1) is representative of areas where moderate to strong episodic event is recorded (see Introduction), and represents the upper limit of the background rate of dust deposition [Lawrence and Neff, 2009]. Although less measurements are available for nitrogen deposition over the ocean, 2.8 mg N m 2d 1is of the same order of magnitude as the strong deposition events observed at three stations in the North Atlantic [Prospero et al., 1996]. The mixing of dust with anthropogenic acids such as HNO3(see Introduction) between emission and
deposition regions will result in dust deposition enriched in nitrogen [Geng et al., 2009] which further confers a pulsed character in the fraction of N deposition associated with dust.
3. Results
3.1. Impacts on Biota From Field and Laboratory Experiments: A Synthesis
The dominant impacts of atmospheric deposition on biota in LNLC surface ocean waters are summarized in a compilation of recently conducted dust/aerosol addition bioassay experiments (in situ, in vitro, and mesocosms, see Table 1). Response patterns of changes in standing stocks of organisms, their community structure, and metabolic rates, from comparison of aerosols treatments with the respective control incubations, are presented in Figure 2. Most data sets indicate positive responses to aerosol addition, with bacterial production and N2
fixation showing the strongest responses (average 234% and 193% increase, respectively). A mean 68% increase in Chl a is seen; however, differential responses among phytoplankton groups are also apparent,
Table 2. Main Characteristics of the Model Experimentsa
Model Experiment Fe and P Deposition N Deposition
Deposition Pulses dust (1 g m 2d 1),
N (2.8 mg N m 2d 1) Duration (years)
Standard Monthly Annual None 100
No“D” None None None 100
“D” Monthly, ×5 Annual, ×5 None 100 Pulse Monthly Annual 1 daily pulse, either on
15 of January or on 15 July
100, last year with 1 day pulses
aAdditional experiments, which are not listed in this table have been performed with the model in which N, Fe, and P
atmospheric depositions have been modified individually (set to 0 or current average deposition multiplied by 5). More details on the model setup are given in the Methods section. Atmospheric annual deposition is not constant over time as shown in Figure 1c. This was taken into consideration for example in the scenario“D” where monthly or annual deposition have been multiplied by 5: from year 1900 to year 2100, changes in atmospheric deposition have been calculated to vary by a factor of 2 to 5. The day of the pulse was chosen arbitrarily in January (summer conditions in southern hemisphere) and in July (summer conditions in northern hemisphere).
with cyanobacteria Synechococcus and particularly Prochlorococcus showing weak responses to aerosol addition and nano- and micro-phytoplankton showing a similar increase to that of Chl-a, suggesting that these are related and that aerosol deposition may (temporally) support an increase in larger size class phytoplankton. Despite Chla increase in response to atmospheric deposition events in LNLC waters, the natural tested waters typically remained close to oligotrophic conditions. This may help explain the variable and low response of satellite-derived chlorophyll signals to dust events [Volpe et al., 2009]. Changes in standing stocks tend to be smaller than changes in metabolic rates as shown by comparison of Chl a vs primary production, and bacterial abundance vs bacterial respiration. It should be noted that most of the experiment studies presented in this compilation (Table 1) have been performed using desert dust and many of these have reported the composition of total nutrients content in the dust but few have considered their solubility and hence bioavailability. This is particularly important because desert dust from soils contain very little soluble nitrogen whereas“atmospherically processed dust” is rich in nitrogen. Differences in the source of the material used (e.g., soil vs locally collected aerosols), related composition, and solubility may partially explain the observed variability in response.
Figure 3. Atmospheric deposition as a source of nutrients to the LNLC ocean. (a) Turnover times (years) relative to atmospheric deposition (TTADs) for nitrate (NO3), phosphate (PO4), and dissolved iron (DFe). Areas with low values indicate that
atmospheric supply plays an important role in maintaining nutrient concentrations. (b) Contribution of atmospheric deposition to the total vertical supply of nutrient to the surface mixed layer using both a model (NO3and PO4) and observational (DFe) data (see details in Methods section). Areas with high values indicate that atmospheric supply plays an important role in maintaining nutrient concentrations. Black contour: limits of the oligotrophic gyres (see Figure 1a).
3.2. Contribution of Atmospheric Deposition to the Nutrient Reservoir in the Global Surface Ocean
The mean TTAD in LNLC regions are<1 month for nitrate; TTAD are orders of magnitude higher for phosphate and ~1 year for the few available iron values (Figure 3a). We note, however, that nutrient climatologies are poorly constrained in surface waters of LNLC regions [reported concentrations often being set by the detection limits of conventional techniques; see for example Pulido-Villena et al., 2010] leading to possible overestimation of the TTAD in particular for phosphate, as shown by Figure 3a. This identifies the need for more extensive databases for the depositionfluxes and surface nutrient concentrations; this will also allow to provide TTAD seasonal pattern.
The contributions of atmospheric deposition to the total supply of new nutrients to the surface mixed layer (e.g., sum of vertical and atmospheric supplies) for nitrate, phosphate, and iron, using both a model and
observations are shown in Figure 3b. The calculated contribution is subject to the same shortcomings as the TTAD calculations with respect to the availability of data; however, a similar pattern is apparent indicating that atmospheric deposition could account for a significant proportion of the total input of new nutrients in the oligogtrophic (LNLC) gyres (>50% for N; 0–20% for P and 10–90% for Fe) when lateral advection is not considered.
3.3. Evidence of Impacts on Biota in Models
The sensitivity of ocean biogeochemistry to atmospheric deposition was investigated through a series of model experiments (Table 2 and Methods). The maximal daily anomaly simulated by the model over the last year (year 100) in response to the different scenarios was compared to the standard scenario (in which atmospheric deposition is not altered) by statistical analysis. In thefirst set of model experiments, atmospheric deposition of nitrate, phosphate, and iron was varied individually or in combination over a period of 100 years. For all experiments (both“D” and “no D” experiments) on a global scale (Figure S11), primary production, export production at 100 m, and Chl a did not differ significantly from the standard run (relative change close to 0) and was modest for nitrogenfixation (maximum range % change 30 +30%). However, when considering only LNLC regions (Figure 4), primary production, export production, and N2fixation were significantly impacted by atmospheric supply of nutrients (ranging between 40 and +30%), although Chl a remained almost unchanged. Nevertheless, the simulations never reached the magnitude of responses observed in bioassay experiments (Figure 2) and in some cases showed responses of opposite sign, as with N2
fixation. This inconsistency between experiments and models cannot be explained by differences in temporal frequency of sampling, as we based our model analysis on daily outputs (see Methods), a similar sampling frequency to that of the bioassay experiments (see Table 1). Since the euphotic zone can be significantly deeper than 100 m in these LNLC areas, we also did the analysis for export production at 200 m for the“D” and the “no D” experiments. Relative changes are almost identical to those computed from export production at 100 m (see Figure S12). We therefore refer to export production at the 100 m horizon in this study.
Results from the pulse experiment in which a strong pulse of dust and nitrogen deposition is imposed on 15 January or on 15 July, everywhere in the LNLC regions, similar in magnitude to natural episodic high deposition events and to those used in the aerosols addition experiments (Table 1), were superimposed on the standard climatological atmospheric depositionfields in the LNLC regions (dust = 1 g m 2d 1and N = 2.8 mg N m 2d 1; see Methods and Table 2). These indicate that the projected response to the combined deposition (e.g., present-day average depositionfields plus pulse; Figure 5) was typically much larger than in the“D” and no “D” models; the maximum response averaged over the LNLC regions represented a change
Figure 4. Impact of modification of the mean magnitude of atmospheric deposition on primary production (PP), nitrogenfixation (N2fix), surface
chlorophyll-a (Chla) between surface and 100 m, and export production at 100 m depth (EP), in LNLC regions as computed with the NEMO-PISCES models. Box-Whisker plots (box portion = interquartile range (25th to 75th percentile) of the data set. Horizontal bar within the box = median value. Black square = mean value. Also represented maximum and minimum values) showing relative changes (as percentage) with respect to the standard run using standard climatological atmospheric depositionfields (Figure 1b) described in the Methods and Table 2. These relative changes are computed from the maximum daily response, simulated over the year, following the change in atmospheric deposition (see Methods) and include changes in all nutrients together (total set of 4 experiments): when zero deposition is considered (No“D” experiment; upper panel) and when atmospheric deposition has been multiplied by 5 (“D” experiment; lower panel).
of 123% for primary production, 154% for nitrogenfixation, and 36% for chlorophyll concentration. This also showed close agreement with the results of the bioassay experiments (Figure 5 vs Figure 2) for primary production (PP) and N2fixation but still
underestimated Chl a based biomass growth. It is perhaps intuitive that increasing the intensity of deposition on a short time scale may considerably increase the response. At the same time it is remarkable that those responses are close to the observations from bioassay experiments.
To better characterize the simulated responses to the pulses in our model, we show in Figure 6 the spatial structure of the surface changes induced by the deposition pulse imposed on 15 July (relative to the run without this pulse). A striking characteristic is the large
Figure 5. Impact of one pulse of dust and N (on 15 January or on 15 July) superimposed over the standard climatological atmospheric deposition fields, for primary production (PP), nitrogen fixation (N2fix), surface
chlorophyll a (Chl a) between surface and 100 m, and export production at 100 m depth (EP), in LNLC regions computed using the NEMO-PISCES models (Pulse experiments, see Methods and Table 2). Box-Whisker plots (box portion = interquartile range (25th to 75thpercentile) of the data set. Horizontal bar within the box = median value. Black square = mean value. Also represented maximum and minimum values) showing the maximum daily relative change averaged over the LNLC regions (as percentage) relative to the Standard run.
Figure 6. Surface changes (between surface and 100 m) induced by the pulse addition applied on 15 July (see Methods and Table 2). Maximum relative change in (a) surface Chl a; (b) surface NPP; (c) surface Nfix; (d) export at 100 m; and (e) Residence time (in days) of the most limiting nutrient. The residence time is defined as the duration of the perturbation of the considered nutrient and (f ) maximum relative change in total grazing on phytoplankton.
spatial variability of the response, as inferred from the statistical analysis presented in Figure 5. (Figure 6; maximum response>100% for Chl a, >175% for PP), with more significant response in the oligotrophic gyres of the Pacific, reflecting the diverse local physical and biogeochemical conditions, as is apparent in bioassay experiments conducted at different locations or seasons (Table 1). The increase in PP is accompanied by a similar increase in grazing pressure. Interestingly, the strong pulse imposed in our model experiment is sufficient to trigger a strong increase in PP by small phytoplankton cells, but not by bigger species such as diatoms. Since small phytoplankton are kept in check by (micro-)zooplankton, these increased growth rates induce higher grazing rates and so do not result in accumulation of phytoplankton biomass, as illustrated by the changes in Chl a (Figure 6a).
Export production at 100 m remained generally unchanged (average 0% change) in these model experiments, despite some regionally significant changes in the South Pacific (Figure 6d). The relatively small response of export production to dust deposition may seem quite surprising, especially considering the increase in primary production and the sizable increase in chlorophyll. In fact, as supported byfield and experimental observations reported in this paper (Table 1 and text), this is understandable in LNLC regions, due to the increased bacterial respiration and grazing.
The spatial variability highlighted in Figure 6 can be explained by the very diverse physical and biogeochemical conditions in LNLC regions. The responses to the pulse occur relatively rapidly and have a limited temporal extent, from a few days to about 2 weeks. They tend to be longer in winter time (in either hemisphere) because of the lower light levels, cooler surface temperature, and deeper mixed layer (the latter also resulting to lower mean available light for photosynthesis). Despite a generally strong local response, the pulses do not modify the system over the long term due to their short duration. Indeed, a very simple computation, over the mixed layer, assuming for instance a PP increase following a pulse of 100% for 7 days, the annual PP change would be 100% x7 /365 ~ 2%. The model indicates thus that, the“instantaneous” effect of a single pulse is strong but the annual effect is small.
4. Discussion
4.1. Significance of Atmospheric Nutrients in LNLC Regions
Atmospheric deposition supplies most of the new N and Fe to the mixed layer in some LNLC regions, based upon the comparison of atmospheric deposition with vertical supply from sub-surface waters in both model data and observations (Figure 3b). In the case of P, the atmospheric contribution is low and only significant in the North Atlantic subtropical gyre, and the Eastern Mediterranean Sea. However, surface water phosphate concentrations are overestimated in some regions due to lack of measurements, which leads to incorrect estimation of the vertical supply from below. Our analysis is only intended to be qualitative as it suffers from important shortcomings. For example lateral transport of dissolved inorganic and organic nutrients is not accounted for, although several studies have shown that this can be important, especially at the boundaries of the LNLC regions [i.e., Williams and Follows, 1998]. Also, the dynamic output from the coarse-resolution model does not resolve mesoscale and submesoscale dynamic processes, which may contribute a significant fraction of the vertical and lateral supply of new nutrients [i.e., Williams and Follows, 1998; Pelegri et al., 2006; Lévy, 2008]. Our results are different from those by Krishnamurthy et al. [2010]; see their Figure 2), where atmospheric input is compared to the downward export by sinking particles at 103 m. Here we compare the atmospheric input of N, P, and Fe to the vertical input of these nutrients into the mixed layer by mixing, entrainment, and vertical advection. Both represented ratios do not display the same diagnostic and thus differ. In fact, the vertical supply of nutrients by the ocean dynamics can roughly equal the export at a certain depth only if long time scales are considered, if no nutrients are supplied as dissolved organic materials, and if lateral transport is negligible which is barely never the case in the ocean. An additional explanation to the differences with Krishnamurthy et al. [2010] is that our diagnostic is largely based on data whereas they mainly used model outputs. When using our model output to compute the ratio between the nutrient input by atmospheric deposition and the export at 100 m (Figure S13), as expected, it looks very similar to Figure 2 in Krishnamurthy et al. [2010].
4.2. Variability in Biological Response to Dust Addition in LNLC Regions
The compilation of the experimental results shows a strong variability in the response to aerosol inputs (Figure 2). A similarly high spatial and temporal variability is also simulated by our biogeochemical model (Figures 5 and 6).
Such variability is explained in the model by the heterogeneity in the physical, biogeochemical and ecosystem characteristics of the surface ocean. Nevertheless, additional processes that are not represented in models may generate variable responses in experiments and in thefield. For example, the composition of aerosol deposition is spatially variable (see Figure 1b), and atmospheric inputs may provide the limiting nutrients to sustain productivity but may have additional stoichiometric effects through variability in N:P and Fe:P ratios [Moore et al., 2013], and also the supply of microbes, other trace metals than iron, toxic elements, and other pollutants [i.e., Paytan et al., 2009; Jordi et al., 2012; Després et al., 2012]. The organic nutrient content of atmospheric deposition, for which fewer data exist compared with the inorganic fraction [Kanakidou et al., 2012], may also contribute to the observed variability.
Another cause of the observed variability is related to differences in the natural assemblages of organisms initially present in the bioassay incubation experiments as different LNLC areas do not exhibit the same nutrient limitation or co-limitation [Moore et al., 2013]. This has been shown by Giovagnetti et al. [2013] who observed different changes in the composition and structure of the phytoplankton community and physiological state of the communities whether one dust seeding or a succession of dust seedings were performed in large mesocom experiments. This confirmed that initial seawater conditions (and on-going nutrient availability) are in part controlling the response of the natural assemblage. In areas where elements in atmospheric deposition—such as copper—reach toxic levels, there could be a selective sensitivity to toxins in the deposited material that may cause a shift in species dominance [Paytan et al., 2009] or even a decline in phytoplankton biomass over large areas of the ocean [Jordi et al., 2012].
A striking result from both the experimental andfield observations and the model experiments is the relatively larger changes in metabolic rates compared to changes in standing stocks. This can be attributed to the effect of grazing by zooplankton on phytoplankton and bacteria, which may increase turnover at the expense of stocks and also rapidly propagate responses through the whole food web [Bonnet et al., 2005; Herut et al., 2005; Marañón et al., 2010]. This could result in experimental artifacts in that chlorophyll-a concentration may increase in experiments where grazers arefiltered, but remain unchanged in natural waters. Phosphate addition to surface waters in the Eastern Mediterranean Sea during a Lagrangian experiment caused a negative Chl a response and an increase in abundance of heterotrophs (both bacteria and zooplankton) [Thingstad et al., 2005]. Thus, in addition to the role of the grazers, the potential competitive advantage of bacteria may also explain the small increase of Chl a biomass. The larger increase in bacterial production compared to that of primary production indicates the intrinsically faster metabolism of nutrient-limited bacteria [Marañón et al., 2010], and indicates an increase in organic matter remineralization and a corresponding reduction in carbon export.
The large increase in N2fixation indicates that diazotrophs may disproportionally benefit from a pulsed
increase in dissolved iron and phosphorus, as observed in the eastern tropical North Atlantic [Mills et al., 2004] or alternatively the contribution of other elements by dust, as observed in the Central Mediterranean Sea [Ridame et al., 2011]. As the same dust was used in both experiments, then the apparent discrepancy between their results may reflect differences in the nutrient or biological status of the water at the start of the respective experiments.
4.3. Potential Underestimation of Atmospheric Impacts by Models
Experimental studies performed over short time periods, and thus representative of pulsed inputs, have highlighted the important role of atmospheric deposition for LNLC ecosystem functioning and in particular the activity of heterotrophic bacteria and diazotrophs. Biogeochemical modeling allows extrapolation of the impact of atmospheric deposition over larger space and time scales than laboratory/field experiments. In particular, modeling allows investigations into“cascading effects” (or feedbacks) between regions with contrasting responses and temporal shifts in limitation by different nutrients, and so the net impacts on nutrient cycling and carbon export. In the model scenarios using average atmospheric deposition on yearly or monthly time scales (Figure 4“no D scenario”) and also fivefold increases (Figure 4 “D scenario”), the simulated responses on all timescales never reach the magnitudes observed infield and laboratory aerosol addition bioassay experiments (Figure 2) and at times, responses were even in an opposite direction, e.g., for N2fixation. In addition to highlighting possible problems in model structure or parameterizations
(including deficiencies in the modeled dynamics such as the absence of meso- to submesoscale processes), the disagreement between models and observations may be due to feedbacks that operate at large spatial
and temporal scales that are considered in models but excluded in short-durationfield or laboratory experiments. Another possibility is that models driven by monthly mean or annual-mean atmospheric depositionfields do not capture the highly episodic nature of atmospheric deposition. Indeed, a better agreement between experimental data and models is obtained when a strong pulse of deposition, similar in magnitude to that observed in episodic deposition events (see ref. in introduction) and simulated duringfield and laboratory aerosol addition bioassay experiments, was superimposed over the standard climatological atmospheric depositionfields in the LNLC regions (Figure 5). The observed agreement in the responses of primary productivity and N2fixation following deposition events suggests that atmospheric impacts have so far been strongly underestimated by models, at least on synoptic timescales. These results have direct implications for our understanding of productivity in LNLC regions (e.g., dominant role of atmospheric pulse events).
5. Conclusions and Recommendations
Our new model analysis suggests that at least some of the discrepancies in the biogeochemical response to atmospheric deposition between published global model studies (which are similar in their setup to our standard and“D”/no “D” model experiments) and field and laboratory aerosol addition bioassay experiments may be due to differences in the time-scale and the mode of the atmospheric supply. Thefield and laboratory experiments document important aspects that may not have been captured properly by models. This stresses the need to improve the representation of key processes brought into play by atmospheric deposition in ocean biogeochemical models. Indeed, experimental studies show that the effects of atmospheric deposition on surface ocean productivity in LNLC areas appear to be more complex than a simple, overall“fertilization effect” of increasing phytoplankton biomass that is typical of HNLC regions. The term“fertilization” is often associated with the a priori belief that dust deposition should increase chlorophyll biomass and carbon sequestration (and thus increases atmospheric CO2drawdown). Recent experimental studies [Marañón et al., 2010; Guieu
et al., 2014b] have changed the way we understand dust deposition to the oligotrophic ocean by showing that fertilization predominantly enhances heterotrophic bacterial growth, and thus dust deposition induces the remineralization of DOC, and so reduces atmospheric CO2drawdown. Consequently it is not surprising that
dust deposition is not typically followed by phytoplankton bloom or significant carbon export in LNLC regions. This is apparent even without the consideration of grazing, as demonstrated by the model. Specifically, the strong sensitivity of bacterial production to aerosol addition, and associated competitive interactions between phytoplankton and heterotrophic bacteria, needs to be better represented in models. Another recommendation is to increase the number of modeled functional groups, given that different phytoplankton groups show differential responses to aerosol addition in incubation experiments [ie Paytan et al., 2009; Giovagnetti et al., 2013] (Figure 2). Furthermore, models need to include variable nutrient elemental ratios in atmospheric deposition, in the water column and in organic matter [Krishnamurthy et al., 2010; Moore et al., 2013]. Remaining disagreement in the predicted magnitude of responses between the bioassays and pulsed model may be attributed to processes that are not represented in models. For example, inclusion of relevant processes, such as the impact of aerosol deposition on aggregation and verticalflux, may result in an increase in export in pulsed models. Indeed, experiments and observations have previously indicated that atmospheric deposition can enhance export of particulate organic carbon (POC) to the deep ocean in LNLC regions by facilitating aggregation processes and providing ballast [Armstrong et al., 2002; Ternon et al., 2010; Bressac et al., 2011; Bressac and Guieu, 2013]. This can induce a strong and rapid POC export that is independent of a fertilization effect [Ternon et al., 2010; Bressac and Guieu, 2013; Bressac et al., 2014] that also results in scavenging of trace metals [Wagener et al., 2010; Wuttig et al., 2013; Bressac and Guieu, 2013]. In addition models should be carefully compared to short-duration experiments to test whether they properly represent the key processes brought into play by aerosol addition on all relevant time scale and modes of addition.
These fundamental differences strongly argue in favor of coordinated efforts between modelers and experimentalists to improve models, controlled experiments, andfield data, and to test model results in experimental design. In particular, we did not address in the study the annual effect of a series of pulses: only one pulse was superimposed over the climatological atmospheric deposition; doing a series of pulses in the model would be the next step, based for example on statistics from atmospheric data collected at ie BATS, CVOO, and DYFAMED time series.
Improving our knowledge and understanding of the impacts of atmospheric deposition in LNLC regions and their accurate representation in biogeochemical models is critical as climate models predict changes in both the magnitude and distribution of atmospheric nutrient deposition, and in the size and intensity of LNLC regions. Indeed, deposition of iron, nitrogen, phosphorus, and organic matter has increased considerably since preindustrial times [Duce et al., 2008; Mahowald et al., 2008, 2010], and nitrogen could further slightly increase in the future (Figure 1c). At the same time climate model simulations forced by IPCC-type scenarios and recent satellite observations suggest that anthropogenic global warming may induce an increase in the size of the oligotrophic gyres in all ocean basins [Henson et al., 2010; Steinacher et al., 2010; Polovina et al., 2008] (Figure 7). In most current models, atmospheric deposition of nutrients is kept constant in time and space over the course of the model simulations, and the modeled changes primarily reflect alterations in ocean physics (enhanced stratification, reduced mixed layer depth, and slowed circulation) that reduce the supply of macronutrient (N and P) from below the thermocline. The combination of changes in atmospheric deposition and expansion of the LNLC areas, and associated decrease in supply from below the mixed layer, could result in a shift in the relative availability of different nutrients increasing the relative importance of the atmospheric inputs for ocean biogeochemistry.
We have considered the impact of short variability in aerosol supply to LNLC regions by comparing the response to pulsed addition of aerosols using two different approaches: model and bioassay experiments. These show similar magnitude responses for a number of parameters that are an order of magnitude greater than mean deposition-based models. This confirms that the episodic nature of atmospheric deposition needs to be considered to understand and model temporal variability in LNLC productivity. Improved representation of the effects of deposition in models is clearly important, particularly as (a) atmospheric deposition and the oligotrophic ocean area will change in the future and (b) the episodic nature of atmospheric deposition may have further significant effects that are currently not considered.
References
Antoine, D., J. M. André, and A. Morel (1996), Oceanic primary production: 2. Estimation at global scale from satellite (coastal zone color scanner) chlorophyll, Global Biogeochem. Cycles, 10(1), 57–69.
Archer, D. E., and K. Johnson (2000), A model of the iron cycle in the ocean, Global Biogeochem. Cycles, 14, 269–279, doi:10.1029/1999GB900053. Armstrong, R. A., C. Lee, J. I. Hedges, S. Honjo, and S. G. Wakeham (2002), A new, mechanistic model for organic carbonfluxes in the ocean
based on the quantitative association of POC with ballast minerals, Deep Sea Res., Part II, 49, 219–236.
Aumont, O., and L. Bopp (2006), Globalizing results from ocean in situ iron fertilization studies, Global Biogeochem. Cycles, 20, GB2017, doi:10.1029/2005GB002591.
Aumont, O., L. Bopp, and M. Schultz (2008), What does temporal variability in aeolian dust deposition contributes to iron and chlorophyll distributions?, Geophys. Res. Lett., 35, L07607, doi:10.1029/2007GL031131.
Baker, A. R., and T. D. Jickells (2006), Mineral particle size as a control on aerosol iron solubility, Geophys. Res. Lett., 33, L17608, doi:10.1029/ 2006GL026557.
Blain, S., C. Guieu, H. Claustre, K. Leblanc, T. Moutin, B. Quéguiner, and G. Sarthou (2004), Availability of iron for phytoplankton in the north-east Atlantic Ocean, Limnol. Oceanogr., 49, 2095–2104.
Bonnet, S., and C. Guieu (2004), Dissolution of atmospheric iron in seawater, Geophys. Res. Lett., 31, L03303, doi:10.1029/2003GL018423. Bonnet, S., and C. Guieu (2006), Atmospheric forcing on the annual iron cycle in the Mediterranean Sea. A one-year survey, J. Geophys. Res.,
111, C09010, doi:10.1029/2005JC003213.
Bonnet, S., C. Guieu, J. Chiaverini, J. Ras, and A. Stock (2005), Effect of atmospheric nutrients on the autotrophic communities in a low nutrient, low chlorophyll system, Limnol. Oceanogr., 50, 1810–1819.
Bonnet, S., et al. (2008), Nutrient limitation of primary productivity in the Southeast Pacific (BIOSOPE cruise), Biogeosciences, 5, 215–22. Bopp, L., K. E. Kohfeld, C. Le Quéré, and O. Aumont (2003), Dust impact on marine biota and atmospheric CO2during glacial periods,
Paleoceanography, 18, 1046, doi:10.1029/2002PA000810.
Figure 7. Evolution of the size of oligotrophic areas over 1850–2100, for the historical period (black) and four representational concentration pathways (RCPs) scenarios (RCP2.6 blue, RCP4.5 green, RCP6.0 light blue, and RCP8.5 red).
Acknowledgments
This article was initiated in Istanbul, Turkey during a 2 day workshopfinanced by the European CoOperation in Science and Technology (COST) Action 735“Tools for assessing global air-seafluxes of climate and air pollution relevant gases”. It is a contribution to the The International Surface Ocean - Lower Atmosphere Study (SOLAS) project. We thank L. Legendre and P. Boyd for insightful comments on an earlier version of this manuscript. We also thank the two anonymous reviewers for their helpful review. Model output can be obtained from Olivier Aumont (Olivier.Aumont@ird.fr). The corre-sponding code can be downloaded from the official NEMO website (http:// www.nemo-ocean.eu/).
Boyd, P. W., et al. (2007), A synthesis of mesoscale iron enrichment experiments 1993–2005: Key findings and implications for ocean biogeochemistry, Science, 315, 612–617.
Bressac, M., and C. Guieu (2013), Post-depositional processes: What really happens to new atmospheric iron in the ocean surface?, Global Biogeochem. Cycles, 27, 859–870, doi:10.1002/gbc.20076.
Bressac, M., C. Guieu, D. Doxaran, F. Bourrin, G. Obolensky, and J. M. Grisoni (2011), A mesocosm experiment coupled with optical measurements to observe the fate and sinking of atmospheric particles in clear oligotrophic waters, Geo Mar. Lett., doi:10.1007/s00367-011-0269-4. Bressac, M., C. Guieu, D. Doxaran, F. Bourrin, K. Desboeufs, N. Leblond, and C. Ridame (2014), Quantification of the lithogenic carbon pump
following a simulated dust-deposition event in large mesocosms, Biogeosciences, 11, 1007–1020.
Capone, D. G., J. A. Burns, J. P. Montoya, A. Subramaniam, C. Mahaffey, T. Gunderson, A. F. Michaels, and E. J. Carpenter (2005), N2fixation by Trichodesmium spp.: An important source of new nitrogen to the tropical and subtropical North Atlantic Ocean, Global Biogeochem. Cycles, 19, GB2024, doi:10.1029/2004GB002331.
Cho, B. C., and F. Azam (1990), Biogeochemical significance of bacterial biomass in the ocean’s euphotic zone, Mar. Ecol. Prog. Ser., 63, 253–259. Chung, C. C., J. Chang, G. C. Gong, S. C. Hsu, K. P. Chiang, and C. W. Liao (2011), Effects of Asian dust storms on Synechococcus populations in
the subtropical Kuroshio Current, Mar. Biotechnol., 13(4), 751–763.
Cornell, S. E. (2011), Atmospheric nitrogen deposition: Revisiting the importance of the organic component, Environ. Pollut., 159, 2214–2222. de Boyer Montégut, C., G. Madec, A. S. Fischer, A. Lazar, and D. Iudicone (2004), Mixed layer depth over the global ocean: An examination of
profile data and a profile-based climatology, J. Geophys. Res., 109, C12003, doi:10.1029/2004JC002378.
Desboeufs, K. V., R. Losno, and J. L. Colin (2001), Factors influencing aerosol solubility during cloud processes, Atmos. Environ., 35, 3529–3537. Després, V. R., et al. (2012), Primary biological aerosol particles in the atmosphere: A review, Tellus, Ser. B, 64, 15,598, doi:10.3402/
tellusb.v64i0.15598.
Donaghay, P. L., P. S. Liss, R. A. Duce, D. R. Kester, A. K. Hanson, T. Villareal, N. W. Tindale, and D. J. Gifford (1991), The role of episodic atmospheric nutrient inputs in the chemical and biological dynamics of oceanic ecosystems, Oceanography, 4, 62–70.
Duce, R. A. J., et al. (2008), Impacts of atmospheric anthropogenic nitrogen on the open ocean, Science, 320, 893–897.
Duce, R. A., et al. (1991), The atmospheric input of trace species to the world ocean, Global Biogeochem. Cycles, 5, 193–259, doi:10.1029/ 91GB01778.
Dutkiewicz, S., M. J. Follow, and P. Parekh (2005), Interactions of the iron and phosphorus cycles: A three-dimensional model study, Global Biogeochem. Cycles, 19, GB1021, doi:10.1029/2004GB002342.
Ellwood, M. J., C. S. Law, J. Hall, E. M. S. Woodward, R. Strzepek, J. Kuparinen, K. Thompson, S. Pickmere, P. Sutton, and P. W. Boyd (2013), Relationships between nutrient stocks and inventories and phytoplankton physiological status along an oligotrophic meridional transect in the Tasman Sea, Deep Sea Res., Part I, 72, 102–120.
Foster, R. A., A. Paytan, and J. P. Zehr (2009), Seasonality of N2fixation and nifH gene diversity in the Gulf of Aqaba (Red Sea), Limnol. Oceanogr., 54, 219–233.
Friedlingstein, P., et al. (2006), Climate–carbon cycle feedback analysis: Results from the C4MIP model intercomparison, J. Clim., 19, 3337–3353. Fung, I. Y., S. K. M. Tegen, S. C. Doney, J. G. John, and J. K. B. Bishop (2000), Iron supply and demand in the upper ocean, Global Biogeochem. Cycles,
14, 281–295, doi:10.1029/1999GB900059.
Geng, H., Y. Park, H. Hwang, S. Kang, and C. U. Ro (2009), Elevated nitrogen-containing particles observed in Asian dust aerosol samples collected at the marine boundary layer of the Bohai Sea and the Yellow Sea, Atmos. Chem. Phys., 9, 6933–6947.
Giovagnetti, V., C. Brunet, F. Conversano, F. Tramontano, I. Obernosterer, C. Ridame, and C. Guieu (2013), Assessing the role of dust deposition on phytoplankton ecophysiology and succession in a low-nutrient low-chlorophyll ecosystem: A mesocosm experiment in the Mediterranean Sea, Biogeosciences, 10, 2973–2991.
Guerzoni, S., et al. (1999), The role of atmospheric deposition in the biogeochemistry of the Mediterranean, Sea, Prog. Oceanogr., 44, 147–190. Guieu, C., M.-D. Loÿe-Pilot, C. Ridame, and C. Thomas (2002), Chemical characterization of the Saharan dust end-member; some biological
implications for the western Mediterranean, J. Geophys. Res., 107(D15), 4258, doi:10.1029/2001JD000582.
Guieu, C., et al. (2010a), Large clean mesocosms and simulated dust deposition: A new methodology to investigate responses of marine oligotrophic ecosystems to atmospheric inputs, Biogeosciences, 7, 2765–2784, doi:10.5194/bg-7-2765-2010.
Guieu, C., M.-D. Loÿe-Pilot, L. Benyaya, and A. Dufour (2010b), Spatial variability of atmosphericfluxes of metals (Al, Fe, Cd, Zn and Pb) and phosphorus over the whole Mediterranean from a oney ear monitoring experiment: Biogeochemical implications, Mar. Chem., 120, 164–178. Guieu, C., F. Dulac, C. Ridame, and P. Pondaven (2014a), Introduction to project DUNE, a DUst experiment in a low Nutrient, low chlorophyll
Ecosystem, Biogeosciences, 11, 425–442, doi:10.5194/bg-11-425-2014.
Guieu, C., C. Ridame, E. Pulido-Villena, M. Bressac, K. Desboeufs, and F. Dulac (2014b), Impact of dust deposition on carbon budget: A tentative assessment from a mesocosm approach, Biogeosciences, 11, 5621–5635.
Henson, S. A., J. L. Sarmiento, J. P. Dunne, L. Bopp, I. D. Lima, S. C. Doney, J. John, and C. Beaulieu (2010), Detection of anthropogenic climate change in satellite records of ocean chlorophyll and productivity, Biogeosciences, 7, 621–640.
Herut, B., T. Zohary, M. D. Krom, R. F. Mantoura, P. Pitta, S. Psarra, F. Rassoulzadegan, T. Tanaka, and T. F. Thingstad (2005), Response of East Mediterranean surface water to Saharan dust: On-board microcosm experiment andfield observations, Deep Sea Res., Part II, 52, 3024–3040. Jickells, T. D., et al. (2005), Global iron connections between desert dust, ocean biogeochemistry, and climate, Science, 308, 67–71. Jordi, A., G. Basterretxea, A. Tovar-Sánchez, A. Alastuey, and X. Querol (2012), Copper aerosols inhibit phytoplankton growth in the
Mediterranean Sea, Proc. Natl. Acad. Sci. U.S.A., 109, 21,246–21,249.
Kanakidou, M. R. A., et al. (2012), Atmosphericfluxes of organic N and P to the global ocean, Global Biogeochem. Cycles, 26, GB3026, doi:10.1029/2011GB004277.
Krishnamurthy, A., J. K. Moore, C. S. Zender, and C. Luo (2007), Effects of atmospheric inorganic nitrogen deposition on ocean biogeochemistry, J. Geophys. Res., 112, G02019, doi:10.1029/2006JG000334.
Krishnamurthy, A., J. K. Moore, N. Mahowald, C. Luo, S. C. Doney, K. Lindsay, and C. S. Zender (2009), Impacts of increasing anthropogenic soluble iron and nitrogen deposition on ocean biogeochemistry, Global Biogeochem. Cycles, 23, GB3016, doi:10.1029/2008GB003440. Krishnamurthy, A., J. K. Moore, N. Mahowald, C. Luo, and C. S. Zender (2010), Impacts of atmospheric nutrient inputs on marine biogeochemistry,
J. Geophys. Res., 115, G01006, doi:10.1029/2009JG001115.
Laghdass, M., S. Blain, M. Besseling, P. Catala, C. Guieu, and I. Obernosterer (2011), Effects of Saharan dust on the microbial community, during a large in situ mesocosm experiment in the NW Mediterranean Sea, Aquat. Microb. Ecol., 62, 201–213.
Lamarque, J. F., G. P. Kyle, M. Meinshausen, K. Riahi, S. Smith, D. P. van Vuuren, A. Conley, and F. Vitt (2011), Global and regional evolution of short-lived radiatively-active gases and aerosols in the Representative Concentration Pathways, Clim. Change, 109, 191–212.
Lamarque, J.-F., et al. (2010), Historical (1850–200) gridded anthropogenic and biomass burning emissions of reactive gases and aerosols: Methodology and application, Atmos. Chem. Phys., 10, 7017–7039.