OCT 21 1960
L IB RARN
A DOUBLE BEAM CESIUM CLOCK
by
ROBERT GOLUB
B.S.E.E., The City College
(1959)
SUBMITTED IN PARTIAL FULFILLMENT OF THE REQUIREMENTS FOR THE DEGREE OF
MASTER OF SCIENCE at the
MASSACHUSETTS INSTITUTE OF TECHNOLOGY
September 1960
Signature of Author
Department of Electrical Engineering, August 29, 1960
Certified by
' Phesist~u'pervis'upvo
Accepted by_ ___W _ __
A DOUBLE BEAM CESIUM CLOCK
by
ROBERT GOLUB
Submitted to the Department of Electrical Engineering on August 29, 1960 in partial fulfillment of the requirements for the degree of Master of Science.
ABSTRACT
The effects of phase shifts in the Ramsey method of Atomic Beam Magnetic Resonance are discussed and it is shown that it is possible to cancel these effects by the use of two beams traveling in opposite directions through the two r-f cavities. It is also shown that the two beams will not cancel the other sources of error but these errors can be made negligibly small. Results obtained with only one beam are shown.
Thesis Supervisor: John Gordon King Title: Associate Proffessor of Physics.
ACKNOWLEDGEMENT
I would like to thank Professors J. R. Zacharias and J.G. King for suggesting the problem and for many valuable suggestions.
I would also like to thank Dr. F. F.C. Vessot who worked on the apparatus before me for his advice on many occasions.
Mr. R. Weiss contributed his time to many valuable discussions. I would also like to thank the very competent technical staff of the Atomic Beam Laboratory, Messrs. F. J. O'Briaana, J. J.MCLean and M. A. Kelly for their most helpful assistance.
Other members of the staff of the Research Laboratory of Electronics were also of great help on many occasions.
TABLE OF CONTENTS Page
Abstract ii
Acknowledgement iii
I Introduction 1
II Theory 3
Molecular Beam Magnetic Resonance
Rabi Method 3
Ramsey Method 5
Phase Shifts in the Ramsey Method 8
III Experimental Apparatus 10
Source 10 Deflecting Magnets 11 Detector 11 Vacuum System 12 Offset Geometry 13 R-F System 13 IV Experimental Results 15 Appendix 17 References 19
(1)
INTRODUCTION
In the Ramsey method of Atomic Beam Magnetic Resonance of
with separated oscillating fields there are a numbersexper-imental factors which may shift the appareat- line frequency. One of these factors ia the existence of a phase shift between the two oscillating fields, The effects of phase shift on the transition probability are discussed in detail under"theory
It is shown that the effect of phase shift may be cancelled by having two beams of atoms going through the same oscillating cavities in opposite directions.
Following is a short discussion of some other possible causes of shifts in apparent resonant frequency and the effects of the double beam arrangement on these shifts:
A difference between the fixed field amplitude in the
oscil-lating cavities and the average amplitude in the intermediate region will cause a shift in frequency. This case is analyzed in detail by Haun Ref. (7) who plots curves of the shift in
frequency versus the difference in fixed field oamplitudes for different values of r-f power. Haun assumes that the fixed field has the same magnitude in each oscillating cavity. It is obvious from symmetry considerations that this shift will not be eliminated
by the use of the two beams.
Ramsey Ref. (8) shows that if the static field has the same amplitude in one oscillating cavity as in the intermediate region, but is allowed to vary in the second oscillating cavity that there will be a shift. In the Appendix it is shown that if the fields in the oscillatory cavities are slightly different from that in the intermediate region and from each other there will be no elimination of the shift by the two beams. If there is present
(2)
in the oscillatory cavities perturbations of more than one frequency, Ramsey ref. ( 8,9) shows that there will be a shift in apparent resonant frequency.
It is thus apparent that the two beams will only cancel the shifts in resonant frequency due to the phase shifts.
The other shifts are usually small due to the small field dependence of the lines so that the error due to phase shift is one of the major errors in a carefully designed apparatus. As the accuracy of frequency standards is increased it becomes nec-cesary to have a reliable means of eliminating this error.
(3)
THEORY
Molecular Beam Magnetic Resonance, Rabi Method
The molecular beam resonance method was first used to measure nuclear, molecular, and atomic properties by Rabi and his associates in 1938 (Ref. 1). The method is a general technique for radio frequency spectroscopy. The method also provides a method of stabilizing the frequency of radio frequency oscillations (Ref. 2,3,4).
A description of the method follows:
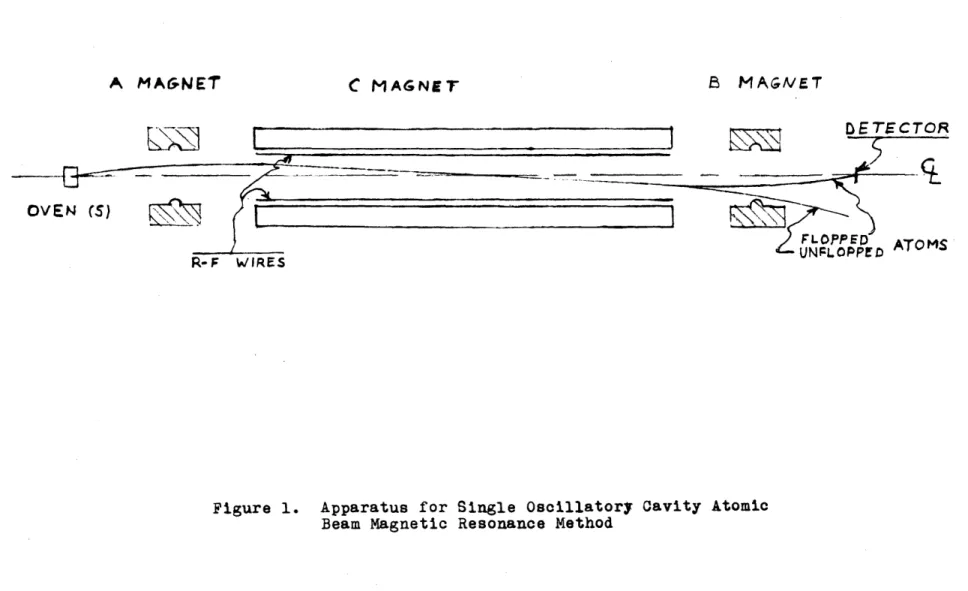
The apparatus, as shown in Fig. 1, consists of a source of neutral atoms (S), two magnets producing strong inhomogeneous fields (A and B magnets), a magnet producing a weak homogeneous field (C magnet), r-f wires to produce an oscillating magnetic field, and a detector which can detect neutral atoms impinging on it. The entire system is under vacuum.
Atoms leave the source, which forms a collimated beam
and are deflected in the A magnet by virtue of their effective magnetic moment:
where 9 is the energy of the atom in the field and H is the mag-netic field strength. Assume for the present that nothing happevs in the C region. The atoms then continue in a straight line
through the C region and enter the B magnet. Since the B magnet is identical to
C MAGNET
LX h
OVEN (5)
ATOMS
R-F WIRES
Figure 1. Apparatus for Single Oscillatory Cavity Atomic Beam Magnetic Resonance Method
ETECTOR
I
(4)
the A magnet the atoms will be further deflected in the B magnet and will not hit the detector (unflopped atoms). If however, the frequency of the oscillating field is such as to produce a transition from one energy level of the atom to one which has an effective magnetic moment opposite in sign to that of the original state the deflection in the B magnet will be in the opposite direction of that in the A magnet and the atoms will hit the detector (flopped atoms). The frequency necessary to produce this condition is given by the Bohr frequency condition
where
1/$
W
are the energies of the two states in question and)/
is the frequency of oscillating field necessary to cause the transition.The Heisenberg uncertainty principle
aE4t
>.
A
limits the accuracy to which we can determine
Y
to6
Y 4 t
7%'
4
t is given by the time the molecule spends in theoscil-lating field A
where
L
is the length of the C region and Iris the velocity of the atoms. It would seem from this that the measurement of thespectral line could be made to arbitrary precision simply by increasing the length of C region. However this is difficult to do in practice because of the experimental difficulty of obtaining uniform fields ithrough large regions of space. Since the energy
(5)
inoagenei'ties in the field will cause the energy and hence the
resonant frequency to vary along the beam and the resonance pattern will be broadened. Thus there is a practical limit to the accuracy which can be obtained with this method.
Ramsey (Ref. 5, 6) has introduced a method which produces
resonant frequencies dependent on the average field in the C region thus enabling the use of longer C regionsand which produces re-sonances which are 40% narrower than the older method even if completely homogeneous fields are available.
Atomic Beam Magnetic Resonance, Ramsey Method of separated oscil-lating fields
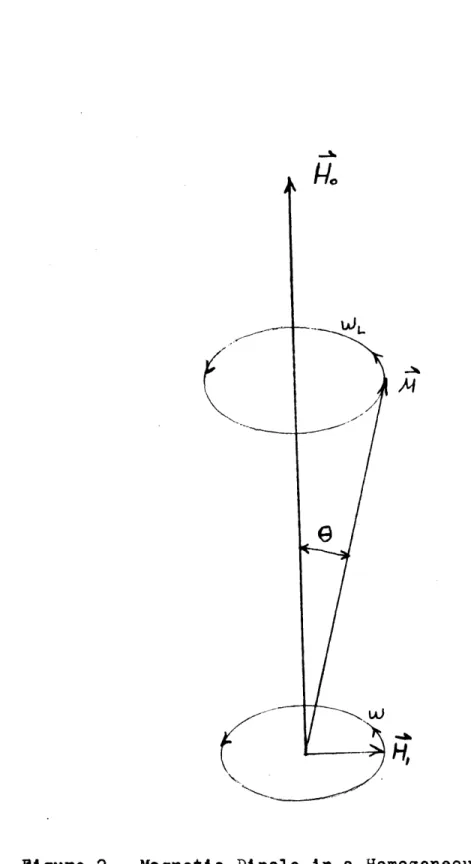
Ramsey's method consists of applying the oscillating field in two small regions (cavities) near the beginning and end of the 0 region. In order to get a physical picture of what happens consider the following classical analogue. A magetic dipole
moment A enters a homogeneous magnetic field
1/.
Superposed on this field is a small rotating magnetic fieldH,
perpen-dicular to No (Figure 2) and rotating about it with angular frequency W/ . In the absende of HM the magnetic moment will process aboutIe
with the Larmour frequencyW4
where L is the inagnitute of the angular momentum associated
with
A.
In the presence of the magnetic moment will tend to precess aboutH
as well as/9,
hence the effect ofM
will beto change the angle
0
between Af and14
. However if the fre-quency at which the field rotates (tv)is different than W/ the changes in Q will tend to average out and there will be no met change.A
GM
Figure 2. Magnetic Dipole in a Homogeneous Field with Oscillatory Perturbations.
(6)
If the frequency of the rotating field is equal to the Larmour frequency, the rotating field will be in synchronism with the magnetic dipole and there will be a net change in
0
. Consider thatOis zero when the particle enters the first oscillating field region. Then if the magnitute of H, is properly chosenand W= W'k it is possible for G to equal 700when the particle
leaves the oscillating field. In the intermediate region the magnetic dipole moment precesses with the Larmour frequency. When the magnetic dipole moment reaches the second cavity it will still be in phase withthe rotating field because W= W , Since the second cavity is identical to the first, Qwill again be increased by 900 so that the net change in Swill be 1800
(ie the atom will be flopped). This classical treatment cor-responds to the quantum case of a transition between energy
levtls separated by A w. .
An outline of the quantum treatment of the problem will now be given. (Ref. 5,,6, 10).
Consider a nucleus of spin I=b magnetic moment AA
gyromagnetic ratio fr -'1 /*g
-4 superposed on
in a constant magnetic field No/which is a small field
9,
perpen-dicular to and rotating aboutH.
with an angular frequency W. The net field " 4.H =
No
-
,
( 0u
S
-v Ht
The energy of the nucleus in the magnetic field is then:
where
(7)
The matrix element of the perturbation is
where
h
tSimilarly
V0.0
i~e
*
The diagonal elements
We now consider that the above perturbation acts on a system with two possible eigenstates p, and q.
The wave function for such a system is
and the Schroedinger wave equation is
substituting the assumed form of into this equation we obtain
multiplying by or and integrating overall space using the orthoganAlity and normalization conditions:
we obtain
ift Spit): //jtgl)E
4p
,4It)
4
Cs/$)4cibi, ~ ~ Igg)+6 ' 1 k)gtj Eg I & p4)s~
These equations have been solved by Ramsey (Ref. 10) for arbi-trary initial conditions. They are applied by him to the case of a single oscillating field and to the case of two separated oscilating fields.
(8)
Phase Shifts in the Ramsey Method of Atomic Beam Resonance If there is a relative phase shift between the two oscil-lating fields as may very well be the case due to the experi-mental difficulty of keeping two cavities, separated from each other in space, in phase with each other, Ramsey shows the transition probability for an atom to go from state/* to state is given by:
' near resonance
/w,_
4-for the second oscillating field to lead the first by a phase angle . The notation used is Ramsey's (Ref.lO,11)
2' = length of time the atom spends in each of the oscil-lating fieldsassumed to be of equal lengths
= &7= velocity of atoms
T = length of time the atom spends in the intermediate region. If this region is of length L,
7":
/.-theenergy of the atom averaged over the inter-mediate region for each state.
This probability is seen to have a maximum at
A.5:a
ofie
W= W, - S7:=W',"- 1r1
Since this shift in resonant frequency i velocity dependent it should be possible to detect the presence of phase shift
(9)
this later.
If the above transition probability is averaged over the usual velocity distribution in the beam the following results
(Ref. 7,1 2.0 ,11 )
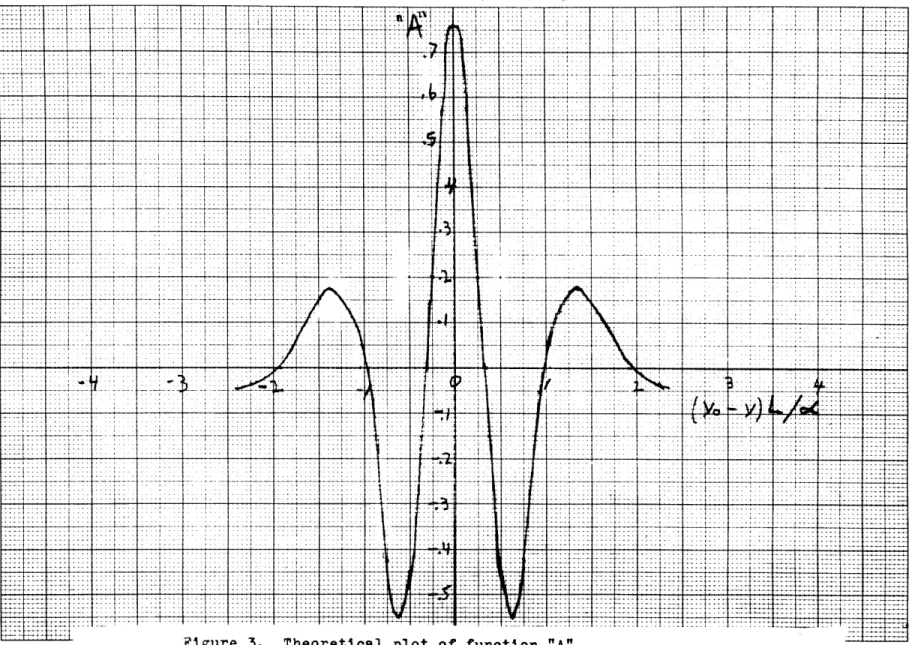
A, B are functions of , and Land the most probable velocity:
These functions are plotted in Ref. (10 & 11) and are shown in Figures (3 and 4) for , 7rwhich is the value of per-turbation for the maximum transition probability. From these figures it is seen that A is symmetric about the resonant fre-quency while 6 is antisymmetric. Thus the term 6sin5 leads to a shift in frequency of maximum average transition probability. Holloway (ref.12 ) has plotted the transition probability vs.
frequency for various values of phase shift, . Holloway also
gives the shift of resonant frequency, 1 as
er - , -. (half width of central peak) is in radians
for phase shifts less than 50.
In order to eliminate the source of error it has been sug-gested (Ref. 13 ) that two beams be allowed to go through the same cavities in opposite directions, so in effect each beam sees a phase shift of opposite sign. The 6sin term will then be of opposite sign for each beam and the effect of phase shift can be eliminated by adding the curves from each beam.
... . . . 4 . " -. 7177 7 -- - - -- ---- - - -- ----
. . ..
.
. .. . . ... - T ---- --- --7:7- T t 7-~ r- 4 --- --- T -1 - - --*- ---- - - - - -- t--- t---* - - + -- --- ---- ---- 7 -t+~~+ - - -,.-.--t- 4.4 . f . V -4 1 - --- - -
its
-.. -- --- r --- -- - -- --j4
-r 1 1 --- -. . -. - -- - - -, - - - - -- --- . . .4; 4 W .. .. .l . . . .. . ...t
" - - ---t----
++++-4. - LE~~ - ~ ++ .... L.. . .... .4. . ...+
+- . .- + -+ +-4-+
e. ---- -+-+- -+ -e- + --4
.- +-A-t
+ +9-
e + + * , . + 4 .. . -- .- .-. ...4 ... .. . . . .. . . .. . . . - . -.-- ... ._ .. - N..72.
i
K
.
.+f
.
.
t -- +-- --4 + - ++ ++ - - ' ++ 4a . - + t + + 4 -+ + 4+ ++t + + +- t+ . .*-- -- -+ + -4 * - - - -- + ..- -- *- '--4 .-*- * .-- * - - -- ---. - -*. . ' + -+ -+ + +- +.+ -4 .. + .. * . -+.e *.- . - - --- e ++-a -- + + .+ + .. . 4 ... .4+ + .. i .. .. . .+ ++ - .. f++- ...- -- ++ -- -. -- -e..,...p. M .... 8..;.0.. . . - ..- 4- . - -. <- . -.-- -. -. a. . -. ..-. -...- *-s- - . . .. + +-+ - --- 4-- ' '-i + + M e + -+ - + -- - -- --- -. +- .- ti * . e + + .' '- - +++ .+ - 4'' -- + . . - - - -- - --- - - -- -*. -. * -.- .--+. *** '-'.+.--+ -. . , -e
++ * + .*-. + - .4-.
+- - ' + * .-4 'A
+ --4 + * *it
, -+ -+i
. + .. + * - * * *.-. -. *.*'' . .+ .+ . .. + - * .. * * . ..- - * * . * * -- - - * .- * * * * .. * * + .- -* ++*. *-.-. - " 4 + + -+- -+ .-- ' * * -. ... *. -- f + + - + .-.-- - - - ... * * + * . * * . ' * - * * - .* - ' +- . .ei .4+ ' .. . . . * + + + . + -- + *4- *-. *-t .- + .* * * -t --* -+ ..+ -4 -- -.-. + * * - i -e + + + + + e -+ -- + t . . . ..4 . -- - . + + ..-.- -+ + . . --+ + + + -e - + --.. - e --.- -. .. . ..- -. 4. -. ...- -. ... +-- -4 .e .4 ..+ .. + , , -+ , -, .-..-1 ., -..-- -.+ , , +-. e .b -+ --+ .e . .. e , . . + ..+ --- ., e . e - + + + - * + -- - -- ---- - * --+ * - --- -..-. ..-. -.. -.e ..-. -.- .. -. -. +.e .. +.+-+ og . ..--.. . +4 + +. .4 - - 7 -- 4 + -- --f 4 + -+ 4 + +.4. + - +. ---. . - .-- -. ----.Im -.+4- -- .+ - -.. ---- --. -+ + -- + -- -+ . ++4,
.. .+ . , .. . 4 . . . .~~~~.. ..- . ... . . . . .. . . ... , - .. . . . . . . . .. . . +- . ---.. , + . -, . ... , .. .. . ... .. - .... . . . . + . . . 4 --4~~~ . . ...- -4. .. ...- ++ .~~ . . .+. - - -- -.- -.- ---.-- ++ .- +- -0 -+ + - - + + -- - *-- - - . . . + + , -- t + +e
- - 4 . - - - . . . ... . . . . ..- - - . . . . . . .. ... + - - - .+ 44 -+-. - - 4 T ++ -. ++ ++-. 4..+ ++ + '.-+ + +.t
Ii
~
VI~.II lif
LIi.If1..~.tr.Iw4 ~t
+++
H+t--.U1I~d- .. ... .. ...
--++ -4 . IK .. 42 4>4.4 - . + +
-Figure 4. Theoretical plot of function "B"
+t ++ r+ + . +4-T -44i:-i+ 4.+ -4 ~1 *-~~ I' 'ii I it it I I H 4 -i + + -- + ++ -*-+
---(10)
EXPERIMENTAL APPARATUS
As mentioned above the experimental apparatus is such as to
enable two beams of Cesium atoms to pass through the oscillating field cavities in opposite directions. The apparatus is the same as
was used by Haun (Ref.7) except that the waveguide and detector structures have been replaced by Dr. R.F.C. Vessot. The apparatus is laid out as shown in Fig. 1 except that only one beam is shown. The 0 region is modified so that ther-f is applied in two cavities
near the beginning and end. The actual apparatus has the ovens, and detectors offset from center and the deflecting magnets are at a slight angle with respect to the center line (ref. 3). SOURCE
The sources consist of two stainless steel blocks between which are placed a crinkly foil slit. (see Ref. 14). A copper
wire gasket is used to prevent leakage around the crinkly foil. The crinkly foil has the advantage of giving excellent beam
collimation because of the small size of each individual passage-way, while the large number of passages provides an adequate beam intensity. The Cesium is obtained from glass ampoules which are placed in a soft copper tube sealed at one end and hard soldered to the ovenblocks. The apparatus is sealed with the ampoule un-broken. When the system is under vacuum the ampoule is broken by means of a rod which is moved from outside through a bellows seal. The oven is mounted on a platform which can be moved by means of the same rod which is used to break the ampoule. The oven platform was designed by Dr. R.F.C. Vessot. During the petiod of two years for which the apparatus was stored in the basement, one of the ampoules was broken and the Cesium had been oxidised. The
(11)
ampoule was replaced as was the copper tube which held it.
DEFLECTING MAGNETS
The deflecting magnets are the same ones used by Haun
(Ref, 7 ) . They are of Alnico V permanent magnets with Armco iron pole faces. They are provided with windings.for recharging, The connections to these windings are brought out of the vacuum system so that it is possible to recharge the magnets without opening the system.
DETECTOR
The beam is detected by a hot tungsten wire which is placed in the beam path (Ref. 14). Cesium atoms lose an electron on the hot tungsten surface. The ionized Cesium is accelerated
by means of a series of accelerating and focusing electrodes
which was built by Dr. Vessot. The ions are passed through a magnet which acts as a mass spectrometer cutting down the
back-a
ground of other types of ions to the first stage of/secondary emission multiplier. The multiplier is an 11 stage Allen type multiplier, operated at about 270 volts per stage. The plates are made of Beryllium copper formed into the correct shape by
dies. (Ref.14 ) The plates were degreased with water and acetone and then polished with American Optical Company, Number M305
emery powder. They were then stored under acetone until they were fired under vacuum by induction heating. They were heated a dull red for about fifteen: minutes. The voltage dropping resistors were 5 megohm resistors which didn't have any coating or marking on them. They were spot welded to the plates before firing so that the multipliers were fired with the resistors in place.
(12)
The output of the photomultiplier is fed into an electro-meter. The electrometer used was part of a Bayard-Alpert
ioni-zation gauge circuit designed by S. Aisenberg of the Research Laboratory of Electronics.
VACUUM SYSTEM
The vacuum system was designed by Prof. Zacharias and is described by Haun. (Ref. 7 ). It consists of a vertical stainless steel can six feet high and ten inched in diameter. The apparatus slides into the top of the can. All electrical connections are brought out through ceramic insulated connectors brought out through a large brass plate at the top of the can. Th entire apparatus is attached to two aluminum U channels which are bolted to the brass top plate. The top plate is soldered to the can thus sealing the apparatus from the atmosphere. The can is connected by a horizontal pipe to the vacuum pumps. The main pump is a Qonsolidated Vacuum Corporation MCF-300-01 oil diffusion pump used with Dow-Corning No. 703 silicone diffusion pump fluid. The booster pump is a CVO MCF 60-01 pump. A Welch duo-seal pump is used as a fore-pump.
Directly above the main diffusion pump is a liquid air trap.
and dry ice/ The liquid air is surrounded by a vacuum jacket
which is part of the vacuum system and which in turn is surrounded
by the dry ice.
As the system had been stored in the basement for two years the can and pumps were given a thorough cleaning with acetone and then dried out with a stream of compressed air.
Pressures as low as 6X10⁻⁸mm of mercury have been observed
(13)
OFFSET GEOMETRY
From the Uncertainty Principle it is seen that the time that the atoms spend in the C region should be as long as possible for the line width to be as narrow as possible. This can be acheived by longer C regions. Further improvement can be obtained by using slower atoms.
Slower atoms will suffer greater deflections in the inhom-ogeneous deflecting magnets than faster atoms. If axial line up is used only one half of the gap width is effective in deflecting the atoms whereas offset geometry permits the use of the full gap width thus permitting larger deflections and slower atomic velocities.
By adjusting the offsets of ovens and detectors it is
possible to select a certain band of velocities. This method can be used to shift the resonant frequency (due to the velocity dependence of the effect of phase shift ) and obtain a value for the phase shift which can be compared with that obtained
from comparing the two beams. R-F SYSTEM
The power for the oscillating fields was obtained from runs
aphase locked klystron. The initial/were made with a system
constructed by Dr. Vessot. Another system is under construction. The only difference between the two systems is that the newer one uses an I-F frequency of 1 Mc while the system built
by Dr. Vessot uses 200 kc as an I-F frequency. The system is
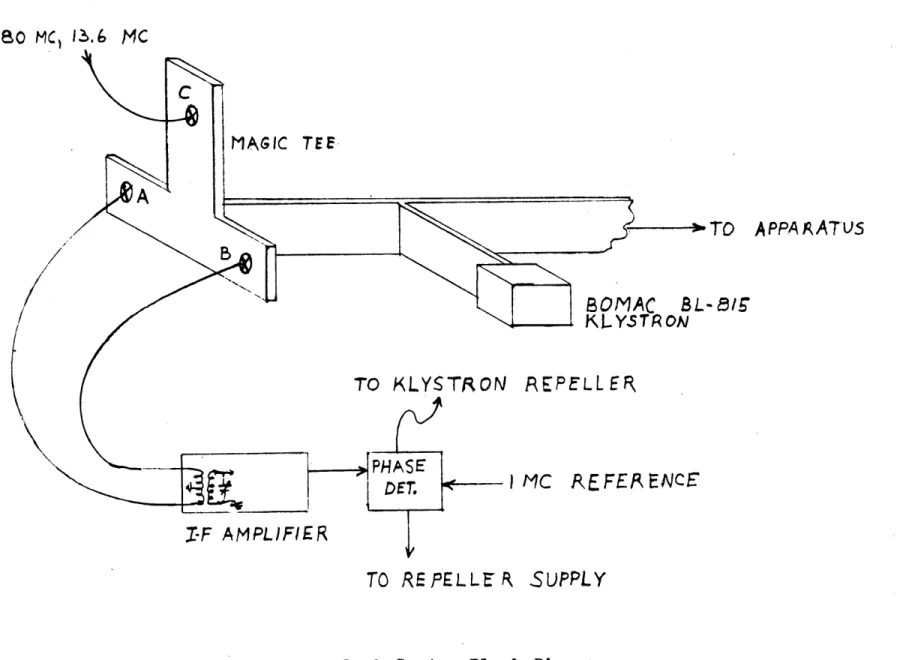
shown in fig. 5. C is a crystal diode which forms harmonics of 180 Mc. The 180 Mc signal is derived by vacuum tube harmonic multiplication from a Hycon Ultra Stable oscillator which is
MAGIC TEE _/7 TO APPA
AATU5
80MAC
SL-B5E
KLYSTRON TO KLYSTRON AEPELLERA
PHASEr 7
IMC
AEFEPENCE
2-F
AMPLIF/ER TO REPELLERSUPPLY
Figure 5. Klystron Phase Look System-Blook Diagram. 180 MCI 13.6
MC
(14)
checked weekly against a National Company Atomichron Cesium beam frequency standard. The 51st harmonic of 180 Mc ie 9,180 Mc is formed in crystal diode mixer C which mixes it with the 13.6
Mc interpolation frequency (derived from a crystal oscillator )
to form a signal of 9193.6 Mc. This signal is beat against the
klystron in crystal mixers A and B which are mounted in the two balanced arms of a magic tee. The beat signals are fed into
the balanced input of the I-F amplifier, amplified and compared in a phase detector to a 1 Mc reference signal obtained from a General Radio 805 signal generator. The do output of the
phase detector is connected in series with the klystron repeller supply voltage. Any tendency for the klystron to shift frequency willo cause the relative phase between the lMc reference
and the I-f signal to shift thus changing the dc output of the phase detector which changes the klystron repeller voltage in such a direction as to counteract the initial frequency change thus holding the klystron frequency at 9192.6 Mc. The klystron frequency is swept by mechanically sweeping the frequency of the GR 805 reference signal. The phase lock system was designed by Prof. C.L. Searle of the MIT Electrical Engineering Department.
(15)
EXPERIMENTAL RESULTS
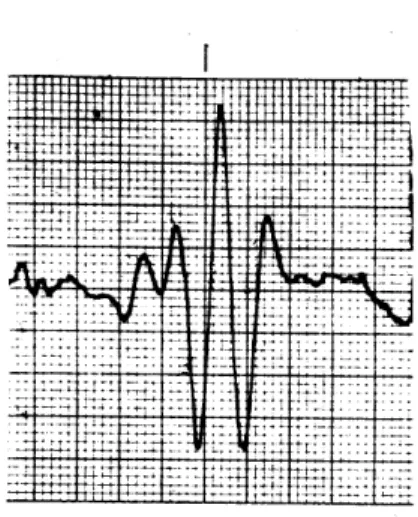
Runs were made with the downward traveling beam. The frequency of the oscillatory field was varied at a constant rate as explained under "Experimental Apparatus". The output of the
detector electrometer was fed into a Sanborn recorder. The curves obtained represent beam strength vs. frequency or in other words transition probability vs. frequency. Typical curves obtained are shown in Fig. 6.
The rate of sweep was such that each small division repre-sents a frequency change of 50 cycles per second. The line width is setAto be 150 cycles/second.
Ramsey ref. gives the line width as
For Cesium 'at 800C the most probable velocity A is
In the apparatus
f
Therefore)/=
176 cycles/sec.The experimentally observed narrower lines are due to the offset geometry which selects slower atoms.
It is unfortunate that the signal to noise ratio was net great enough to allow the magnitude of the phase shift to be estimated by the asymmetry of the beam intensity vs. frequency curve. The large amount of noise is due to the fact that the oven was overheated causing Cesium to flow out of the slits and form
deposits on the outside of the oven. This had the effect of replacing the fine well collimated crinkly foil sourcewith a very diffuse uncollimated source. As a result of this there
(16)
were a large number of unflopped atoms reaching the detector and fluctuations in this caused the large noise.
I~
I:ff
iiHVI
IilI
*1
I
SAN 9RFigure 6. Experimental plots of Beam Intensity vs. Frequency
44 141 V4t. =r RTI
4::
(17)
APPEN.DIX
Consider that the fields inthe two cavities are slightly different so that the Larmour frequency is given by , in the first cavity and 01 in the second cavity. Further let the Lar-mour frequency in the intermediate region be 0 . These
frequencies enter into the transition probability in the following
forms:.' hw 3I-2(A /
L*$9- : ^owp<5' {p/,'.w)q
S/4P=
-2.
/a!=.-2k.4
Ramsey ref.
(
10) gives the solution to the differentialequations for Ck (see page 7 ) with the atom entering the oscillatory region where the Larmour frequency is at time
L,
subject to arbitrary initial conditions as.
00
'Nsi
a-ty
~ili
-N+-where fare the energy levels of the atom in the constant
field.
By successive applications of these equations to the case
where the atoms travel through a region of Larmour frequency
W/. for a time Z , then through a region of no perturbation and average Larmour frequency 9, for a time
T
and then through a region with Larmour frequencyi/,l
for a time 2P we obtain to first order in ( 4-a' ) and (0.0'):
(18)
w4
ere
The transition probability is given by (de .y1g q,,,,
$,
C
en
{{ ter)2.51j C'C 1A oA7
In order to determine whether there will be a difference in frequency shift for the two beams we note that the second beam which travels through the two cavities in the opposite direction to the first beam will have & and
0
4 and a) reversed.Since the above expression for is symmetric in these quantities we conclude that there will be no elimination of this source of
(19)
REFERENCES
1. I. I. Rabi, S. Millmen,P. Kusch and J. R. Zacharias. Phys. Rev. 55,526 (1939)
2. H. Lyons, Annals of N.Y. Academy of Science
55,831 (1952)
3. Zacharias, J.R., Yates, J.G., and Haun R.D.
35th Quarterly Progress Report, Research Laboratory of Electronics, MIT
4. Essen, L. and Parry, J.v.L.
Nature 176 , 280 (1955) 5. N. F. Ramsey Phys. Rev. 76, 996 6. N.F. Ramsey Phys. Rev. 78, 695 7. R. D. Haun,
A Study of Polarization Effects on
Cesium 133 Hyperfine Structure
PhD. Thesis, MIT Dept.of Physics,1957
8. N. F. Ramsey
Shapes of Molecular Beam Resonances in Recent Research in Molecular Beams. Edited by I. Estermann, Academic Press,
1959. 9. N. F. Ramsey
Phys.Rev. 100, 1191
10. N. F. Ramsey
Molecular Beams
Oxford at the Clarendon Press, 1956
11. N. F. Ramsey
(20)
12. J. H. Holloway,
Precise Measurements of the Hyperfine Structure of the Stable Chlorine Isotopes PhD. ThesisDept. of Physics,MIT (1956)
13. J. R. Zacharias,
Progress Report of the MIT Group presented at the Third Brookhaven Conference on Molecular Beams Nov. 1957
Proceedings of the Third Brookhaven Conf. on Molecular Beams published by Associated Universities, Inc.
14. J. G. King and J. R. Zacharias
Advances in Electronics and Electron Physics
