Abstract. We numerically and experimentally evaluate the impact of the inhomogeneity of the microwave field in the cavity used to perform double-resonance (DR) Ramsey spectroscopy in a buffer gas alkali vapour cell. The Ramsey spectrum is numerically simulated using a simple theoretical model and taking into account the field distribution in a magnetron-type microwave resonator. An experi-mental evaluation is performed using a DR pulsed optically pumped (POP) atomic clock. It is shown that the sensitivity to the micro-wave power of the DR POP clock can be reproduced from the com-bination of two inhomogeneities across the vapour cell: microwave field inhomogeneity and atomic ground-state resonance frequency inhomogeneity. Finally, we present the existence of an optimum operation point for which the microwave power sensitivity of our DR POP clock is reduced by two orders of magnitude. It leads into a long-term frequency stability of 1 ´ 10–14.
Keywords: microwave-power frequency shift, microwave field ampli-tude inhomogeneity, double-resonance clock, POP clock, rubidium, magnetron-type cavity, vapour cell.
1. Introduction
Vapour-cell frequency standards combine reduced volume and power consumption while maintaining excellent frequency stability performances. Among the laboratory prototype clocks are continuous-wave (cw) [1 – 3] or pulsed optically pumped (POP) [4 – 6] double-resonance (DR) clocks, or cw [7] or pulsed [8, 9] coherent population trapping (CPT) clocks. Compact cold caesium atomic clocks [10] are also currently in development. Most of the recent laboratory atomic clock prototypes demonstrate frequency stabilities at t = 1 s in the range of (2 – 6) ´ 10–13 t–1/2 and reach in the medium-to-long terms the level of 10–14, for integration times larger than t > 104 s. The main limiting factors on these time scales arise from the clock frequency sensitivities to instabilities in the atoms’ environment: light source’s intensity or frequency through the light shift effects, the microwave power, other environmental parameters such as residual static magnetic field, temperature, atmospheric pressure [11], and humidity.
Ultimately, the long-term stability of the atomic clock is limited by aging processes.
In the case of rubidium (Rb) vapour-cell DR POP atomic clocks, the origin of the clock frequency sensitivity to the vari-ations of the amplitude of the microwave field in the reso-nance cell was identified to result from two distinct mecha-nisms. The first mechanism is due to the cavity pulling effect which is related to the frequency mismatch between the rubid-ium ground state splitting frequency and the microwave-cavity resonance frequency [12]. The second mechanism is the posi-tion-shift effect. The resonance frequency of a group of Rb atoms will be different from another group of atoms in the vapour cell because of inhomogeneous electric, magnetic and electro-magnetic (EM) fields. The measured clock frequency is a weighted average of the resonance frequencies of each group of atom. Any change in the microwave power will modify the weighting inside the vapour cell which results in a clock fre-quency change [13, 14]. Note that this description is valid only for buffer gas cells in which the change of position of each atom during a Ramsey cycle may be considered as negligible.
In this work, we evaluate the impact of the microwave magnetic field amplitude inhomogeneity and its weighting of the atomic resonance frequencies distributed within the cell on the pro perties of the central Ramsey fringe with an empha-sis on its (1) contrast, (2) full-width-at-half-maximum (FWHM), and (3) central fringe centre-frequency (CFCF) detuning obtained in a DR POP Rb clock experiment. We first review the basic theoretical model describing the DR POP scheme in the 3-level approximation. We decompose our vapour cell into a 3D mesh (of 1800 points) where each point of the mesh has different value of microwave magnetic field amplitude (based on the simulated microwave magnetic field amplitude distribution for the magnetron-type micro-wave cavity used in our Rb clock prototype) and a different atomic resonance frequency. We evaluate the impact of the microwave magnetic field amplitude inhomogeneity by mea-suring the mentioned characteristics of the Ramsey central fringe in our DR POP clock prototype for various microwave powers. Finally, the results are discussed and we demonstrate that the microwave-power sensitivity of our DR POP atomic clock can be reproduced from the presence of microwave magnetic field amplitude inhomogeneity and atomic ground-state resonance frequency distribution across the cell.
2. Theoretical model
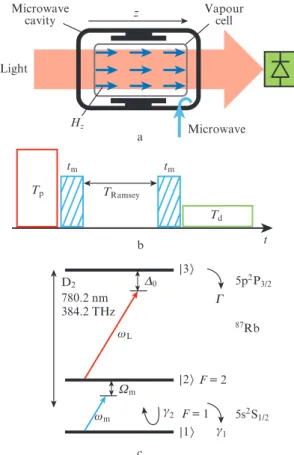
In this section, the double-resonance interaction (Fig. 1a) in the 3-level approximation of the 87Rb D
2 line (Fig. 1c) is described according to the theory presented in [12, 15].
Impact of microwave-field inhomogeneity in an alkali vapour cell
using Ramsey double-resonance spectroscopy
W. Moreno, M. Pellaton, C. Affolderbach, N. Almat, M. Gharavipour, F. Gruet, G. Mileti
W. Moreno, M. Pellaton, C. Affolderbach, N. Almat, M. Gharavipour, F. Gruet, G. Mileti Laboratoire Temps-Fréquence, Institut de
Physique, Université de Neuchâtel, Avenue de Bellevaux 51, 2000 Neuchâtel, Switzerland; e-mail: [email protected]; [email protected]
The DR POP scheme theory can be understood physically using Bloch’s vector representation. The atomic population is optically pumped into one of the ground state (Fig. 1b). As demonstrated in [12, 15], the state of the atomic popula-tion, at the end of the Ramsey scheme, can be expressed as the matrix product (in the rotating wave approximation):
R(tend) = Mm(tm)MD(TRamsey)Mm(tm)R(0), (1) where tend = TRamsey +2tm is the duration of the Ramsey scheme and t = 0 corresponds to the end of optical pumping. The matrix Mm describes the microwave interaction and is given by [12, 15]: Mm(t) = ( ) ( ) ( ) ( ) ( ) ( ( )) ( ) ( ( )) ( ) cos sin sin sin cos cos sin cos cos t t b t t b t b t b t b t b t 1 1 m m m m m m 2 2 2 2 2 2 2 2 x x x x x x x x x x x x x x x x x W W W W W W - + -+ J L K K K K K K K N P O O O O O O O . (2) Here, x2 = W2 m + b2, where b is the microwave Rabi frequency. In the case of zero microwave detuning, the matrix Mm is
reduced to a rotation matrix around the y axis by an angle
q = btm, which is usually called the microwave pulse area and represents the rotation angle of the Bloch vector during one microwave pulse in the Bloch sphere representation. The matrix MD describes the free evolution of the Bloch vector R(t) and is given by [12, 15]: MD(t) = ( ) ( ) ( ) ( ) ( ) ( ) ( ) ( ) ( ) exp cos exp sin exp sin exp cos exp t t t t t t t t t 0 0 0 0 m m m m 2 2 2 2 1 g g g g g W W W W --
-f
p
, (3) ( ) ( ( )) ( ( )) ( ) Re Im R t t t t 2 2 12 12 d d D =f
p
, (4)where d12 is the ground state coherence; D = r22 – r11; and rii is the density of atoms in one of the ground state levels | iñ.
The Ramsey spectrum is obtained by computing R3(tend) = D (tend) as a function of the microwave frequency detuning Wm . The cell volume is decomposed into a mesh with the divi-sion sizes given below. Size of the absorption cell diameter
/
mm . . . 25 length/
mm . . . 25 Size of the subdivisions Dx/
mm . . . 2 Dy/
mm . . . 2 Dz/
mm . . . 1 Optical absorption cross section s13/
m2 . . . 1.3 ´ 10–15 s23/
m2 . . . 1.6 ´ 10–15 n0/
m–3 . . . 2.89 ´ 1017 Theoretical D2 linewidth of the optical transition, G/GHz . . . 2.5 Population and coherence relaxation rates g1/
Hz . . . . 360 g2/
Hz . . . . 340 A certain value of the microwave magnetic field amplitude is associated to each point of the mesh and the Ramsey spectra are computed using the matrix product (1) at each point assuming a perfect optical pumping. With the Beer – Lambert law applied for the optical detection pulse (see Fig. 1b), the intensity at the end of the vapour cell is given by: I j ( ) ( )exp ( ) I Li cell 0 i n ii z j 3 0 T s r = e-/
z o, (5) where I(0) is the detection light intensity at the entrance of the vapour cell; si3 is the optical absorption cross section for the transition | iñ ® |3ñ; rii(zj) is the density of atoms in one ofthe ground state levels at the point zj
; and Dz is the z-axis inte-gration step.
3. Experimental setup
The numerical simulations are compared with the Ramsey spectra measured using our POP DR Rb atomic clock proto-type. Details of the clock were previously presented in [3, 5]. Our clock prototype is based on a home-made 87Rb-enriched vapour glass cell, 25-mm long and 25 mm in diameter, with a D2 780.2 nm 384.2 THz G g1 g2 TRamsey Tp t Td z Vapour cell Microwave cavity Light Microwave tm Hz b a c tm D0 Wm wL wm |1ñ |2ñ |3ñ 5p2P 3/2 5s2S 1/2 87Rb F = 2 F = 1
Figure 1. (a) Double-resonance interaction scheme, (b) POP timing
scheme, and (c) three-level approximation of the 87Rb D
2 line. Here, Hz is magnetic field strength of the microwave signal; wL and wm are the
optical and microwave frequencies; Di
0 = w3i – wL is the laser frequency
detuning (i = 1, 2 are the numbers of the components of the ground state); Wm = w21 – wm
is the microwave frequency detuning; G is the ex-ited state linewidth; g1 and g2
are the ground state population and co-herence relaxation rates, respectively; Tp, tm, and Td are the duration of
the laser optical pump, microwave, and optical detection pulses, respec-tively; and TRamsey is the Ramsey delay.
buffer gas mixture of argon and nitrogen (PAr /PN2 = 1.6). The laser used for both optical pumping and detection pulses is frequency stabilised to one of the sub-Doppler transition fre-quencies, | 2S 1/2, F = 1 ñ ® | 2P3/2, F' = 0 / F' = 1 ñ or | 2S1/2, F = 2 ñ ® | 2P 3/2, F' = 3 ñ, of the 87Rb D2 line. The microwave cavity is a magnetron-type cavity [16] with a loaded quality factor of QL = 185. The microwave magnetic field amplitude distribu-tion is shown in Fig. 2. The clock setup is operated in the POP DR scheme [4] where the duration of each pulse is set as fol-lows: Tp = 0.4 ms, tm = 0.3 ms, TRamsey = 3 ms, and Td = 0.7 ms.
4. Results
In this section, the Ramsey spectrum is obtained in three cases: numerical simulation with homogeneous microwave magnetic field amplitude distribution, numerical simulation with inhomogeneous microwave magnetic field amplitude distribution, and measurement using our POP Rb clock. These Ramsey spectra are obtained for different values of the microwave pulse area q = btm with b µ Pm and for a fixed tm. Here, Pm is the microwave power. For each spectrum, we are interested in its contrast, full-width-at-half-maximum, and CFCF detuning.
4.1. Ramsey spectrum
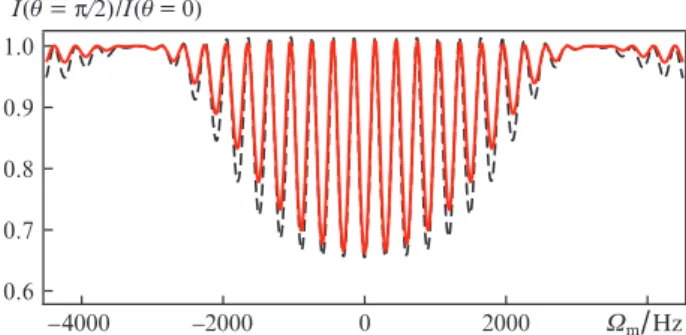
Figure 3 presents the calculated light intensity at the end of the vapour cell I(q = p/2) as a function of the microwave frequency detuning Wm and the measured Ramsey spectrum. The light intensity is obtained according to equation (5) after one cycle of microwave interrogation described by equa-tion (1) in the case of p/2 microwave pulses considering the microwave magnetic field amplitude distribution of Fig. 2 with the experimental conditions listed above. The Ramsey spectra are normalised to the light intensity detected at the end of the vapour cell in the absence of any microwave inter-rogation (i.e. Pm = 0). In the low microwave detuning region, we obtain a good agreement between the Ramsey spectrum measured using our POP Rb atomic clock and the computed one.
4.2. Central fringe contrast
The variation of the contrast of the central Ramsey fringe in Fig. 4 as a function of the microwave power corresponds to the population oscillations in the ground state. It is equivalent to the Rabi oscillations where the ground state population varies with the combined microwave pulse area 2q. Experi-mentally, we detect the change in the transmitted light at zero microwave frequency detuning as a function of the micro-wave power. The contrast of the central fringe is defined as the relative change in the optical absorption [5]: –10 –5 0 5 x
/
mm –5 0 5 y/
mm 0.75 0.80 0.85 0.90 0.95 1.00 10 x/
mm 0 –10 0 y/
mm 0 10 20 z/
mm 10 0.2 0.4 0.6 0.8 1.0 N o rm al is ed H z N o rm al is ed H z a bFigure 2. (a) Simulated microwave magnetic field distribution inside
the vapour cell performed at the Laboratory of Electromagnetics and Acoustics (LEMA-EPFL) and (b) transverse distribution of the mag-netic field at z = 9 mm. 1.0 0.9 0.8 0.7 0.6 –4000 –2000 0 2000 Wm
/
Hz I(q = p/2)/I(q = 0) Figure 3. Simulated (solid curve) and measured (dashed curve) Ramsey spectra. 0.5 0.4 0.3 0.2 0.1 0 btm/p 2.5 2.0 1.5 1.0 0.5 0 R(Pm)Figure 4. Rabi oscillations simulated for (solid curve) homogeneous
and (dashed curve) inhomogeneous microwave field and (points) measured Rabi oscillations (Ramsey spectrum central fringe contrast) at Wm
I I ( , ) ( , ) R 1 P 0 0 0 m m m W W = -= = . (6)
The quantity R obtained numerically as well as experi-mentally is shown in Fig. 4. The results are consistent with the Rabi oscillations measured using our POP Rb atomic clock and with previously reported observations [5]. 4.3. Central fringe FWHM Figure 5 presents the FWHM of the central Ramsey fringe as a function of btm. The central Ramsey fringe is obtained via measurement and simulation in the cases of homogeneous and inhomogeneous microwave field amplitude distributions. Let wH be the half width at half maximum (HWHM) of the central fringe (wF = 2wH). Figure 5 presents the values of wF determined from the wH solution of the equation: TRamsey wH + 2f0(b, wH) = p/2, (7) where
f0(b, wH) = arctan sincos( ( ) )
b t t 1 H H m m 2 w2 w xx + -e o. (8)
A good agreement between the inhomogeneous micro- wave magnetic amplitude distribution case and the measure-ment is obtained. Moreover, we obtain a good agreewave magnetic amplitude distribution case and the measure-ment between the homogeneous microwave magnetic amplitude case and wH solution of equation (7).
4.4. Central fringe frequency shift
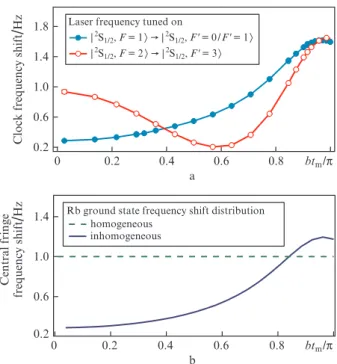
Figure 6a presents the measured microwave-power sensitivity of our DR POP clock. The frequency of the central fringe of the Ramsey spectra simulated as a function of btm is shown in Fig. 6b. The numerical calculation was performed taking into account not only the microwave magnetic amplitude dis-tribution of Fig. 2 but also a ground-state frequency shift Df(r, t) dis tribution among the vapour cell. Two cases are con-sidered: homogeneous frequency shift distribution [Df(r, t) = 1 Hz] and inhomogeneous frequency shift distribution. In order to reproduce the experimental data, at each point of the mesh, we assumed the following empirical frequency shift dis-tribution that mimics a residual coherence at the end of the optical pump pulse [12]: Df(r, t) = Cexp ( , )r t T sin ( , )rt T 1 1 op p op p 2 0 2 0 2 0 g d d d G G - + + + e e o o e o, (9)
where C is an empirical constant; Gop(r, t) is the optical pumping rate; and d0 = 2D0 /G. The analysis of the physical origins of this inhomogeneous shift will constitute the subject of a separate study. Two of the main candidate effects are however already identified: the AC Stark shift and the residual coherence after optical pumping pulse.
5. Analysis and discussion
In the case of a homogeneous microwave magnetic field amplitude distribution, all the atoms in the vapour cell undergo the same microwave pulse. All the groups of atoms produce the same Ramsey spectrum and are identical to the output Ramsey spectrum. Its contrast is maximal for the (p/2 + np) pulse and is zero for (p + np) pulse. For a p pulse, no fringes are observed and the FWHM cannot be defined, which explains the discontinuity of the wF(btm) dependence at btm = p in Fig. 5. For an inhomogeneous microwave magnetic field ampli-tude distribution, different groups of atoms in the vapour cell undergo slightly different microwave pulses. It results that the output Ramsey spectrum is an average of each Ramsey spec-trum generated inside the cell. The consequence is that a residual central fringe at btm = (p + np) is in this case present. Thus a non-zero contrast (Fig. 4) and the wF (Fig. 5) can be determined for btm = (p + np).
The microwave-power sensitivity of the CFCF is repro-duced as consequence of two inhomogeneities: rubidium ground-state resonance frequency shift distribution and micro-wF
/
Hz 180 160 140 120 100 btm/p 2.5 2.0 1.5 1.0 0.5 0 Calculation Solution of Eqn (7) 1/(2TRamsey) Figure 5. Simulated FWHM of the Ramsey spectrum central fringe for( ) homogeneous and ( ) inhomogeneous microwave field distribu-tions, and ( ) results of experimental measurements. 1.8 1.4 1.0 0.6 0.2 C lo ck f re q u en cy s h if t
/
Hz Laser frequency tuned on
|2S 1/2, F = 1ñ ® |2S1/2, F' = 0/F' = 1ñ |2S 1/2, F = 2ñ ® |2S1/2, F' = 3ñ 1.4 1.0 0.6 0.2 C en tr al f ri n ge fr eq u en cy s h if t
/
H z btm/p 0.8 0.6 0.4 0.2 0Rb ground state frequency shift distribution homogeneous inhomogeneous b btm/p 0.8 0.6 0.4 0.2 0 a
Figure 6. (a) Measured microwave power sensitivity of the clock
fre-quency and (b) simulated microwave power sensitivity of the central fringe frequency. Frequency shifts are presented with respect to the fre-quency of 6.8346868658 GHz.
wave magnetic field amplitude distribution. The output Ramsey spectrum is an average of the Ramsey spectra gener-ated from each group of atoms in the vapour cell. Each group of atoms has a contribution that depends on the microwave pulses that they undergo. However, for a homogeneous reso- nance frequency shift distribution each group of atoms con-tributes with a different weight but with the same frequency shift (e.g. no shift is induced by the microwave coupling), which explains the absence of microwave-power sensitivity of the CFCF. In the case of an inhomogeneous resonance-fre-quency shift distribution, the inhomogeneous microwave field weights these various local shifts. When changing the microwave power (q = btm µ P tm m) the weight distribution changes which gives rise to the microwave-power sensitivity of the CFCF in Fig. 6.
Finally, the experimental data of Fig. 6a shows that an operation point exists to reduce the microwave-power sensi-tivity coefficient in our POP DR clock. This occurs when the laser frequency is tuned on the | 2S
1/2, F = 2 ñ ® | 2P3/2, F' = 3 ñ transition and for a microwave pulse with btm = 0.57p. In this condition, we measured a microwave-power sensitivity coefficient at the level of 4.5 ´ 10–14 mW–1 which is two orders of magnitude lower than the previously reported coefficient [17]. Operating our DR POP clock in these conditions, we have reported a long-term relative frequency stability of 1 ´ 10–14 [18].
In conclusion, we have analysed the impact of the micro-wave magnetic field amplitude inhomogeneity on Ramsey spectroscopy. Based on a theoretical model describing the Ramsey spectroscopy, we demonstrated the impact of the microwave field amplitude inhomogeneity and the resonance-frequency distribution on the Ramsey spectrum, in particular on the contrast, the FHWM, and the frequency detuning of the central fringe. We obtained excellent agreement between the numerical simulation and the measurement in each case. Especially, we demonstrated that the microwave-power sensi-tivity of our POP DR atomic clock can be reproduced from the presence of two inhomo geneities: microwave-power inhomogeneity and atomic resonance frequency inhomogene-ity. Further studies are necessary in order to study and ideally suppress the latter.
Acknowledgements. This work was supported by the Swiss National Science Foundation (SNSF Grant No. 156621). The authors thank M. Dürrenberger and P. Scherler (both LTF, University of Neuchâtel, Switzerland) for technical support. We also thank A. Skrivervik and A.E. Ivanov (EPFL-MAG, Switzerland) for fruitful collaborations on microwave cavity developments and simulations.
References
1. Mei G., Zhong D., An S., Zhao F., Qi F., Wang F., Ming G., Li W., Wang P., in Proc. 2016 European Frequency and TimeForum (EFTF) (York, 2016) p. 275.
2. Hao Q., Li W., He S., Lv J., Wang P., Mei G. Rev. Sci. Instrum.,
87, 123111 (2016).
3. Bandi T., Affolderbach C., Stefanucci C., Merli F., Skrivervik A.K., Mileti G. IEEE Trans. Ultrason., Ferr., Freq. Control, 61 (111), 1769 (2014). 4. Micalizio S., Calosso C.E., Godone A., Levi F. Metrologia, 49, 425 (2012). 5. Kang S., Gharavipour M., Affolderbach C., Gruet F., Mileti G. J. Appl. Phys., 117, 104510 (2015). 6. Dong G., Deng J., Lin J., Zhang S., Lin H., Wang Y. Chin. Opt. Lett., 15, 040201 (2017).
7. Cyr N., Tetu M., Breton M. IEEE Trans. Instr. Meas., 42, 640 (1993).
8. Abdel Hafiz M., Coget G., Petersen M., Calosso C.E., Guérandel S., de Clercq E., Boudot R. Appl. Phys. Lett., 112, 244102 (2018).
9. Yun P., Tricot F., Calosso C.E., Micalizio S., Francois B., Boudot R., Guerandel S., de Clercq E. Phys. Rev. Appl., 7 (11), 014018 (2017).
10. Esnault F.-X., Blanshan E., Ivanov E.N., Scholten R.E., Kitching J., Donley E.A. Phys. Rev. A, 88 (14), 042120 (2013).
11. Moreno W., Pellaton M., Affolderbach C., Mileti G. IEEE Trans.
Ultrason., Ferr., Freq. Control, 65 (8), 1500 (2018).
12. Godone A., Micalizio S., Levi F. Phys. Rev. A, 70 (12), 023409 (2004).
13. Risley A., Busca G., in 32nd Annual Symposium on Frequency Control (Atlantic City, NJ, USA, 1978) p. 506.
14. Micalizio S., Godone A., Levi F., Calosso C. Phys. Rev. A, 79 (11), 013403 (2009).
15. Vanier J., Audoin C. The Quantum Physics of Atomic Frequency
Standards (Philadelphia: Adam Hilger, 1989).
16. Stefanucci C., Bandi T., Merli F., Pellaton M., Affolderbach C., Mileti G., Skrivervik A.K. Rev. Sci. Instrum., 83, 104706 (2012). 17. Gharavipour M., Affolderbach C., Kang S., Bandi T., Gruet F., Pellaton M., Mileti G. J. Phys. Conf. Ser., 723, 012006 (2016). 18. Affolderbach C., Almat N., Gharavipour M., Gruet F.,
Moreno W., Pellaton M., Mileti G., in IEEE International
Frequency Control Symposium (IFCS) (Olympic Valley, CA, USA, 2018) p. 1-6, DOI: 10.1109/FCS.2018.8597452.