HAL Id: hal-03096326
https://hal.archives-ouvertes.fr/hal-03096326
Submitted on 4 Jan 2021
HAL is a multi-disciplinary open access
archive for the deposit and dissemination of sci-entific research documents, whether they are
pub-L’archive ouverte pluridisciplinaire HAL, est destinée au dépôt et à la diffusion de documents scientifiques de niveau recherche, publiés ou non,
Elastography of the Breast
Jean-Luc Gennisson
To cite this version:
Jean-Luc Gennisson. Diagnostic Accuracy of Four Levels of Manual Compression Applied in Supersonic Shear Wave Elastography of the Breast. Academic Radiology, Elsevier, 2020, �10.1016/j.acra.2020.03.012�. �hal-03096326�
For Peer Review
Should manual compression be applied in Shear Wave Elastography of the breast?
Journal: Journal of Clinical Ultrasound Manuscript ID JCU-19-118
Wiley - Manuscript type: Research Article
For Peer Review
Should manual compression be applied in Shear Wave
Elastography of the breast?
ABSTRACT
Purpose: to investigate whether manual pressure should be applied in Supersonic shear wave
elastography (SSWE) of the breast and to assess the impact of compression on SSWE results.
Materials and methods: International review Board was obtained for this prospective study.
SSWE was performed on 60 breast masses (26 benign and 34 malignant) in 54 patients between April to September 2013. Stiffness values were compared between benign and malignant masses in the absence of and during increasing degrees of compression. Accuracy of SSWE was assessed using Receiving Operating Caracteristics (ROC) analysis.
Reproducibility was assessed using Intraclass Correlation Coefficient (ICC).
Results: Without compression, we observed no significant difference in stiffness (P>0.99)
between benign and malignant lesions, and SSWE demonstrated low accuracy (AUC=0.64). When compression was applied, stiffness increased according to the degree of compression (P <0.001). For a given level of compression, malignant masses were stiffer than benign lesions (P <0.001) and SSWE demonstrated good performance (AUC= 0.71 to 0.84) with high inter-observer agreement.
Conclusion: Avoiding compression is not appropriate in SSWE for breast lesion
characterization. On the contrary, application of compression yields high diagnostic 3 4 5 6 7 8 9 10 11 12 13 14 15 16 17 18 19 20 21 22 23 24 25 26 27 28 29 30 31 32 33 34 35 36 37 38 39 40 41 42 43 44 45 46 47 48 49 50 51 52 53 54 55 56
For Peer Review
KEYWORDS
Shear wave elastography; compression; breast lesion characterization; variability. 3 4 5 6 7 8 9 10 11 12 13 14 15 16 17 18 19 20 21 22 23 24 25 26 27 28 29 30 31 32 33 34 35 36 37 38 39 40 41 42 43 44 45 46 47 48 49 50 51 52 53 54 55 56 57 58 59 60
For Peer Review
INTRODUCTION
Elastography is a recent imaging technique, which assesses tissue stiffness and improves characterization of breast lesions1,2. Strain elastography, which evaluates stiffness by
measuring the relative deformation of tissue with repeated manual compression, is a semi quantitative method. Theory states that, unlike strain techniques, Shear Wave Elastography (SWE) is an entirely automated process that does not require any manual compression to assess tissue stiffness3. In Supersonic Shear Wave Elastography (SSWE), compression waves
are generated and focused automatically by the US transducer in order to shear the tissue. Stiffness quantification is obtained by measuring the speed of the resulting shear waves. On the basis of this automated acquisition process, the technique is considered to be: 1) truly quantitative, which means it would be able to measure the ‘absolute’ stiffness of a tissue whereas strain techniques would only provide ‘relative’ stiffness assessment and 2) independent of the operator and therefore highly reproducible3–5. In order to benefit from
these advantages, manual compression should theoretically not be applied in SSWE of the breast6–8. On the basis of this theory, early publications using SSWE stated in their materials
& methods that they applied ‘no compression’5,6,9–11. However, in clinical practice, a mild
compression is naturally used to generate the B mode image, and there is usually at least the weight of the transducer against the skin. A more marked compression is also sometimes necessary in some situations to generate an analyzable image on B-mode US. In addition, it has been observed that without compression, some cancers can appear to be surprisingly ‘soft’ using SSWE12. As a result, investigators recognized elsewhere the need to apply a ‘light’ or
‘slight’ compression when acquiring SSWE images13–15. However, to our knowledge, there
3 4 5 6 7 8 9 10 11 12 13 14 15 16 17 18 19 20 21 22 23 24 25 26 27 28 29 30 31 32 33 34 35 36 37 38 39 40 41 42 43 44 45 46 47 48 49 50 51 52 53 54 55 56
For Peer Review
of SSWE quantitative results have also not been investigated. However, it is crucial to clarify this point for it can have a major impact on the use and interpretation of SSWE. In this context, the objectives of our study were to investigate whether manual compression should be applied on the breast when acquiring SSWE images in the clinical setting. We also aimed to assess the impact of manual compression on quantitative SSWE results and inter-observer reproducibility. 3 4 5 6 7 8 9 10 11 12 13 14 15 16 17 18 19 20 21 22 23 24 25 26 27 28 29 30 31 32 33 34 35 36 37 38 39 40 41 42 43 44 45 46 47 48 49 50 51 52 53 54 55 56 57 58 59 60
For Peer Review
MATERIALS AND METHODS
1) Population and inclusion criteria
A local ethics committee approved this prospective study, requiring patient information and non-refusal, but waiving informed consent.
From April to September 2013, consecutive patients with breast lesions undergoing
ultrasound were included in this study. Inclusion criteria were as follows: 1) patient with BI-RADS 3, 4 or 5 breast lesions according to the fifth edition of BI-BI-RADS lexicon16 2) visibility
of the lesion under ultrasound and 3) patient was verbally informed and given a refusal form. Exclusion criteria were: prior personal history of breast cancer, patient under the age of 18, patient refusal to participate in the study. A radiologist (XX, with 10 years and 4 years of experience in breast US and breast SWE respectively) performed all ultrasound examinations. In a subgroup of 18 patients, a second radiologist (XX, with 1 year and 6 months of
experience in breast US and breast SWE respectively) repeated the SSWE acquisitions to evaluate reproducibility. When the second operator was available, patients who did not refuse were consecutively enrolled in this reproducibility study. Histology of breast masses was obtained by core needle biopsy. In cases where biopsy was not performed (for BI-RADS 3 probably benign lesions), two-years US follow-up was obtained. Stability at two years was considered to confirm the benign character of the lesion.
2) Image acquisition and manual compression 3 4 5 6 7 8 9 10 11 12 13 14 15 16 17 18 19 20 21 22 23 24 25 26 27 28 29 30 31 32 33 34 35 36 37 38 39 40 41 42 43 44 45 46 47 48 49 50 51 52 53 54 55 56
For Peer Review
Examinations were performed using the Aixplorer® ultrasound system (SuperSonic Imagine, Aix en Provence, France) using a clinical superficial probe (SL 15-4).
First, stiffness of all lesions was measured without any pressure applied on the breast (no compression). Attention was paid that a layer of gel remained visible between the probe and the skin to ensure that any physical contact between the transducer and the breast was avoided.
We subsequently repeated stiffness measurements with increasing degrees of pressure applied on the breast: first, the transducer was laid on the skin without any additional pressure, the operator holding the transducer cable (mild compression). Then the weight of the operator’s hand was added to the transducer but no deliberate pressure was applied. The forearm and the wrist rested on the patient’s chest wall (‘moderate compression’). Finally, the operator
applied a deliberate pressure on the breast with the probe (‘marked compression’). In all situations, attention was paid to obtain a satisfactory ultrasound B-mode image.
3) SSWE analysis
On each image, the tissue stiffness of each pixel on the SSWE image was displayed as a semi-transparent color map ranging from dark blue to red (corresponding to the default settings: 0– 180 kPa). The color map was set to include the mass and the surrounding breast tissue. A ROI was placed to include the whole mass and surrounding breast tissue, including the stiffest part of the lesion as previously described17. Maximum (Emax) and mean elasticity (Emean) values
within the ROI were collected.
4) Reproducibility 3 4 5 6 7 8 9 10 11 12 13 14 15 16 17 18 19 20 21 22 23 24 25 26 27 28 29 30 31 32 33 34 35 36 37 38 39 40 41 42 43 44 45 46 47 48 49 50 51 52 53 54 55 56 57 58 59 60
For Peer Review
Two radiologists, independently repeated stiffness measurements for all degrees of
compression in a subgroup of 18 breast lesions. Tissue compression was performed according to the predefined method of compression as detailed above in the section on “Image
acquisition and manual compression”.
5) Statistical analysis
Results for maximum diameter and elasticity values (Emax and Emean) and average
difference of stiffness values between the two operators are given as mean ± 95% Confidence Interval (CI).
Differences in stiffness between benign and malignant lesions were assessed using a two-way ANOVA with Bonferroni correction for multiple comparisons. Area Under the Curve (AUC) of Receiving Operator Characteristic (ROC) curves was calculated to evaluate the
performances of SSWE for the differentiation of benign from malignant lesions for each degree of compression.
For the reproducibility study, an Intraclass Correlation Coefficient (ICC) was calculated to assess the inter-observer agreement, as previously described18. A Bland and Altman plot was
drawn and a Wilcoxon matched-pairs signed rank test was used to assess systematic bias between the two operators.
The P values calculated were two-sided, and P<0.05 was considered a statistically significant difference. Statistical analysis was performed using GraphPad® Software, (version 5.04, San Diego CA, USA).
3 4 5 6 7 8 9 10 11 12 13 14 15 16 17 18 19 20 21 22 23 24 25 26 27 28 29 30 31 32 33 34 35 36 37 38 39 40 41 42 43 44 45 46 47 48 49 50 51 52 53 54 55 56
For Peer Review
RESULTS
1) Study population
Sixty breast masses (26 benign and 34 malignant) in 54 patients (53 women and one man), average age 56 years (range 23-90), were included in this study. Histology was obtained for all malignant and for 22 benign lesions. Histology was not available for 4 probably benign lesions, which were followed for two years, and remained stable in size and appearance. All malignant lesions were surgically excised. Histopathological analysis of the 34 malignant lesions showed 30 invasive ductal carcinomas (88%), 3 invasive lobular carcinomas (9%) and 1 mucinous carcinoma (3%). Pathological analysis of the 22 biopsied benign lesions showed 10 fibroadenomas (45%), 3 collagenous stroma (14%), 2 papillomas (9%), 1 gynecomastia (5%) and 3 cystic changes (14%).
Mean maximum diameter was 18 (4) mm for malignant lesions and 17 (5) mm for benign lesions
2) Effect of compression
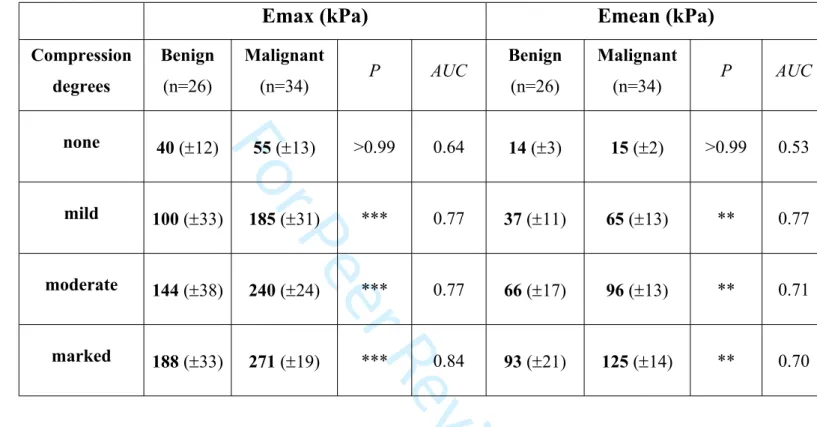
Table 1 shows mean 95% CI stiffness values (Emax and Emean) of the 26 benign and 34 malignant lesions for each degree of compression. Without compression, stiffness values of malignant masses were low. We observed no significant difference in stiffness between benign and malignant masses. On the contrary, malignant masses were significantly stiffer than benign masses for all other degrees of compression. Without compression, the accuracy of SSWE was low, whereas it was good when compression was applied. The quantitative thresholds associated with best likehood ratios were: 95, 186 and 286 kPa for Emax and 42, 3 4 5 6 7 8 9 10 11 12 13 14 15 16 17 18 19 20 21 22 23 24 25 26 27 28 29 30 31 32 33 34 35 36 37 38 39 40 41 42 43 44 45 46 47 48 49 50 51 52 53 54 55 56 57 58 59 60
For Peer Review
66 and 102 kPa for Emean for each degree of compression, respectively. It is important to note that with a marked degree of compression, we measured high stiffness values even in benign lesions: 188 (±33) kPa for Emax and 93 (±21) kPa for Emean.
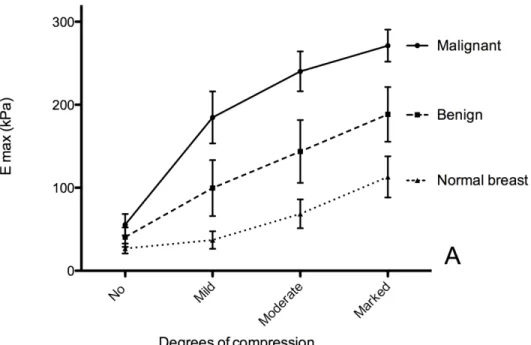
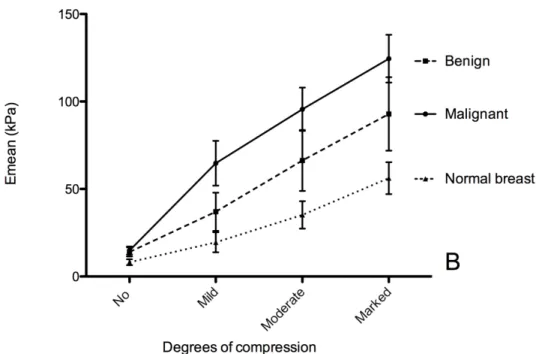
Figure 1, representing the stiffness curves according to degrees of compression, shows that stiffness of breast lesions increased with compression (P<0.0001 for Emax and Emean). Stiffness curves according to the degree of compression were different between benign and malignant lesions (P<0.0001).
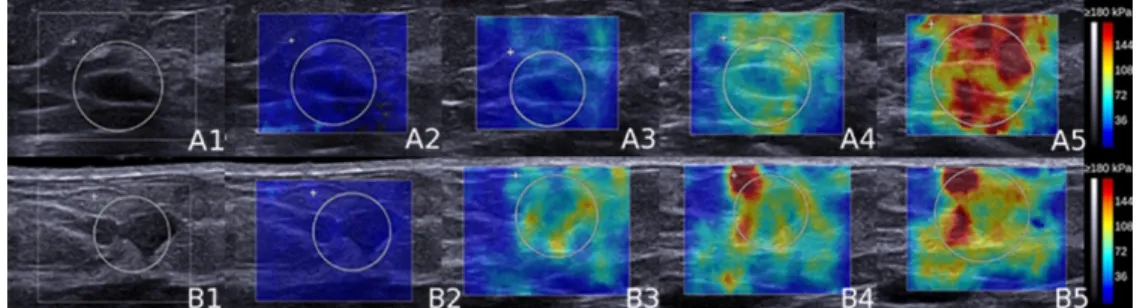
Figure 2 shows examples of SSWE color maps of one benign and one malignant mass for the different degrees of compression.
3) Inter-observer reproducibility
Inter-observer reproducibility was studied in a subgroup of 18 masses (9 benign and 9 malignant) in 18 patients. When compression was applied, agreement between the two
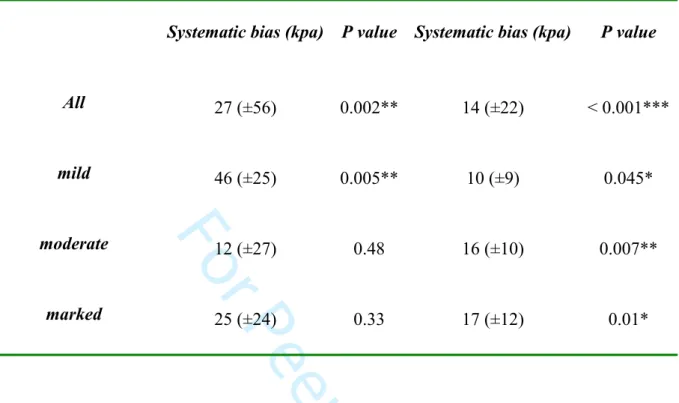
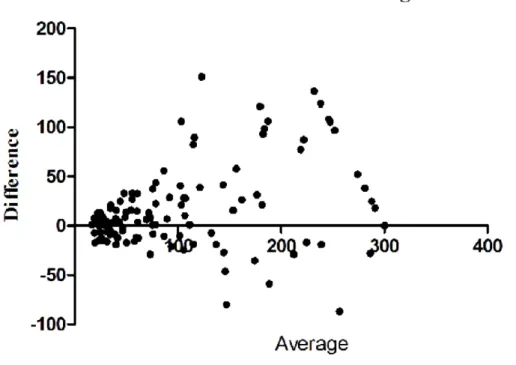
operators for the overall quantitative values was substantial for Emax (ICC= 0.75) and almost perfect for Emean (ICC= 0.85). Regarding each degree of compression separately, ICC was 0.61 and 0.79 for mild, 0.75 and 0.80 for moderate and 0.74 and 0.83 for marked compression for Emax and Emean respectively. The Bland and Altman plot (Figure 3) and Wilcoxon matched-paired signed rank test showed that, when compression was applied, there was a systematic bias between the two operators with one obtaining values consistently higher than the other (Table 2).
DISCUSSION
3 4 5 6 7 8 9 10 11 12 13 14 15 16 17 18 19 20 21 22 23 24 25 26 27 28 29 30 31 32 33 34 35 36 37 38 39 40 41 42 43 44 45 46 47 48 49 50 51 52 53 54 55 56For Peer Review
Our study is the first to show that at least mild compression should be applied when
performing SSWE of the breast in the clinical setting. We also showed that compression had an impact on the measured stiffness values obtained, depending on the degree of compression applied to the breast. However, when the amount of compression applied was defined
beforehand, as was the case in our study, we showed that inter-observer agreement remained high. We believe our results are crucial for the understanding of this relatively new technique and for its optimal use in routine clinical practice.
When no manual compression was applied, we measured low stiffness values even in cancers. Similar observations have been reported in other studies using shear wave techniques12,19.
Good quality shear waves might be difficult to generate in some situations, in particular in the case of very hard and attenuating tissues, such as invasive breast cancers20,21. We hypothesize
that this phenomenon would be emphasized in the absence of compression of the breast, which is supported by Shiina et al., who recommended in the ‘appropriate measurement conditions’ paragraph of their recent guidelines, to ‘apply a minimal compression (e.g. <0.3 mm in a typical 3cm thick breast) during imaging’22.
It has been previously described in the literature that tissues become stiffer when compressed
12,23–26. In our study, both malignant and benign lesions displayed higher stiffness values when
compression was more marked. As a result, the optimal threshold for the differentiation of breast lesions was variable according to the degree of compression. This suggests, that in the clinical setting, it may not be possible to define a single reference threshold, which may explain the important variability of the thresholds reported in literature6,10,27–29. We also
observed variability in stiffness measurements that depended on the operator, which is in line with a previous study showing that measurements taken by two different operators on the same lesion could yield significantly different results28.From these observations, a number of
conclusions may be drawn: 1) given the variability associated with compression, quantitative 3 4 5 6 7 8 9 10 11 12 13 14 15 16 17 18 19 20 21 22 23 24 25 26 27 28 29 30 31 32 33 34 35 36 37 38 39 40 41 42 43 44 45 46 47 48 49 50 51 52 53 54 55 56 57 58 59 60
For Peer Review
results should be interpreted very cautiously; 2) as compression in clinical practice is subjective, SSWE is not completely independent of the operator, which highlights the importance of training and quality control; and 3) it would be of great interest to develop an ‘absolute’ quantitative technique for stiffness measurement which would integrate manual compression and would therefore be suitable for clinical practice, as the one proposed by Bernal et al. in a recent feasibility study30.
Despite the inter-observer variability, the inter-observer agreement remained high in our study. This indicates that the operators obtained results in the same relative order of magnitude even though there was a significant difference in the absolute measurements. Unlike the study of Cosgrove et al, who showed high reproducibility for the retrospective reading of images acquired by a single operator5, our study showed high agreement on
measurements performed prospectively by two independent operators, which is consistent with the results obtained by Evans et al28.
There are limitations to this study. First, the method we defined for standardization of
compression may be improved and more optimal methods might be developed. Nevertheless, we have shown that his technique is accurate for differentiating benign from malignant breast lesions, has a high inter-observer agreement, and can readily be implemented in the clinic. Barr et al. assessed compression by calculating the percentage decrease of the distance between the skin and a fixed structure in the breast12. However, as stated by the strain
elastography theory, tissue deformation varies depending on tissue stiffness and does not necessarily correlate with the amount of pressure applied. Second, our population is relatively small with a high proportion of malignant masses, which does not reflect the ratio
encountered in clinical routine in most centers. However, we believe that our population, which is to our knowledge the largest among studies dealing with compression in SWE, is 3 4 5 6 7 8 9 10 11 12 13 14 15 16 17 18 19 20 21 22 23 24 25 26 27 28 29 30 31 32 33 34 35 36 37 38 39 40 41 42 43 44 45 46 47 48 49 50 51 52 53 54 55 56
For Peer Review
group of patient. Nevertheless, the number of patients in this sub-group is larger than in the only other study that addressed reproducibility of SWE prospectively28. Third, we did not
study the effect of compression in devices from other manufacturers, and can therefore not generalize our results to all SWE techniques.
In conclusion, we showed that avoiding manual compression is not appropriate in SSWE for breast lesion characterization. Application of compression yields high diagnostic performance but is associated with variability of the quantitative measurements of stiffness. This underlines the importance of interpreting any threshold value with caution. However, when manual compression is defined beforehand, high inter-observer agreement can be achieved to differentiate benign from malignant breast lesions.
3 4 5 6 7 8 9 10 11 12 13 14 15 16 17 18 19 20 21 22 23 24 25 26 27 28 29 30 31 32 33 34 35 36 37 38 39 40 41 42 43 44 45 46 47 48 49 50 51 52 53 54 55 56 57 58 59 60
For Peer Review
REFERENCES
1. Athanasiou A, Tardivon A, Tanter M, et al. Breast lesions: quantitative elastography with supersonic shear imaging--preliminary results. Radiology. 2010;256(1):297-303. 2. Chang JM, Moon WK, Cho N, et al. Clinical application of shear wave elastography (SWE) in the diagnosis of benign and malignant breast diseases. Breast Cancer Res Treat. 2011;129(1):89-97.
3. Tanter M, Bercoff J, Athanasiou A, et al. Quantitative assessment of breast lesion viscoelasticity: initial clinical results using supersonic shear imaging. Ultrasound Med Biol. 2008;34(9):1373-86.
4. Klotz T, Boussion V, Kwiatkowski F, et al. Shear wave elastography contribution in ultrasound diagnosis management of breast lesions. Diagn Interv Imaging.2014;95(9):813-24. 5. Cosgrove DO, Berg WA, Dore CJ, et al. Shear wave elastography for breast masses is highly reproducible. Eur Radiol. 2012;22(5):1023-32.
6. Berg WA, Cosgrove DO, Dore CJ, et al. Shear-wave elastography improves the specificity of breast US: the BE1 multinational study of 939 masses. Radiology.
2012;262(2):435-49.
7. Lee SH, Chang JM, Cho N, et al. Practice guideline for the performance of breast ultrasound elastography. Ultrason Seoul Korea. 2014;33(1):3-10.
8. Barr RG, Nakashima K, Amy D, et al. WFUMB Guidelines and Recommendations for Clinical Use of Ultrasound Elastography: Part 2: Breast. Ultrasound Med Biol.
2015;41(5):1148-60.
9. Evans A, Whelehan P, Thomson K, et al. Invasive breast cancer: relationship between shear-wave elastographic findings and histologic prognostic factors. Radiology.
2012;263(3):673-7.
10. Evans A, Whelehan P, Thomson K, et al. Differentiating benign from malignant solid breast masses: value of shear wave elastography according to lesion stiffness combined with greyscale ultrasound according to BI-RADS classification. Br J Cancer. 2012;107(2):224-9. 11. Gweon HM, Youk JH, Son EJ, et al. Clinical application of qualitative assessment for breast masses in shear-wave elastography. Eur J Radiol. 2013;82(11):e680-5.
12. Barr RG, Zhang Z. Effects of precompression on elasticity imaging of the breast: development of a clinically useful semiquantitative method of precompression assessment. J Ultrasound Med. 2012;31(6):895-902.
13. Ko KH, Jung HK, Kim SJ, et al. Potential role of shear-wave ultrasound elastography for the differential diagnosis of breast non-mass lesions: preliminary report. Eur Radiol. 2014;24(2):305-11.
14. Evans A, Rauchhaus P, Whelehan P, et al. Does shear wave ultrasound independently predict axillary lymph node metastasis in women with invasive breast cancer? Breast Cancer Res Treat. 2014;143(1):153-157.
15. Yoon JH, Ko KH, Jung HK, Lee JT. Qualitative pattern classification of shear wave elastography for breast masses: how it correlates to quantitative measurements. Eur J Radiol. 2013;82(12):2199-2204.
16. D’Orsi CJ, Sickles EA, Mendelson EB, Morris EA, et Al. ACR BI-RADS® Atlas, Breast Imaging Reporting and Data System. Reston, VA, American College of Radiology. 2013. 3 4 5 6 7 8 9 10 11 12 13 14 15 16 17 18 19 20 21 22 23 24 25 26 27 28 29 30 31 32 33 34 35 36 37 38 39 40 41 42 43 44 45 46 47 48 49 50 51 52 53 54 55 56
For Peer Review
18. Landis JR, Koch GG. The measurement of observer agreement for categorical data. Biometrics. 1977;33(1):159-174.
19. Bai M, Du L, Gu J, Li F, Jia X. Virtual touch tissue quantification using acoustic radiation force impulse technology: initial clinical experience with solid breast masses. J Ultrasound Med. 2012;31(2):289-94.
20. Barr RG. Shear wave imaging of the breast: still on the learning curve. J Ultrasound Med. 2012;31(3):347-50.
21. Barr RG, Zhang Z. Shear-wave elastography of the breast: value of a quality measure and comparison with strain elastography. Radiology. 2015;275(1):45-53.
22. Shiina T, Nightingale KR, Palmeri ML, et al. WFUMB guidelines and
recommendations for clinical use of ultrasound elastography: Part 1: basic principles and terminology. Ultrasound Med Biol. 2015;41(5):1126-47.
23. Varghese T, Ophir J, Krouskop TA. Nonlinear stress-strain relationships in tissue and their effect on the contrast-to-noise ratio in elastograms. Ultrasound Med Biol.
2000;26(5):839-51.
24. Krouskop TA, Wheeler TM, Kallel F, et al. Elastic moduli of breast and prostate tissues under compression. Ultrason Imaging. 1998;20(4):260-74.
25. Syversveen T, Midtvedt K, Berstad AE, et al. Tissue elasticity estimated by acoustic radiation force impulse quantification depends on the applied transducer force: an
experimental study in kidney transplant patients. Eur Radiol. 2012;22(10):2130-7.
26. Wojcinski S, Brandhorst K, Sadigh G, et al. Acoustic radiation force impulse imaging with virtual touch tissue quantification: measurements of normal breast tissue and dependence on the degree of pre-compression. Ultrasound Med Biol. 2013;39(12):2226-32.
27. Chen L, He J, Liu G, et al. Diagnostic performances of shear-wave elastography for identification of malignant breast lesions: a meta-analysis. Jpn J Radiol. 2014;32(10):592-9. 28. Evans A, Whelehan P, Thomson K, et al. Quantitative shear wave ultrasound
elastography: initial experience in solid breast masses. Breast Cancer Res. 2010;12(6):R104. 29. Yoon JH, Jung HK, Lee JT, et al. Shear-wave elastography in the diagnosis of solid breast masses: what leads to false-negative or false-positive results? Eur Radiol.
2013;23(9):2432-40.
30. Bernal M, Chamming’s F, Couade M, et al. In Vivo Quantification of the Nonlinear Shear Modulus in Breast Lesions: Feasibility Study. IEEE Trans Ultrason Ferroelectr Freq Control. 2016;63(1):101-9. 3 4 5 6 7 8 9 10 11 12 13 14 15 16 17 18 19 20 21 22 23 24 25 26 27 28 29 30 31 32 33 34 35 36 37 38 39 40 41 42 43 44 45 46 47 48 49 50 51 52 53 54 55 56 57 58 59 60
For Peer Review
FIGURES CAPTIONS
Figure 1: Mean 95% Confidence Interval of maximum (Emax) (A) mean (Emean) (B) stiffness according to the degree of compression in benign and malignant lesions and in normal breast. Stiffness increased with compression for benign and malignant lesions as for normal breast tissue (p<0.0001). Without compression, no difference was observed between benign and malignant lesions (P>0.99) whereas a significant difference was observed for all other degrees of compression (P<0.001 for Emax and P<0.01 for Emean).
Figure 2: Supersonic Shear Wave Elastography (SSWE) color maps of a benign (A) and a 3 4 5 6 7 8 9 10 11 12 13 14 15 16 17 18 19 20 21 22 23 24 25 26 27 28 29 30 31 32 33 34 35 36 37 38 39 40 41 42 43 44 45 46 47 48 49 50 51 52 53 54 55 56
For Peer Review
(37 kPa and 13 for maximum (Emax) and mean (Emean) stiffness respectively) and malignant lesions (21 and 10 kPa for Emax and Emean respectively) demonstrated low elasticity values. For mild (3) and moderate (4) compression, higher stiffness values were observed in the malignant (B3: 118 and 75 kPa; B4: 207 and 100 kPa) than in the benign mass (A3: 46 and 33 kPa; A4: 116 and 77 kPa). For marked compression, stiffness increased in the malignant lesion (B5: 300 and 123 kPa) but high stiffness values were also obtained in the benign mass (A5: 245 and 146 kPa).
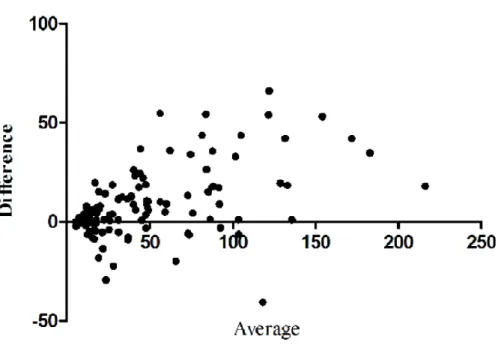
Figure 3: Bland and Altman plots representing the difference between the two operators’ measurements according to their average value for maximum (Emax) (A) and mean (Emean) (B) stiffness when compression was applied. As the majority of points are located above 0, it shows that one operator obtained higher stiffness values than the other. The systematic bias between the two operators (represented as the dotted grey line) was: 27 (±56) kPa (p=0.002) for Emax and 14 (±22) kPa (P<0.001) for Emean.
3 4 5 6 7 8 9 10 11 12 13 14 15 16 17 18 19 20 21 22 23 24 25 26 27 28 29 30 31 32 33 34 35 36 37 38 39 40 41 42 43 44 45 46 47 48 49 50 51 52 53 54 55 56 57 58 59 60
For Peer Review
TABLES
Table 1: Mean 95% Confidence Interval of maximum (Emax) and mean (Emean) elasticity values and according to degree of compression for benign and malignant lesions. The
difference between benign and malignant lesions was extremely significant (P<0.001***) for Emax and very significant (P<0.01**) for Emean at mild, moderate and marked compression but not for none. At no compression, accuracy of shear wave elastography was poor as shown by low Area Under the Curves for both Emax and Emean.
Emax (kPa)
Emean (kPa)
Compression degrees Benign (n=26) Malignant (n=34) P AUC Benign (n=26) Malignant (n=34) P AUC none 40 (12) 55 (13) >0.99 0.64 14 (3) 15 (2) >0.99 0.53 mild 100 (33) 185 (31) *** 0.77 37 (11) 65 (13) ** 0.77 moderate 144 (38) 240 (24) *** 0.77 66 (17) 96 (13) ** 0.71 marked 188 (33) 271 (19) *** 0.84 93 (21) 125 (14) ** 0.70 3 4 5 6 7 8 9 10 11 12 13 14 15 16 17 18 19 20 21 22 23 24 25 26 27 28 29 30 31 32 33 34 35 36 37 38 39 40 41 42 43 44 45 46 47 48 49 50 51 52 53 54 55 56
For Peer Review
Table 2: Systematic bias according to degree of compression. When compression was applied, we observed a systematic bias between the two operators, with one measuring values
consistently higher than the other. Considering each degree of compression, this difference was not significant for Emax for moderate and marked degrees of compression.
Compression degrees
Emax
Emean
Systematic bias (kpa) P value Systematic bias (kpa) P value
All 27 (±56) 0.002** 14 (±22) < 0.001*** mild 46 (±25) 0.005** 10 (±9) 0.045* moderate 12 (±27) 0.48 16 (±10) 0.007** marked 25 (±24) 0.33 17 (±12) 0.01* 3 4 5 6 7 8 9 10 11 12 13 14 15 16 17 18 19 20 21 22 23 24 25 26 27 28 29 30 31 32 33 34 35 36 37 38 39 40 41 42 43 44 45 46 47 48 49 50 51 52 53 54 55 56 57 58 59 60
For Peer Review
Figure 1: Mean ± 95% Confidence Interval of maximum (Emax) (A) mean (Emean) (B) stiffness according to the degree of compression in benign and malignant lesions and in normal breast. Stiffness increased with compression for benign and malignant lesions as for normal breast tissue (p<0.0001). Without compression, no difference was observed between benign and malignant lesions (P>0.99) whereas a significant difference
was observed for all other degrees of compression (P<0.001 for Emax and P<0.01 for Emean). 162x108mm (300 x 300 DPI) 3 4 5 6 7 8 9 10 11 12 13 14 15 16 17 18 19 20 21 22 23 24 25 26 27 28 29 30 31 32 33 34 35 36 37 38 39 40 41 42 43 44 45 46 47 48 49 50 51 52
For Peer Review
Figure 1: Mean ± 95% Confidence Interval of maximum (Emax) (A) mean (Emean) (B) stiffness according to the degree of compression in benign and malignant lesions and in normal breast. Stiffness increased with compression for benign and malignant lesions as for normal breast tissue (p<0.0001). Without compression, no difference was observed between benign and malignant lesions (P>0.99) whereas a significant difference
was observed for all other degrees of compression (P<0.001 for Emax and P<0.01 for Emean). 165x110mm (300 x 300 DPI) 3 4 5 6 7 8 9 10 11 12 13 14 15 16 17 18 19 20 21 22 23 24 25 26 27 28 29 30 31 32 33 34 35 36 37 38 39 40 41 42 43 44 45 46 47 48 49 50 51 52 53 54 55 56 57
For Peer Review
Figure 2: Supersonic Shear Wave Elastography (SSWE) color maps of a benign (A) and a malignant (B) mass on B-mode (1), and for the different compression levels, respectively none (2), mild (3), moderate (4)
and marked (5). At no compression (A2 and B2) both benign (37 kPa and 13 for maximum (Emax) and mean (Emean) stiffness respectively) and malignant lesions (21 and 10 kPa for Emax and Emean respectively) demonstrated low elasticity values. For mild (3) and moderate (4) compression, higher stiffness values were observed in the malignant (B3: 118 and 75 kPa; B4: 207 and 100 kPa) than in the benign mass (A3: 46 and 33 kPa; A4: 116 and 77 kPa). For marked compression, stiffness increased in the
malignant lesion (B5: 300 and 123 kPa) but high stiffness values were also obtained in the benign mass (A5: 245 and 146 kPa).
127x35mm (300 x 300 DPI) 3 4 5 6 7 8 9 10 11 12 13 14 15 16 17 18 19 20 21 22 23 24 25 26 27 28 29 30 31 32 33 34 35 36 37 38 39 40 41 42 43 44 45 46 47 48 49 50 51 52
For Peer Review
Figure 3: Bland and Altman plots representing the difference between the two operators’ measurements according to their average value for maximum (Emax) (A) and mean (Emean) (B) stiffness when compression was applied. As the majority of points are located above 0, it shows that one operator obtained
higher stiffness values than the other. The systematic bias between the two operators (represented as the dotted grey line) was: 27 (±56) kPa (p=0.002) for Emax and 14 (±22) kPa (P<0.001) for Emean.
101x74mm (300 x 300 DPI) 3 4 5 6 7 8 9 10 11 12 13 14 15 16 17 18 19 20 21 22 23 24 25 26 27 28 29 30 31 32 33 34 35 36 37 38 39 40 41 42 43 44 45 46 47 48 49 50 51 52 53 54 55 56 57
For Peer Review
Figure 3: Bland and Altman plots representing the difference between the two operators’ measurements according to their average value for maximum (Emax) (A) and mean (Emean) (B) stiffness when compression was applied. As the majority of points are located above 0, it shows that one operator obtained
higher stiffness values than the other. The systematic bias between the two operators (represented as the dotted grey line) was: 27 (±56) kPa (p=0.002) for Emax and 14 (±22) kPa (P<0.001) for Emean.
101x72mm (300 x 300 DPI) 3 4 5 6 7 8 9 10 11 12 13 14 15 16 17 18 19 20 21 22 23 24 25 26 27 28 29 30 31 32 33 34 35 36 37 38 39 40 41 42 43 44 45 46 47 48 49 50 51 52