Comparative Usability Study of Two Space Logistics Analysis Tools
The MIT Faculty has made this article openly available. Please share
how this access benefits you. Your story matters.
Citation
Grogan, Paul, Olivier De Weck, and Chaiwoo Lee. “Comparative
Usability Study of Two Space Logistics Analysis Tools.” In AIAA
SPACE 2011 Conference & Exposition. American Institute of
Aeronautics and Astronautics, 2011.
As Published
http://dx.doi.org/10.2514/6.2011-7345
Publisher
American Institute of Aeronautics and Astronautics
Version
Author's final manuscript
Citable link
http://hdl.handle.net/1721.1/81878
Terms of Use
Creative Commons Attribution-Noncommercial-Share Alike 3.0
Comparative Usability Study of Two Space Logistics
Analysis Tools
Paul T. Grogan*, Chaiwoo Lee†, and Olivier L. de Weck‡ Massachusetts Institute of Technology, Cambridge, MA 02139
Future space exploration missions and campaigns will require sophisticated tools to help plan and analyze logistics. To encourage their use, space logistics tools must be usable: a design concept encompassing terms such as efficiency, effectiveness, and satisfaction. This paper presents a usability study of two such tools: SpaceNet, a discrete event simulation tool and a comparable spreadsheet-based tool. The study follows a randomized orthogonal design having within-subjects evaluation of the two tools with 12 volunteer subjects (eight subjects with space backgrounds, four without). Each subject completed two sessions of testing, each with a 30-45 minute tutorial and a two-part space exploration scenario. The first part tests the creation a model to verify a simple uncrewed mission to lunar orbit. The second part tests the evaluation of an existing model to improve the effectiveness of a crewed mission to the lunar surface. The subjects completed a questionnaire after each session and a semi-structured interview following the second session. The study results indicate that the SpaceNet tool is more efficient for portions of the model creation task including modeling multi-burn transports and the spreadsheet tool is more effective for the model evaluation task. Qualitative evaluation indicates subjects liked the graphical nature and error-detection of the SpaceNet tool, but felt it took too long to edit information and appeared as a “black box.” Subjects liked the ability to view the entire model state within the spreadsheet tool, however were concerned with limited dynamic state feedback and underlying modeling assumptions. Future tools should combine the best features, including allowing modification of the entire model from a single interface, providing visibility of underlying logic, and integrated graphical and error-checking feedback.
*
Doctoral Student, Engineering Systems Division, Room E40-206, AIAA Student Member.
†
Doctoral Student, Engineering Systems Division, Room E40-287.
‡
Associate Professor, Engineering Systems Division and Department of Aeronautics and Astronautics, Room E40-229, AIAA Associate Fellow.
I. Introduction
PACE logistics analysis requires the integrated modeling of many components including launch vehicles, in-space vehicles, surface systems, and human and robotic explorers. As in-space exploration concepts transition from independent sorties (such as the Apollo missions) to coupled, integrated campaigns of missions at more distant locations, the associated increase in complexity and criticality will demand more sophisticated and automated tools for logistics analysis. The intricate details of exploration logistics could quickly overwhelm analysis, thus one seeks appropriate abstractions and simplifications to support analysis. As such, conceptual mission and campaign design often simplify logistics to a “point mass” of resources to be carried along to support the baseline exploration; however this type of simple analysis may easily under-estimate or poorly estimate actual logistics requirements.
For example, Mars Design Reference Architecture (DRA) 5.0 is a mission concept for human exploration on Mars.1 It allocates a total of 12,250 kg of crew provisions to support a crew of six over 30 months (6,250 kg in the transit habitat, 1,500 kilograms in the habitat lander, and 4,500 kg in the descent-ascent lander). This works out to roughly 2.25 kg/person/day, which is significantly less than established rates including packaged food (2.064 kg/person/day), water (3.4 kg/person/day) and metabolic oxygen (0.88 kg/person/day).2 Even with the expected addition of advanced, closed-loop life support systems, it is unlikely that the demands for crew provisions could be reduced to such a low level. Additionally, DRA 5.0 accounts for spares and repair parts within the baseline mass of
2
elements by adding an extra 20%; however this estimate doesn’t enable analysis of element use across more than one mission or analysis of the benefit of element commonality as the spares and repair mass are fixed.
Integrated analysis methods incorporating lifecycle simulation help to illustrate the importance of logistics; however, analysis tools must also be usable to promote widespread application in conceptual mission design. Analysis tools are often not intended to be used outside a single person or team. Although helpful for the creators of the tool, their greater use is limited by a lack of transparency, usability flaws, or limited distribution. The goal of this study is to investigate what makes space logistics analysis tools usable for performing analysis by comparing the effectiveness and efficiency of multiple tools in an experimental setting.
A. Usability Analysis Overview
While the overall outcome and performance delivered from the underlying mechanisms of space logistics tools are important, it is essential to consider how the elements, architecture, and process of the system are communicated to users. In other words, the contact point, or the interface, between users and the system should be carefully designed and evaluated so that users can easily interact with the system by making appropriate inputs and understanding outputs presented. Thus, in designing an interactive system, the concept of usability is emphasized to be a core quality factor.3,4
1. What is Usability?
Usability can be defined differently for specific products or systems. Consequently, previous studies and existing standards have defined usability in various ways, each capturing different aspects of system design or addressing different purposes. For example, while Ref. 5 emphasizes minimization of effort and cognitive load, Ref. 6 and 7 focused also on goal-oriented aspects such as the degree in which a system is effective and useful.
Similarly, the factors and attributes identified for describing usability vary to some degree. For example, in addressing the degree to which a system is effortless to use many attributes, including learnability, adaptiveness, time to learn, rememberability, rate of errors, cognitive workload, and effort for error correction, have been identified.8-10 Also, a number of attributes including effectiveness, performance, productivity, functional support and throughput have been used to describe a system’s ability to assist users in reaching their goals and desired outcomes quickly.4,9,11,12 In describing the degree to which a system is subjectively perceived to be positive, attributes including satisfaction, engaging, attitude, and attractiveness have also been defined.13-16
Though widely varying, many studies include three common usability factors for design and evaluation: effectiveness, efficiency, and satisfaction. Although detailed descriptions of these three factors can be altered for specific products and systems with different goals, users, use contexts, and interface designs, they fall in line with the general definitions given by Ref. 7, as summarized in Table 1.
Table 1. Definition of common factors of usability Factor Definition
Effectiveness The accuracy and completeness with which users achieve goals.
Efficiency The resources expended in relation to the accuracy and completeness with which users achieve goals. Satisfaction The freedom from discomfort, and positive attitudes of the user of the system.
2. Studies in Related Domains
In designing an interactive system, usability plays an important role in the design process. Usability evaluation is a fundamental method to ensure an interactive system is adapted to the users and their tasks and is performed during the design process with the aim to assess the degree to which a system is effective, efficient, and satisfying.17,7
Usability evaluation can be categorized into two types: usability inspection and testing. The main differences are the evaluation timing in the design process and the roles of the designers. During the early stages of design when the design is not fully complete, expert-based evaluation identifies usability problems.18,19 This approach, where the primary evaluators are designers and developers, is called usability inspection. As usability inspection does not involve users in the evaluation process, it is usually less costly and often used when it is difficult or expensive to recruit users.20 On the other hand, usability testing, or user-based evaluation, brings in users as the primary evaluators to perform real tasks with a given system. Their actions, comments, and responses are carefully recorded and documented for analysis.17,21 Because it receives direct inputs from users, usability testing is considered to be a more effective evaluation method.
While the main goal of a usability test is to learn about users’ experience and improve the usability of a product, the first step in planning and designing a usability test involves setting a more specific goal.14,21 After setting test goals, the next steps include selecting participants, creating scenarios, defining metrics and measures, and designing data collection methods to achieve the test goals. Usability testing often employs methods including performance evaluations, user observations, think-aloud protocols, questionnaires and interviews to collect data.22,23
Data from usability testing can be analyzed using various metrics. Ref. 3 reviewed usability studies from 1999 to 2002 to understand the practice in measuring usability, finding some of the most common measures to be task completion, accuracy and completeness for effectiveness, time, input rate and mental effort for efficiency, and preference, ease-of use, and perception of interaction and outcomes for satisfaction. While such measures were common across domains and methods, subtle variations tailor the measures for each application.
Usability testing can be employed for both physical products and software systems used in various domains and industries. For example, Ref. 24 studied principles, criteria, and methods for testing the usability of web applications, emphasizing the importance of human judgment and assessment in carrying out the tests. Similarly, Ref. 25 reviewed principles and methods for usability testing but modified and extended them to propose a new assessment methodology for web-based information systems, validating it with a case study on evaluating a student information system. Ref. 26 also performed an empirical study on testing the usability of an information system, but within the healthcare domain for mobile clinical work.
B. Pilot Study: Near-Earth Object Mission
Prior to conducting a full-scale usability testing, a pilot study was developed and executed in July 2010 to evaluate initial usability of SpaceNet.27 The goal of the pilot study was to measure the time required to model, evaluate, and resolve feasibility for a space exploration scenario using SpaceNet compared to a customized spreadsheet tool such as what may be developed for a one-off analysis.
Seven volunteers aged 20-25 with backgrounds in aerospace participated in the pilot study. Five were assigned to use SpaceNet while two used a spreadsheet to build a customized model. No randomization was used for assignment and variation across the treatment and control groups is likely biased, thus the results from the pilot study are merely suggestive rather than conclusive.
After an initial tutorial, subjects were challenged to create a model to analyze the feasibility of a 14-day exploration at near-Earth object. The exploration scenario included two crew members and modified Constellation-style spacecraft specified in a database format accessible for both tools. The baseline scenario had neither sufficient cargo capacity nor sufficient propellant to complete the mission. Therefore, after the initial modeling task subjects determined what changes (within constraints) were necessary to establish propulsive and logistical feasibility.
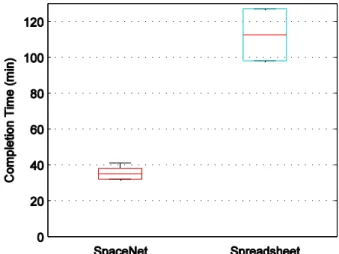
SpaceNet subjects found a feasible campaign in times of 37, 35, 41, 32, and 32 minutes, corresponding to a median task time of 35 minutes. This compares to task times of 127 and 98 minutes required for the spreadsheet subjects, as shown the box plot in Figure 1. Informal feedback after the experiment was generally positive – many subjects were enthusiastic that little prior knowledge of space exploration systems was required to perform a basic analysis.
Although the tutorial provided a template to the spreadsheet users, no structured spreadsheet was set up for the scenario. This raises the question as to the equivalence of the tools as SpaceNet provides a model framework, whereas the spreadsheet tool requires the user to build the model. Although this difference is not necessarily unfair, the detailed study will implement a highly-structured spreadsheet framework.
The results of the pilot study indicate that SpaceNet may provide an advantage for performing space exploration logistics analysis compared to spreadsheet methods, though the sample size, selection biases, and comparability of tools limit the generalization of the results. Another factor not considered during the pilot study was the effect of errors, which may be more prevalent in a spreadsheet format that does not perform validation or provide visualizations. These items are influential topics to drive the detailed usability study.
Figure 1. Pilot study results. SpaceNet subjects completed the
task in a median of 35 minutes compared to 127 and 98 minutes for the spreadsheet subjects.
4 C. Space Logistics Usability Study Objectives
This study aims to comparatively evaluate the usability of two space logistics analysis tools: SpaceNet, a discrete event simulation application, and a comparable spreadsheet tool. For a comprehensive evaluation, this study seeks to answer two main research questions:
1. What is the comparative effectiveness and efficiency of using SpaceNet versus a spreadsheet? 2. How does the user experience and usage patterns compare between the two tools?
To answer the first question, this study conducts a quantitative, performance-based comparative evaluation of the two tools in terms of effectiveness and efficiency. SpaceNet is designed with an interface that is easy to use and understand while letting its users perform their tasks and achieve their goals as effectively as they would using other tools. While SpaceNet is developed with features designed according to usability principles, it needs to be evaluated by potential users to validate its effectiveness and efficiency for space logistics analysis.
The second research question seeks to evaluate user perceptions, contexts of use, and usage and error patterns. For this part, instead of focusing on performance measures, the study looks at qualitative patterns, collects data based on attitudes and perceptions of users, and analyzes process of user interactions.
Since SpaceNet is a fully-developed program, usability testing is a more appropriate method of evaluation than inspection. All features of SpaceNet are fully functional, and the tool has gone through many design iterations. Thus, rather than having experts and designers evaluate, it is more effective to have people from the actual user groups to experience, test and comment on the tool.
II. Space Logistics Analysis Tools
The two analysis tools have similar capabilities but significantly different underlying engines and user interfaces. The SpaceNet tool is a discrete event simulator with a custom-coded Java Swing user interface, while the spreadsheet tool builds on Microsoft Excel’s capabilities for spreadsheet formula evaluation.
A. SpaceNet Simulation Tool
SpaceNet is a discrete event simulation tool for analyzing space exploration logistics. It is one of several research areas within the MIT Space Logistics Project, which researches innovations in space exploration logistics.* SpaceNet version 2.5 transitioned from single-mission lunar explorations to general-purpose, multi-mission campaigns. SpaceNet 2.5 was first released in October 2009 as an open source Java executable, followed by additional releases in December 2010 and May 2011.†
The immediate target users for SpaceNet are persons with a basic knowledge of space exploration systems, such as university-level students, researchers, and analysts. In the longer term, SpaceNet is intended to become a mainstream analysis environment for government and commercial mission architects and logisticians. The target analysis for SpaceNet is early conceptual missions working at a low-fidelity (high abstraction) level of analysis. To date, it has been used in the conceptual modeling of several application cases, as well as in modeling a “flexible path” human mission to Mars.27,28
1. Modeling and Analysis
SpaceNet uses a generalized modeling framework to define space exploration missions. The core components of the model include the network, resources, elements, and events. The network model captures spatial connectivity using nodes and edges. Nodes are time-invariant locations where resources can be accessed and edges provide transportation between nodes. The resource model captures the substances supplied and demanded during simulation. The element model identifies attributes of objects participating in the exploration (e.g. launch vehicles, in-space vehicles, habitats, and explorers) which may generate demands for resources in the simulation. Finally, the event model captures the actions to guide simulation execution. There are seven core events – instantiating elements, moving elements, removing elements, adding resources, transferring resources, demanding resources – and several composite events (e.g. space transport and exploration) comprised of lower-level events.
To analyze a space exploration mission in SpaceNet, a user can access network, resource, and element models in an integrated database or specify new models for a particular analysis. Next, each mission event comprising the exploration is defined in sequence, and simulated to check resource constraints, produce visualizations, and evaluate the exploration with respect to various measures of effectiveness.
*
For more information on the MIT Space Logistics Project, see http://spacelogistics.mit.edu
†
2. Key Usability Features
An integrated editor, shown in Figure 2, provides an interface for modifying the baseline element definitions drawn from a database.29 Continuous pre-simulation determines the system state before each event is created and estimates demands for resources. By the time the user reaches the final campaign simulation, most of the temporal and spatial errors should already be resolved, leading to a shorter scenario creation time. For example, Figure 3 shows a dialog for an in-space transport where pre-simulation identifies the elements present in Low-Earth Orbit (LEO) at the time of the event. Finally, visualizations provide insight to system behavior while identifying mistakes that do not generate an error. Several visualizations implemented within SpaceNet 2.5 include a dynamic logistics network (Figure 4), a network flow representation of supply and demand (Figure 5), and resource storage and consumption timelines (Figure 6).
Figure 2. SpaceNet element editor. The element editor
enforces validation rules and replaces relational keys (identifiers) with text-based labels.
Figure 3. Pre-simulation for events. New events trigger
pre-simulation to determine the pre-simulation state and any identify error conditions.
Figure 4. Logistics network visualization. This example shows the movement of elements and resources through the logistics
6
Figure 5. Network flow demands. This example shows a
mission within a time-expanded network with edges and nodes weighted by demands mass (blue, red).
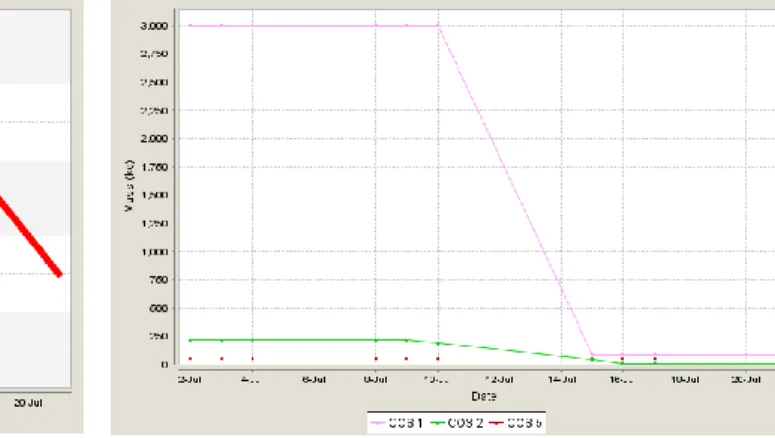
Figure 6. Element resource history. This example shows the
consumption of crew provisions (COS 2, green) and propellant (COS 1, pink) within a mission element over time.
B. Spreadsheet Evaluation Tool
In the absence of a formal tool, space logistics analysis may be performed using a spreadsheet. In such a tool, ranges of cells contain formulas to update the state of elements as they are affected by various events comprising a scenario. The spreadsheet replicates physics-based formulas, such as the rocket equation to model propellant usage during transports, and any other models used to govern the generation of demands for resources. For example, given data in the following cells: A1: initial stack mass (kg), A2: target delta-v (m/s), A3: specific impulse (s), A4: available fuel (kg), the resulting cell-based equation for the delta-v achieved would be A5: =MIN(A2,A3*9.81*LN(A1/(A1-A4)), which uses the ideal rocket equation bounded by the target delta-v (i.e. cannot achieve more delta-v than required).
The spreadsheet tool used in this study has been modeled after the capabilities of SpaceNet using similar terminology and structure. It uses similar data as SpaceNet for inputs, such as network, resource, and element definitions; however the formatting is more variable as the spreadsheet tool is custom-built for each application. Inherent to the nature of one-off spreadsheet models, this particular tool has not been applied outside this study. 1. Modeling and Analysis
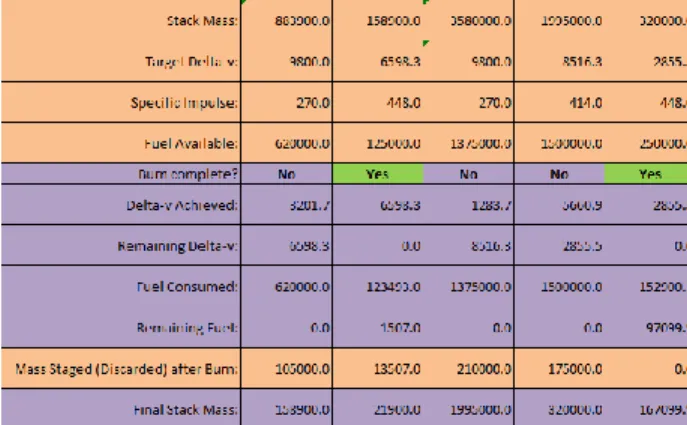
The spreadsheet tool uses five separate tables – edges, elements and resources, burn calculator, demands, and evaluation – on a single worksheet to build and analyze a space exploration mission model. The edges table captures the network connectivity including the duration and timing of each propulsive burn required to complete transport segments. The elements and resource table, shown in Figure 7, defines the attributes and initial state of all elements and contained resource participating in the exploration. The burn calculator table, shown in Figure 8, walks the user through the sequence of burns and transports required to complete the mission. The demands table, shown in Figure 9, calculates the demands for resources between each successive burn and identifies from which container the demands are satisfied. Finally, the evaluation table quantifies measures of effectiveness.
Figure 7. Elements and resources table. Color-coded cells indicate fixed (purple) and variable (orange) attributes of elements,
Although a general format, there are several required changes to configure the spreadsheet tool for each application. The changes required include: specifying burns in the edges table, identifying the elements and initial cargo (including nested cargo constraints) in the elements table, and adding available resource containers to the demands table. To complete the analysis, the user specifies the transports’ burn sequence, identifies from which resource container demands are consumed, and sets triggers to evaluate measures of effectiveness.
Figure 8. Burn calculator table. Burns are organized in
columns. Color-coded cells indicate inputs (orange) and outputs (purple). Green burns are complete, red, incomplete.
Figure 9. Demands table. Demands are organized in
columns. Color-coded cells indicate inputs (orange) and outputs (purple). Green demands are satisfied, red, unsatisfied.
2. Key Usability Features
Several features of the spreadsheet tool contribute to its usability. First, underlying cell formulas are visible for inspection by the user, providing a complete view of the model state throughout the analysis. Second, cells are generally color-coded to indicate inputs and variable attributes (orange) versus outputs and fixed attributes (purple). Finally, status messages check for initial capacity constraint violations (Figure 7), insufficient fuel to complete burns (Figure 8), and demand satisfaction after each burn (Figure 9).
III. Usability Study: Lunar Exploration
This study completed multiple sessions of usability testing for a comparative evaluation of the SpaceNet and spreadsheet tools. Space logistics scenarios are given as user tasks and data were collected using multiple methods while the participants perform the given tasks as well as after they are finished. Both performance-and perception-based data are measured and analyzed with usability metrics defined specifically for this study.
A. Study Design
Participants from potential user groups were recruited and taught the basics of space logistics analysis and use of the tools. According to a randomized orthogonal experiment design, participants performed scenarios representative of space missions that would potentially be modeled and analyzed in practice.
1. Study Participants
A total of twelve subjects participated in the study and all twelve completed both sessions in their entirety. The participants were purposively selected to represent two user groups: a primary group having a background in space exploration, and a secondary group having a background in technical, though not space-related, fields. Participants were given no financial compensation for taking part in the study. All subjects volunteered to participate by responding to recruitment e-mails and agreed to the study conditions by signing a consent form approved by MIT Committee on the Use of Humans as Experimental Subjects.
Eight graduate students from MIT Department of Aeronautics and Astronautics with academic or professional background in space exploration were selected for the primary user group. The subjects’ ages ranged from 22-30 and included one female and seven males. When participants are selected from the same user group, five is usually considered a large enough number for usability testing.14 As all eight participants were selected with characteristics representative of the actual user group, it can be concluded that the threat to validity was mitigated.
8
Four MIT graduate students with technical academic and professional backgrounds (e.g. distribution logistics, numerical methods) were selected for the secondary user group. The subjects’ ages ranged from 24-32 and included two females and two males. This secondary group was selected for comparative testing and analysis.
2. Study Design
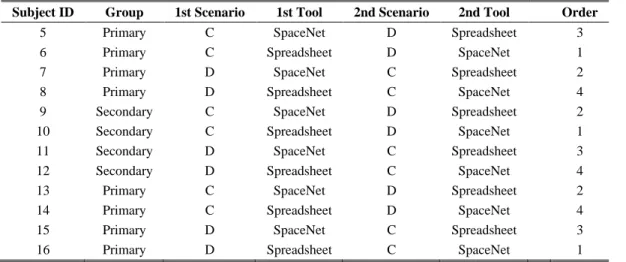
The study was designed so that each participant completed scenarios using both SpaceNet and spreadsheet tools. To minimize effects due to learning and fatigue, the two sessions were non-consecutive. To prevent any ordering effects and to account for possible interactions between scenarios and tools, the study was designed orthogonally – participants completed different scenario-tool combinations in the two sessions, resulting in four different combinations. To minimize variation and uncertainty in the measurements, the study design was replicated for the primary target group so each of the eight participants were assigned to one of the four combinations, resulting in two individuals with combination. The subject conditions were assigned randomly within each replication using a random number generator. The study design is summarized in Table 2.
Table 2. Summary of study design
Subject ID Group 1st Scenario 1st Tool 2nd Scenario 2nd Tool Order 5 Primary C SpaceNet D Spreadsheet 3 6 Primary C Spreadsheet D SpaceNet 1 7 Primary D SpaceNet C Spreadsheet 2 8 Primary D Spreadsheet C SpaceNet 4 9 Secondary C SpaceNet D Spreadsheet 2 10 Secondary C Spreadsheet D SpaceNet 1 11 Secondary D SpaceNet C Spreadsheet 3 12 Secondary D Spreadsheet C SpaceNet 4 13 Primary C SpaceNet D Spreadsheet 2 14 Primary C Spreadsheet D SpaceNet 4 15 Primary D SpaceNet C Spreadsheet 3 16 Primary D Spreadsheet C SpaceNet 1
3. Testing Environment
Testing was performed in a classroom on MIT campus. A laptop computer with a Windows 7 operating system and a screen resolution of 1024 by 768 pixels and a USB mouse was used to run the tools for all testing sessions. Subject participated in the testing one at a time to prevent from any interactions between subjects. While the participants performed the given tasks, their actions were observed real-time through a projected display so that the observation setting was less intimidating or obtrusive.
4. Study Procedure
The participants received a brief outline of the study through a recruitment letter. Before testing commenced, participants reviewed and signed a consent form approved by MIT Committee on the Use of Humans as Experimental Subjects explaining their rights as participants.
Each testing session started with a tutorial to introduce the concepts of space exploration and the main features and functions of the tool the subject would be using. The tutorial followed a step-by-step script, instructed by the test administrators and completed by the participant using the respective tool. Each tutorial lasted between 30 to 45 minutes, depending on the number and depth of questions asked by participants.
Following the tutorial, the testing scenario was introduced and executed in two parts. In all sessions, Part 1 was completed before introducing Part 2, and Part 2 built upon terminology and components used in Part 1. Part 1 included an uncrewed mission to lunar orbit for which subjects would use the assigned tool to create a model and verify residual propellant values. The task was introduced by describing the network, elements, mission outline, and target values to verify. After introduction, the subjects completed the task with only clarifying questions answered by test administrators. Subjects were not time-limited to complete Part 1, with an average time to completion of 11.75 minutes and a standard deviation of 12 minutes. Part 2 included a crewed mission to the lunar surface for which subjects would use the assigned tool and an existing model to seek improvement. The task was introduced by describing the network, elements, baseline mission outline, and general strategies for improving the mission
including allowable and unallowable changes. After the introduction, the subjects were provided 15 minutes to complete the task, with only clarifying questions answered by test administrators. After finishing Part 2 of the scenario, participants completed a short questionnaire of nine statements related to perceived usability of the tool used in the particular session.
Each session was conducted over a period of about 90 minutes. The procedures including the tutorial, the two parts of scenario and the questionnaire were carried out in the same order for each session. At the end of the second session, an open-ended, semi-structured interview was carried out so that the participants could freely talk about their experiences, perceptions and suggestions.
B. Data Collection
Multiple methods were used to collect data on the participants’ experiences with the two tools as well as their perceptions. For collecting objective data on task performance, observation gathered quantitative measurements. For more subjective, perception-based responses, a think-aloud protocol, questionnaires and interviews collected both quantitative and qualitative data. All data were coded in order to remove personally-identifiable information. 1. Observation and Think-aloud
Test administrators observed subjects’ actions using a projected display and also recorded actions using Camtasia, screen capture and audio recording software. The recorded video files were coded into an event log which included the time and content of every event completion or milestone in the mission. The time and content of errors created as well as the time of error detection and recovery were recorded in the event log. The time-related information kept in the event log was used for quantitative measurements for the usability metrics. The errors and patterns in detection and correction of errors were used for qualitative pattern-finding.
During the testing sessions, the participants were encouraged to talk aloud about what they are thinking and doing. Such comments were recorded together with their actions using the Camtasia software. In addition to the actions recorded, the user voices gave richer context and more detailed description to accompany the specific actions performed and errors caused, detected and corrected by the participants.
2. Questionnaire
At the end of both testing sessions, the participants completed a one-page questionnaire in which they rated the usability of the tool they used in the session based on their perception. The questionnaire, identical for both sessions, contained nine statements related to perceived usability (available in the Appendix). The participants evaluated each statement on a seven-point Likert scale based on how much they agree or disagree with it.
3. Open-ended Interviews
After completing the second testing session, test administrators conducted an open-ended, semi-structured interview lasting approximately ten minutes for each of the twelve subjects. Both test administrators asked questions and took notes during the interviews. The interview covered more in-depth discussions on the participants’ experiences with the tools as well as the scenarios, tutorials and their thoughts about the overall study. Comments and suggestions for features or interface design changes were also collected. The participants were asked questions on topics such as: comparison of the two tools, comparison of the two scenarios, comments on the tutorials, extrapolation to imagine the usage of the tools for more complex scenarios, the match between their mental models and the representations given by the tools, perceptions about the tools that were not asked in the questionnaire, and any other comments or suggestions.
C. Scenarios and User Tasks
The scenarios and user tasks the participants completed are modeled on past and present missions concepts. The tutorial is based on a conceptual crewed mission to a near-Earth object, Scenario C is based on a Constellation-style exploration at the Lunar South Pole, and Scenario D is based on the Apollo missions.
Part 1 of both scenarios contains the same four user tasks, namely: 1) assemble launch stack, 2) launch from Earth, 3) depart Earth orbit, and 4) arrive in lunar orbit. Part 2 of both scenarios also has the same user task, to maximize the mission Relative Exploration Capability (REC). REC is a measure of the value or effectiveness of research that takes place during an exploration. REC uses the exploration capability achieved (EC), the total person-days of exploration multiplied by the mass of resources and elements directly supporting research, divided by the total mass launched from Earth (LM), each normalized by the performance of the Apollo 17 mission:
10 kg 2930000 / LM day person kg 2594 / / / 17 17 EC LM LM EC EC REC apollo apollo (1)
Thus, REC can be improved by increasing crew time for longer surface explorations, increasing science and exploration mass, and/or reducing the launch mass by decreasing the amount of initial fuel.
1. Tutorial Scenario: Near-Earth Object Mission The tutorial scenario shared similar characteristics as Scenarios C and D, though was used as a training device to illustrate the features and functions of the SpaceNet and spreadsheet tools. The tutorial scenario described a mission to accomplish a five-day exploration at a near-Earth object, outlined in Figure 10. Similar to the testing scenarios, the tutorial was also split into two parts.
The first part created a mission model to verify there is sufficient fuel to complete the mission. Unlike scenarios C and D, the tutorial mission returned to Earth in a fifth task. The user tasks include: 1) assemble heavy-lift launch vehicle at Kennedy Space Center (KSC), 2) launch to low-Earth orbit (LEO), 3) departure from LEO, 4) arrival at the near-Earth object (NEO), and 5) return to splashdown in the Pacific Ocean (PSZ). The second part added human explorers and
evaluated of the mission effectiveness. The participants add two astronauts, analyze demands, add provisions and exploration resources, and evaluate the resulting REC.
2. Scenario C: Constellation Program Lunar Missions
Scenario C describes lunar missions similar to concepts from the NASA Constellation Program. The scenario includes two parts: Part 1 details a cargo resupply mission to low-lunar polar orbit and Part 2 details a dual-launch crewed exploration to the Lunar South Pole.
Part 1, outlined in Figure 11, models a single-launch cargo resupply mission in which 13,000 kilograms of crew provisions are delivered to low-lunar polar orbit (LLPO). The mission uses a heavy-lift launch vehicle (solid rocket boosters, core stage, and upper stage) to transport a cargo module and propulsion module. The user tasks include: 1) assemble launch stack at Kennedy Space Center (KSC), 2) launch to low-Earth orbit (LEO), 3) departure from LEO, and 4) arrival at LLPO. The participants use the tools to model the events and confirm propulsive feasibility by verifying the amount of residual fuel in the upper stage and propulsion module elements.
Figure 11. Scenario C Part 1 mission outline. A
heavy-lift launch vehicle transports a cargo module to Low Lunar Polar Orbit.
Figure 12. Scenario C Part 2 mission outline. A dual-launch
provides transportation to support a four-crew, five-day exploration at the Lunar South Pole.
PSZ LEO LLPO
LSP
KSC
Time (Not to Scale)
0.0 1.0 2.0 3.0 7.0 8.0 9.0 14.0 15.0 16.0 20.0 LEO LLPO KSC Time (days) 0.0 1.0 2.0 3.0 7.0 PSZ LEO NEO KSC 0.0 1.0 2.0 3.0 114.0 119.0 150.0
Time (Not to Scale)
Figure 10. Tutorial mission outline. The tutorial mission uses
a heavy-lift launch vehicle to perform a two-crew member, five-day exploration at a near-Earth object.
Part 2, outlined in Figure 12, modifies a mission using two launches – one human-rated vehicle and one heavy-lift launch vehicle – to complete a five-day exploration at the Lunar South Pole with a crew of four astronauts. Resource consumption and demands analysis become a part of modeling and analysis along with the addition of science and exploration resources which compete for cargo space. The user task is to modify resource quantities, exploration duration, or initial propellant mass to improve the REC from the baseline value of 1.16 while maintaining propulsive feasibility and fulfilling all demands.
3. Scenario D: Apollo Program Lunar Missions
Scenario D describes lunar missions similar to components of the NASA Apollo Program. The scenario includes two parts: Part 1 details a checkout mission to low-lunar orbit inclined based on Apollo 6 and Part 2 details a crewed exploration to Taurus-Littrow based on Apollo 17.
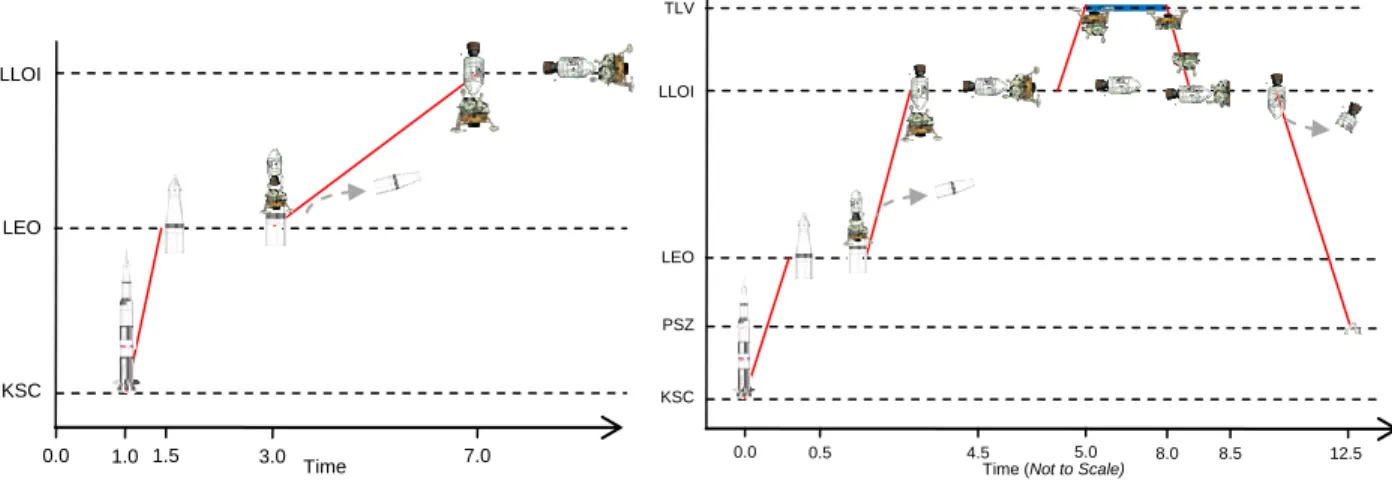
Part 1, outlined in Figure 13, models a checkout mission in which a dummy lunar module is delivered to low-lunar orbit inclined (LLOI). The mission uses a Saturn-V launch vehicle (first stage, second stage, upper stage, and lunar module adapter) to transport a command and service module and dummy lunar module. The user tasks include: 1) assemble launch stack at Kennedy Space Center (KSC), 2) launch to low-Earth orbit (LEO), 3) departure from LEO, and 4) arrival at LLOI. The participants use the tools to model the events and confirm propulsive feasibility by verifying the amount of residual fuel in the upper stage and service module elements.
Part 2, outlined in Figure 14, modifies a mission to complete a three-day exploration at Taurus-Littrow (TLV), a valley on the near-side of the moon, with a crew of three astronauts, two of which go to the surface. Additionally, the mission requires 110 kilograms of surface samples be returned. Resource consumption and demands analysis become a part of modeling and analysis along with the addition of science and exploration resources which compete for cargo space. The user task is to modify resource quantities, exploration duration, or initial propellant mass to improve the REC from the baseline value of 0.49 while maintaining propulsive feasibility and fulfilling all demands.
Figure 13. Scenario D part 1 mission outline. A
Saturn-V launch vehicle delivers a command and service module and dummy lunar module to Low Lunar Orbit-Inclined.
Figure 14. Scenario D Part 2 mission outline. A Saturn-V
provides transportation for a two-crew, three-day exploration at Taurus-Littrow, a valley on the near-side of the Moon.
D. Metrics and Measures
Many existing usability studies’ metrics and measures are defined in terms of effectiveness, efficiency, and satisfaction. The domain of space exploration and logistics has a smaller, more homogeneous user group compared to other consumer software systems. Also, such systems aim for more effective and efficient ways of modeling and analyzing complicated missions and campaigns without making errors. Thus, in testing for usability in this domain more emphasis is placed on evaluation of effectiveness and efficiency rather than comfort or emotional satisfaction.
In this study, metrics for usability testing are defined in terms of three factors: effectiveness, efficiency, and error tolerance and prevention. Effectiveness measures the degree to which a tool enables users to model and analyze space exploration and logistics missions completely with high research values. Efficiency concerns the time and effort needed for users to achieve goals. In this study, error tolerance and prevention, which is often considered as a subset of efficiency, is defined separately since it has a high importance in the domain. Metrics in error tolerance and prevention measure the degree to which a tool enables users to make fewer errors, recover from errors quickly and effectively, and to feel more confident and comfortable about the interactions.
Metrics were defined so that both objective, performance-based measures and subjective, perception- and attitude-based measures are collected. Due to differences in user tasks in Part 1 and 2, some of the performance
PSZ LEO LLOI TLV
KSC
Time (Not to Scale)
0.0 0.5 4.5 5.0 8.0 8.5 12.5 LEO LLOI KSC Time (days) 0.0 1.0 1.5 3.0 7.0
12
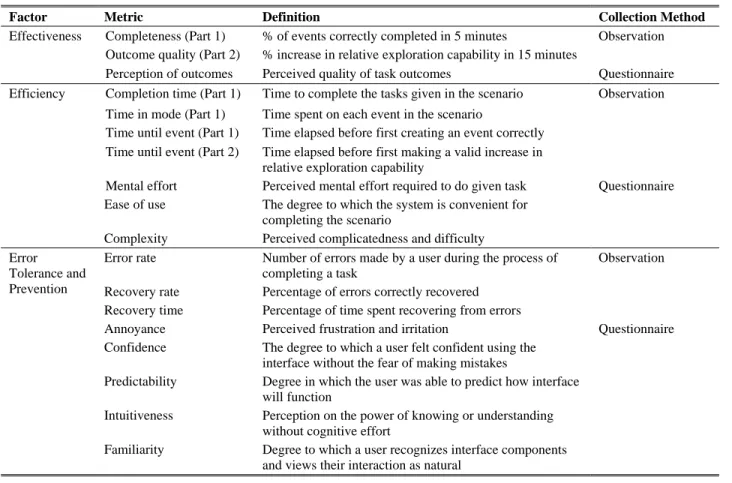
metrics differed accordingly. Also, multiple metrics were defined for each usability factor for a more comprehensive evaluation. The usability factors, metrics and their operational definitions, and their corresponding data collection techniques are summarized in Table 3.
Table 3. Metrics for usability testing
Factor Metric Definition Collection Method Effectiveness Completeness (Part 1) % of events correctly completed in 5 minutes Observation
Outcome quality (Part 2) % increase in relative exploration capability in 15 minutes
Perception of outcomes Perceived quality of task outcomes Questionnaire Efficiency Completion time (Part 1) Time to complete the tasks given in the scenario Observation
Time in mode (Part 1) Time spent on each event in the scenario
Time until event (Part 1) Time elapsed before first creating an event correctly Time until event (Part 2) Time elapsed before first making a valid increase in
relative exploration capability
Mental effort Perceived mental effort required to do given task Questionnaire Ease of use The degree to which the system is convenient for
completing the scenario
Complexity Perceived complicatedness and difficulty Error
Tolerance and Prevention
Error rate Number of errors made by a user during the process of completing a task
Observation Recovery rate Percentage of errors correctly recovered
Recovery time Percentage of time spent recovering from errors
Annoyance Perceived frustration and irritation Questionnaire Confidence The degree to which a user felt confident using the
interface without the fear of making mistakes
Predictability Degree in which the user was able to predict how interface will function
Intuitiveness Perception on the power of knowing or understanding without cognitive effort
Familiarity Degree to which a user recognizes interface components and views their interaction as natural
IV. Analysis and Results
The analysis and results of the usability study are presented in four sections. First, the task in Part 1 is analyzed for statistical differences between conditions, followed by a similar analysis of Part 2. Next, the results from the questionnaires are analyzed for statistical differences between conditions. Finally, the major points from semi-structured interviews following the second session are presented.
A. Part 1 Analysis
Table 4 presents the results of statistical t-tests to identify the significant effects between experimental variables (complete results are presented in the Appendix). There is no significant difference between the subjects with space backgrounds and those with no space background using the SpaceNet tool, however subjects with a space background using the spreadsheet tool completed their first task faster, t(10)=-2.47, p<0.05, and made fewer errors, t(10)=-2.26, p<0.05, than subjects with no space background.
Additional statistical tests seek to determine statistically significant effects between the paired scenarios (C and D) and paired ordering of sessions. The number of tasks completed in the first five minutes was significantly larger for Scenario D than Scenario C, t(11)=1.433, p<0.05, although the task times and total completion time were not statistically different. No significant differences were found in the ordering of sessions.
Finally, the paired results between tools are compared for significant differences. The SpaceNet tool results in a significantly shorter time in task 2 (launch from Earth), 3.479, p<0.05, time in task 4 (lunar arrival), t(11)=-3.720, p<0.05, and time in recovery, t(11)=-2.488, p<0.05. Also, the results indicate that on average SpaceNet caused fewer errors and required shorter time for completing the overall task, modeling the first correct event, and modeling the earth departure, although not at a statistically significant level.
Table 4. Part 1 analysis – mean metric values Between Groups (SN) Between Groups (SS) Paired
Scenarios Paired Sessions Paired Tools 1° 2° SB NSB C D 1 2 SN SS Completion Time (s) 375.1 601.5 662.4 1554.8 802.4 608.0 811.0 599.4 450.6 959.8 Time to Correct Task (s) 114.4 111.8 119.1* 349.8* 199.8 109.7 143.5 166.0 113.5 196.0 Time in Task 1 (s) 76.1 66.0 60.6 53.3 75.9 55.0 74.8 56.1 72.8 58.2 Time in Task 2 (s) 100.6 188.0 226.4 381.3 219.7 188.1 163.5 244.25 129.8** 278.0** Time in Task 3 (s) 68.0 74.8 112.8 99.3 85.4 93.0 113.3 62.3 70.5 108.3 Time in Task 4 (s) 17.3 21.5 53.8 37.8 31.2 35.9 36.3 30.8 18.7** 48.4** Tasks in 5 Minutes (#) 2.63 2.50 1.75 1.50 1.50* 2.75* 2.17 2.08 2.58 1.67 Error Rate (#) 1.63 2.25 2.38* 5.00* 3.08 2.00 2.33 2.75 1.83 3.25 Recovery Rate (%) 75.0 70.8 77.3 83.3 70.6 80.6 65.9 85.2 73.1 78.0 Recovery Time (%) 13.5 1.95 33.8 47.0 33.7 20.0 22.9 30.8 15.5* 38.2* * Significant difference at α=0.05, ** Significant difference at α=0.01, SN: SpaceNet, SS: Spreadsheet
Figure 15. Paired Part 1 task times. The SpaceNet (SN) tool required significantly less time to complete tasks 2 (launch from
Earth) and 4 (arrival in lunar orbit) compared to the spreadsheet (SS) tool. Paired times are connected with a gray line.
Figure 16. Paired Part 1 completion times. Although not
statistically significant, completion times varied widely between the SpaceNet (SN) and spreadsheet (SS) tools. Paired times are connected with a gray line
Figure 17. Paired Part 2 outcome quality. The spreadsheet
(SS) tool has significantly higher outcome quality compared to the SpaceNet (SN) tool. Paired qualities are connected with a gray line.
14 B. Part 2 Analysis
Table 5 presents the results of statistical t-tests to identify the significant effects between experimental variables (complete results are presented in the Appendix). As none of the subjects in the non-space group successfully increased the REC in the SpaceNet tool there is a significant difference between the two groups, t(10)=3.921, p<0.05, however there is no significant difference between the groups for the spreadsheet tool.
Additional statistical tests seek to determine statistically significant effects between the paired scenarios (C and D) and the paired ordering of sessions. No significant differences were found between Scenario C and Scenario D, though the recovery rate was significantly higher for the second session, t(11)=-2.468, p<0.05.
Finally, the paired results between tools are compared for significant differences. The spreadsheet tool results in a higher outcome quality, t(11)=-2.685, p<0.05, fewer errors, t(11)=2.721, p<0.05, and less time in recovery, t(11)=2.458, p<0.05, as compared to the SpaceNet tool.
Table 5. Part 2 analysis – mean metric values
Between Groups (SN) Between Groups (SS) Paired Scenarios Paired
Sessions Paired Tools 1° 2° SB NSB C D 1 2 SN SS Outcome Quality (%) 205.0** 100.0** 294.6 338.4 255.4 223.8 215.5 263.6 170.0* 309.2* Time to REC Increase (s) 467.4 n/a 415.5 527.8 327.7 533.9 542.4 319.1 467.4 394.1
Error Rate (#) 1.75 2.25 0.88 0.75 1.50 1.25 1.50 1.25 1.92* 0.83* Recovery Rate (%) 59.5 37.5 41.7 33.3 39.6 50.0 25.0* 64.6* 45.8 43.8 Recovery Time (%) 12.6 36.6 3.4 25.4 14.8 16.5 12.0 18.3 20.6* 10.8* * Significant difference at α=0.05, ** Significant difference at α=0.01, SN: SpaceNet, SS: Spreadsheet
C. Questionnaire Results
Table 6 presents the result of statistical t-tests to identify the significant effects between experimental variables. There were no significant differences between the subjects with or without space backgrounds, Scenario C versus D, or the ordering of the sessions. Between the two tools, the only significant difference was that the spreadsheet tool requires significantly more mental effort, t(11)=-2.238, p<0.05, than the SpaceNet tool. The results also indicate that users on average felt SpaceNet to be more convenient and easy to use, more capable of achieving high-quality outcomes, less complicated, less annoying or frustrating, better in terms of using with confidence, more intuitive, and more familiar and natural, although not at a statistically significant level.
Table 6. Questionnaire results – mean response values
Between Groups (SN)
Between Groups (SS)
Paired
Scenarios Paired Sessions Paired Tools 1° 2° SB NSB C D 1 2 SN SS Q1: Mental Effort 4.25 3.25 5.12 4.75 4.75 4.17 4.92 4.00 3.92* 5.00* Q2: Convenience 5.25 5.00 3.75 4.50 4.67 4.50 4.67 4.50 5.17 4.00 Q3: Predictability 4.75 4.25 4.12 6.00 4.67 4.67 4.67 4.67 4.58 4.75 Q4: High-quality Outcome 4.38 4.00 4.00 3.25 3.58 4.41 3.75 4.25 4.25 3.75 Q5: Complicated Interface 3.81 3.25 4.63 3.50 3.88 4.00 4.08 3.79 3.63 4.25 Q6: Annoyance or Frustration 3.25 5.50 4.50 4.00 4.08 4.25 4.83 3.50 4.00 4.33 Q7: Confidence 4.25 5.50 3.75 5.00 4.42 4.42 4.92 3.92 4.67 4.17 Q8: Intuitiveness 5.38 5.00 4.25 5.25 4.75 5.08 4.75 5.08 5.25 4.58 Q9: Familiarity 4.75 5.50 4.13 5.25 4.50 5.00 4.67 4.83 5.00 4.50 * Significant difference at α=0.05, SN: SpaceNet, SS: Spreadsheet
D. Interview Results
In the interview setting, subjects confirmed that Part 1 of both Scenario C and D were of equivalent complexity or difficulty with no significant differences between the two. Several subjects indicated Scenario C Part 2 was more complex due to the dual-launch architecture and one subject mentioned Scenario D Part 2 was more “constrained.”
Several subjects agreed that learning effects occurred between the two sessions; however the effects were not directly tied to tool use. Rather, subjects found the mission descriptions easier to grasp in the second session, primarily due to greater familiarity with terminology and the modeling framework. Indeed, although not formally logged, the tutorial and mission overview periods took less time during the second session and one subject mentioned the second tutorial was “a little slow.” Additionally, several subjects mentioned an improvement to understanding the relative exploration capability metric used in Part 2 and its sensitivities to inputs (e.g. cargo versus propellant) and refinement of strategies to implement.
Subjects felt the tutorials adequately prepared them for the tasks at hand, though several expressed a desire for additional self-exploration time with assistance available as needed. Subjects were most comfortable with the processes repeated during the tutorial, e.g. burn sequences, as opposed to processes only briefly touched upon, e.g. moving cargo or resources. Subjects also took advantage of past experience with Microsoft Excel to quickly familiarize with the spreadsheet tool, whereas there was a “steeper acquainting period” with SpaceNet.
In general subjects found the spreadsheet interface easier to “play with” by rapidly changing many inputs and seeing the results in a global view. In contrast, SpaceNet was “busier,” requiring more “changing tabs and opening/closing” dialogs, and ultimately taking longer to use. At the same time several subjects praised the visual and graphical nature of SpaceNet making the conceptualization easier than numbers alone. Several subjects also commented on the abstraction or hiding of data, with more of the “ancillary information” hidden in SpaceNet. For some subjects, this was negatively described as a “black box” or “smoke and mirrors” and ultimately reduced confidence in the tool. Other subjects perceived the abstraction of data as beneficial to understanding the tool.
Several subjects mentioned that SpaceNet introduced helpful error detection by indicating the origin of errors in most cases rather than hunting through spreadsheet cells. Several subjects using the spreadsheet mentioned during their task that they were not confident that they were correctly modeling the missions and what types of inputs would “break” the model (and indeed, there were several cases of undetected errors).
One subject mentioned that SpaceNet could be helpful for mission conceptualization; however with extensive experience with Excel he has no problem “seeing” the spreadsheet as a space mission. Another subject mentioned that “Excel is not intuitive” whereas “SpaceNet is intuitive, graphic, and helps to create the mission.” Several subjects pointed out that Scenario C Part 2 would be challenging to model in a spreadsheet as the columns shift in both time and location to model the two launches, introducing difficulty to determine “what and where things are.”
When questioned about the extension of the tool to significantly more complex scenarios, several subjects mentioned limitations of the spreadsheet tool. Several subjects commented that the spreadsheet tool is “not scalable… and at some point chokes,” and modeling a complex scenario was a “disaster waiting to happen,” or would be a “nightmare in a list format,” and that SpaceNet would be “more convenient in the long run.” This opinion was not unanimous, as several subjects strongly felt a more complex scenario could be modeled in the spreadsheet tool and they would be more confident in the results.
Overall, opinions were split as to which was preferred: the primary argument for the spreadsheet tool was that of efficiency and transparency, that of the SpaceNet tool was for error detection and visualization. Several subjects felt that with additional training they could more effectively use SpaceNet.
V. Discussion
Discussion of the results is organized into two topics. The first section discusses the quantitative and qualitative evaluation of the SpaceNet and spreadsheet tools with regards to usability. The second section specifically discusses the incidence of errors and differences in methods of detection and recovery between the two tools.
A. Tool Efficiency and Effectiveness
The comparison of tool efficiency is most apparent in Part 1, which imposed end-condition constraints but no time limit. Within Part 1, subjects using the SpaceNet tool completed tasks 2 and 4 faster and spent less time in error recovery, but the overall task time was not significantly different. Task 2 models the Earth launch, which requires three separate burns (first, second, and third stages) to complete. Within the spreadsheet tool, the three burns span three columns with independent inputs and outputs for each one whereas the SpaceNet tool links the three burns into an integrated transport process. Event 4 models the arrival burn to lunar orbit, which requires the burning of an in-space vehicle. Within the spreadsheet tool, this burn is a separate column with independent inputs and outputs whereas within the SpaceNet tool it again is an integrated transport process coupling the departure and arrival burns. Based on observations, the major difference in recovery time occurred where the subject detects an error, but does not yet know the source. Within the spreadsheet tool, subjects spent significant time searching through the cell
16
formulas to track down the source of an error, whereas within the SpaceNet tool subjects leveraged the visual plots, pre-simulation, and simulation error messages.
The comparison of tool effectiveness is most apparent in Part 2, which imposed a time limit but no defined upper-bound to the of increase in REC. Within Part 2 subjects using the spreadsheet tool resulted in higher REC, made fewer errors and spent less time in error recovery than the SpaceNet subjects. The spreadsheet tool allows users to quickly explore the design space and identify the most sensitive inputs to increase REC. In particular, extending the exploration duration was easier in the spreadsheet tool than the SpaceNet tool, which required an error-prone update process. Several of the SpaceNet subjects got stuck in a series of cascading errors when attempting to modify the timing of events. This topic is discussed further in the next section.
The paired tool analysis presented does not control for variation introduced by the differences in scenario or session order, and aggregates both user groups. The differences in scenario only tested significantly to affect the number of tasks completed in Part 1, which was insignificant between the two tools. The differences in session order significantly affected only recovery rate, which was insignificant between the two tools. Due to the limited sample size and relatively poor fit, no correlations were used to control for these effects. Although the analysis aggregates both user groups (space and non-space background) as all comparisons are within-subjects so the results are indicative of individual performance rather than group performance.
This analysis also did not consider interaction effects between control variables. The most plausible interaction effects may include tool-order and scenario-tool. In particular, the interviews indicated that using the SpaceNet tool first may be beneficial for understanding the spreadsheet tool, and at least one subject mentioned that Scenario C would be more challenging in the spreadsheet tool due to the dual-launch architecture. Unfortunately, due to limited sample size (six paired samples from two user groups per interaction) there is insufficient power to test these effects. One of the secondary objectives of this study is to investigate the use of space logistics tools by non-experts. Part 1 found that subjects with a space background using the spreadsheet tool completed their first task faster and made fewer errors than non-space subjects. This could be explained by a greater familiarity with spreadsheets, which is commonplace in conceptual mission design. Interestingly, no such differences were detected within the SpaceNet tool, an indication that it is an easier environment for non-experts to analyze space logistics. Part 2 revealed more significant differences, where no non-space subjects achieved a valid increase in REC when using the SpaceNet tool. The major source of errors was found where the subjects purposely or inadvertently changed the timing of events and in the process, losing the target of the event.
B. Errors, Detection, and Recovery
The incidence of errors, detection, and recovery is an emergent topic within this study. The types of errors and methods of detection varied across the two tools, and a small number of errors were repeated across several subjects, providing indication that there may be underlying reasons at work. These errors are summarized below in Table 7.
Table 7. Summary of tool errors and detection/recovery SpaceNet Spreadsheet Frequent Errors Event timing
Event targeting Cargo nesting
Stack mass formulas Updating remaining delta-v
Discarding residual fuel when staging Dynamic nesting constraints
Inaccessible resources Discovery and Recovery Pre-simulation state Simulation errors Status messages Incorrect validation
The main errors in SpaceNet relate to event timing, event targeting, and cargo nesting. Event timing errors include to the inadvertent or purposeful changing of event times causing vehicles to miss transports or crew members to miss transfer between vehicles. Timing errors lead to event targeting errors, in which events at an incorrect time may lose their target when edited (e.g. a move event at the wrong time may “forget” to move the crew members because they are at a different location). Cargo nesting errors occurred when subjects did not place resource containers within a containing element (e.g. cargo resource containers should be within a carrier vehicle).
The discovery of errors in the SpaceNet tool was predominately through pre-simulation or simulation errors. Common examples of these types of discovery include the absence of an element from a subsequent event (e.g.
missing a carrier during a transport) or an error notification that insufficient delta-v was achieved during a transport. These modes of discovery rely on intermediate state information provided as the subjects are modeling a mission.
The main errors in the spreadsheet tool occurred while entering stack mass formulas, updating remaining delta-v between burns, discarding remaining fuel while staging, violating dynamic nesting constraints, and consuming inaccessible resources. The first three errors indicate mismatches between the user’s mental model and the tool’s model, and could be improved with additional training or changes to the tool’s model. The other two errors are a result of tool model limitations for intermediate state visibility. Although the spreadsheet tool could be modified to display this type of information, it would be challenging to automate the updating of such information.
The discovery of errors in the spreadsheet tool was through status messages and incorrect validation. Status messages helped identify potential errors at several steps including specifying initial element states, completing burns, and satisfying demands. Incorrect validation was used in Part 1 to identify the effects of an error rather than the underlying error itself which could have many such sources.
VI. Conclusion
This study sought to evaluate the comparative efficiency and effectiveness of two tools for analyzing space logistics. A human experimentation usability study using within-subjects evaluation of space logistics scenarios yielded several results. The SpaceNet tool provided higher efficiency for several tasks including multi-burn space transportation segments when modeling an exploration mission, while the spreadsheet tool provided superior effectiveness of improving a mission model, as measured by relative exploration capability.
The study also provided qualitative insights to the underlying differences between the models, as gleaned through semi-structured interviews. Subjects did not unanimously prefer one tool to the other, and provided insights to the differences between them. The SpaceNet tool was praised for its graphical nature, intuitive interaction, and error checking; however it was chided for being a “black box” and having too many tabs and dialogs to edit values. The spreadsheet tool was praised for its openness, complete system state, ease of iteration; however was described as not scalable to more complex scenarios, and creates uncertainty that errors may have been introduced.
Results also indicated that SpaceNet may have characteristics that make tasks easier to learn or more engaging. Quantitative results show that performances of non-experts differ from subjects with a space background partially with the spreadsheet tool, but not with SpaceNet. It suggests that SpaceNet can be more capable of “bringing in” potential users. One subject also commented that SpaceNet could be used as “a learning tool” to have people more interested in the field.
One other surprising result from this study was related to the rich data gathered with respect to errors. Subjects introduced more errors than expected, however there were only a few fundamental types of errors committed. The errors within the SpaceNet tool were often related to flaws within the tool or mistakes with regards to abstraction, whereas errors within the spreadsheet tool were often related to flaws within the model or mistakes in processes. Future work will address, in detail, the modes of error creation, detection, and correction compared across the two tools to inform the design of error-tolerant tools.
It is clear that this study does not identify one tool as “better” than the other; however both should be seen as having positive and negative qualities. The ideal space logistics tool would incorporate the best qualities of both, and hopefully, as few negative qualities as possible. Some important qualities would include: rapid modification of input values, complete state visualization capabilities, visual and graphical representations, dynamic state feedback throughout the scenario, simple intuitive interfaces, and error detection and correction. Direct improvements to SpaceNet include an alternative interface to view all inputs in a single screen, tighter coupling between mission definition and simulation, and improved transparency of the underlying model.
This study was limited to investigating rather simple missions due to the time availability of experimental subjects. Future studies could benefit from investigating scalability of tools by looking at the interactions of users and tools for longer-duration, complex missions or campaigns. Indeed, the first iteration of usability scenarios in this study included significantly more challenging missions for Part 2: Scenario A modeled a four-mission campaign to the Lunar South Pole including one uncrewed checkout mission, two human missions, and one cargo resupply mission and Scenario B modeled a 30-month human exploration of Mars including two cargo in-space transit vehicles and one human in-space transit vehicle launched aboard nine heavy-lift launch vehicles. During pilot testing, however, it became clear that the tasks exceeded the comprehension available in fifteen minutes with only limited tutorial time. This type of complex scenario, however, would test the limits of the data model in the spreadsheet tool. Future work will investigate alternative testing designs to allow the investigation of long-duration, complex missions.