HAL Id: hal-00300838
https://hal.archives-ouvertes.fr/hal-00300838
Submitted on 6 Jan 2003HAL is a multi-disciplinary open access
archive for the deposit and dissemination of sci-entific research documents, whether they are pub-lished or not. The documents may come from teaching and research institutions in France or abroad, or from public or private research centers.
L’archive ouverte pluridisciplinaire HAL, est destinée au dépôt et à la diffusion de documents scientifiques de niveau recherche, publiés ou non, émanant des établissements d’enseignement et de recherche français ou étrangers, des laboratoires publics ou privés.
Charging of ice-vapor interfaces
J. Nelson, Mark D. Baker
To cite this version:
J. Nelson, Mark D. Baker. Charging of ice-vapor interfaces. Atmospheric Chemistry and Physics Discussions, European Geosciences Union, 2003, 3 (1), pp.41-73. �hal-00300838�
ACPD
3, 41–73, 2003Charging of ice-vapor interfaces
J. Nelson and M. Baker
Title Page Abstract Introduction Conclusions References Tables Figures J I J I Back Close Full Screen / Esc
Print Version Interactive Discussion
c
EGU 2003
Atmos. Chem. Phys. Discuss., 3, 41–73, 2003 www.atmos-chem-phys.org/acpd/3/41/
c
European Geosciences Union 2003
Atmospheric Chemistry and Physics Discussions
Charging of ice-vapor interfaces
J. Nelson1and M. Baker21
Nelson Scientific, 7-13-8 Oginosato Higashi, Otsu, Shiga 520-0248, Japan
2
Dept. of Earth and Space Science and Atmospheric Sciences, University of Washington, Seattle, WA 98195-1310, USA
Received: 11 September 2002 – Accepted: 17 December 2002 – Published: 6 January 2003 Correspondence to: J. Nelson ([email protected])
ACPD
3, 41–73, 2003Charging of ice-vapor interfaces
J. Nelson and M. Baker
Title Page Abstract Introduction Conclusions References Tables Figures J I J I Back Close Full Screen / Esc
Print Version Interactive Discussion
c
EGU 2003 Abstract
The build-up of intrinsic Bjerrum and ionic defects at ice-vapor interfaces electrically charges ice surfaces and thus gives rise to many phenomena including thermoelectric-ity, ferroelectric ice films, sparks from objects in blizzards, electromagnetic emissions accompanying cracking in avalanches, glaciers, and sea ice, and charge transfer dur-5
ing ice-ice collisions in thunderstorms. Fletcher’s theory of the ice surface in equilibrium proposed that the Bjerrum defects have a higher rate of creation at the surface than in the bulk, which produces a high concentration of surface D+ defects that attract a high concentration of OH− ions at the surface. Here, we add to this theory the effect of a moving interface caused by growth or sublimation. This effect can increase the 10
amount of Bjerrum and ionic surface charges more than 10-fold for growth rates near 1 µm s−1and can extend the spatial separation of interior charges in qualitative agree-ment with many observations. In addition, ice-ice collisions should generate sufficient pressure to melt ice at the contact region and we argue that the ice particle with the initially sharper point at contact loses more mass of melt than the other particle. A sim-15
ple model of this process with parameters that are consistent with observations leads to predicted collisional charge exchange that semiquantitatively explains the negative charging region of thunderstorms. The model also has implications for snowflake for-mation, ferroelectric ice, polarization of ice in snowpacks, and chemical reactions in ice surfaces.
20
1. Introduction
Electrical charging at the ice-vapor interface is revealed directly by surface potentials (Caranti and Illingworth, 1980) and high surface conductivities (Maeno, 1973), and indirectly by processes involving triboelectrification (Petrenko and Colbeck, 1995), fer-roelectricity (Iedema et al., 1998), crystal growth (Rydock and Williams, 1991), tem-25
perature gradients (Jaccard, 1964), creation of new surfaces (Fifolt et al., 1992), and 42
ACPD
3, 41–73, 2003Charging of ice-vapor interfaces
J. Nelson and M. Baker
Title Page Abstract Introduction Conclusions References Tables Figures J I J I Back Close Full Screen / Esc
Print Version Interactive Discussion
c
EGU 2003
electrical attraction of ice crystals to other surfaces (Ohtake and Suchannek, 1970). Such charging can cause ice crystals to orient (Vonnegut, 1965) and possibly levitate (Gibbard et al., 1995) in the electrical atmosphere of thunderclouds, and can modify many atmospheric processes such as collection of ions, aerosols, and droplets (Prup-pacher and Klett, 1997) by ice, and aggregation of snow crystals in clouds (Finnegan 5
and Pitter, 1988) and in wind-blown snow (Schmidt, 1982). The transfers of charge when an ice particle strikes another ice surface or another material are examples of contact charging involving electronic insulators, one of the oldest problems of an elec-trical nature (Castle, 1997). For example, static discharges occur when snow parti-cles recoil from wires and aircraft (Ives, 1938; FAA, 2001). But the most spectacular 10
outcome of the contact charging of ice occurs in thunderstorms when mm-sized ice particles formed from accreted supercooled drops, hereafter graupel, fall at speeds exceeding 5 m s−1 and strike small, uplifting ice crystals (Illingworth, 1985). About 20 fC per collision is transferred from one to the other, leading to powerful in-cloud elec-tric fields and often lightning, thus maintaining Earth’s elecelec-trical circuit. We present a 15
simple model that is consistent with these wide-ranging observations and which allows speculation that the same processes can lead to lightning on Jupiter (Gibbard et al. 1995) and elsewhere in the solar system.
2. Physical basis and approach
Jaccard (1964) developed a microscopic theory of the electrical properties of ice that 20
uses the conservation equations for ions OH− and H3O+and Bjerrum D and L defects to explain ice thermoelectricity with and without impurities. D and L defects are the majority charge carriers in bulk ice and are responsible for the fact that ice’s static dielectric constant exceeds 100 below 0◦C. Unlike the ions, the Bjerrum defects create internal electric fields via their polarization of the ice lattice as they migrate such that 25
the D defect effectively has a positive charge and L is negative (Fig. 1). Hereafter we call them D+ and L−. Because D+ and L− charges arise from rotations of H2O
ACPD
3, 41–73, 2003Charging of ice-vapor interfaces
J. Nelson and M. Baker
Title Page Abstract Introduction Conclusions References Tables Figures J I J I Back Close Full Screen / Esc
Print Version Interactive Discussion
c
EGU 2003
molecules that violate the ice rules, they are not free charges and cannot be transferred in collisions. However, because their bulk concentrations are about 105times those of the water ions at equilibrium (Petrenko and Whitworth, 1999; hereafter PW, p. 154), they greatly influence the electric field inside ice. Furthermore, experimental evidence suggests that the Bjerrum defects are important for ice surface charging: collisional 5
charge exchange, presumably due to OH−, increases with ice crystal growth rate even though surface potential measurements, which detect the neutralization between the OH− and D+, have little dependence on growth rate (Caranti and Illingworth, 1980).
Our model is built on the fundamental physical ideas of Jaccard theory but is not sensitive to the molecular structure of Bjerrum defects; we require only their effective 10
charges and mobilities that have been inferred from numerous experiments summa-rized in PW (p. 154). Because the ice-vapor interface has anomalous structural and electrical properties, Jaccard’s model must be supplemented with a description of the surface. The oft-used surface disorder theory in Fletcher (1968) predicts that the sur-face region has a low activation energy for the creation of D+ and L−. The build-up 15
of these defects by their faster creation at the surface and the subsequent drift of L− to the bulk sets up an electric field that pulls OH− ions to the surface. For example, recent estimates (Petrenko and Ryzhkin, 1997; hereafter PR) suggest that the equi-librium surface has ∼106and 1011 times the bulk concentrations of Bjerrum and ionic defects, respectively.
20
Many attempts have been made to explain the charging of ice during growth and the subsequent contact charging during collisions. Several of these invoke the fact that the H3O+ ion is much more mobile than OH− in ice (Jaccard, Petrenko and Whitworth), so that charge separation occurs when the ions move down concentration or field gradi-ents at different rates. But we focus here on two new aspects to this problem. One 25
is a “sweeping” effect caused by the moving ice surface when ice grows or sublimates (an example of the classic “Stefan” problem), which can increase or decrease the neg-ative surface charge depending on whether growth or sublimation occurs. However, describing the motion of four mutually-interacting defects in the nonuniform,
ACPD
3, 41–73, 2003Charging of ice-vapor interfaces
J. Nelson and M. Baker
Title Page Abstract Introduction Conclusions References Tables Figures J I J I Back Close Full Screen / Esc
Print Version Interactive Discussion
c
EGU 2003
librium environment of the ice surface is complex; thus the problem is very difficult, even with the simplifications used here. The second aspect is the well-known property of ice to melt under pressure: when the corner of an ice crystal strikes another surface, the force of the collision can produce melt that is then pushed to the side, due to the pressure gradient, and onto the graupel. This process transfers charge to the graupel. 5
Because of the complex ice-atmospheric environment in nature and in experiments, it is difficult to quantitatively compare theory to most ice-charging- related studies. In-stead, we use the model to explain the more reliable trends that are listed in Tables 1a and 1b. Furthermore, we use measured ice crystal vapor growth rates and reasonable estimates of two collision parameters to show that our model quantitatively agrees with 10
experiments that simulate thunderstorm charging.
3. Surface charging during growth or sublimation
We assume the ionic and Bjerrum carriers are created and recombined in pairs and migrate in the ice. To treat both equilibrium (stationary surface) and nonequilibrium (moving surface), we write the equations in a reference frame moving with the surface 15
at rate v [m s−1], where v is positive, negative, or zero corresponding to growth, subli-mation, or equilibrium. Thus, when v > 0, even without the defects hopping between lattice sites, the defects have an effective flux [m−2 s−1] towards the ice interior; for example, this flux is v d (x) for D+, where d (x) is the number concentration of D+. d (x) obeys the following continuity equation with x being the distance from the surface: 20
∂d /∂t= FB− dl / < l > τB− jD0, (1) where the prime means derivative with respect to x, FB [m−3 s−1] is the creation rate of Bjerrum D+ and L− pairs, l (x) is the L− concentration with bulk average < l >≈ 3×10²¹m−3at −20◦C (PW, p. 154), and τBis the time scale for D+and L−to recombine to reach steady state. The number flux jD into the crystal here is v d , but in general 25
ACPD
3, 41–73, 2003Charging of ice-vapor interfaces
J. Nelson and M. Baker
Title Page Abstract Introduction Conclusions References Tables Figures J I J I Back Close Full Screen / Esc
Print Version Interactive Discussion
c
EGU 2003
We solved Eq. (1) plus equations for E , jD, and the equations for the other 3 defects numerically for cases with defect creation rates at the surface that are 5–100 times the rates in the bulk. Due to numerical instabilities, we have not directly simulated charge profiles with surface concentrations 106–1011 times those in the bulk (which are inferred from surface conductivities); nevertheless, we found robust trends in the 5
solutions that permit simple analysis. We describe this analysis here and will describe the simulations elsewhere.
Because the mobilities of all four defects are included, the model is consistent with the high dielectric constant of ice; furthermore, the solutions agree well with the ther-moelectric effect in pure ice. Thus, this model is consistent with entries 1–2 of Table 1a. 10
As in Fletcher’s theory, we assume a low activation energy of D+and L−at the surface, which results in an excess of surface D+ over L− that attracts a high concentration of OH− to the surface (Fig. 2) thus producing a high dc surface conductivity (entry 3, Table 1a). Examination of our numerical results shows that the important physi-cal features of the charge distributions during growth and sublimation are captured by 15
focusing on the majority carriers D+ and L−. For simplicity, here we assume D+ is im-mobile, which is consistent with the overall evidence indicating that D+ is much less mobile than the other three defects (PW, p. 154). In steady state, Eq. (1) predicts
v d0= FB− dl / < l > τB. (2)
Thus, creation-recombination balance does not occur during growth. Even when v is 20
very small and thus d0≈ d00< 0, where subscript 0 denotes equilibrium, the product on
the LHS of Eq. (2) can be significant. We assume small nonequilibrium perturbations of d and l are linear in v ; e.g. d (x)= d0(x)+ vδd(x). To first order in v, Eq. (2) gives the increase of D+ as
v δd (x)= −v < l > τBd00(x)/l0(x), (3) 25
where we have dropped the δl (x) term. Including this term increases the charg-ing δd (x) for reasons described below, but is less than the term above. Physically,
ACPD
3, 41–73, 2003Charging of ice-vapor interfaces
J. Nelson and M. Baker
Title Page Abstract Introduction Conclusions References Tables Figures J I J I Back Close Full Screen / Esc
Print Version Interactive Discussion
c
EGU 2003
v δd (x) > 0 at the surface during growth because the advancing surface effectively
“sweeps” surface D+ inward (d00(x) < 0 at the surface), and thus d (x) must increase until the recombination rate balances this effective flux (Fig. 3). A distinctive and im-portant property of sweeping (i.e. v d , v l ) is its action on all parts of a crystal; growth pushes L− to the crystal center as D+ builds up near the surface. This large-scale po-5
larization sets up an electric field that pulls more OH− ions to the surface and pushes H30+ ions towards the crystal center (Fig. 2), in accord with entry 4 in Table 1a. The opposite occurs during sublimation.
Numerical solutions of the equations show that the growth-induced perturbation in the ionic field roughly cancels the perturbed Bjerrum electric field. Thus, we assume 10
the excess OH− migrate to the surface region to cancel the field from δd (x). One then obtains the nonequilibrium addition to the surface ion concentration cOH [#ions m−2] by integrating δd (x) over the surface region. We assume l0(x)=< l >, so
cOH ∼ 0.61v δBd0(0). (4)
The factor 0.61 is the ratio of the effective charge on the D+ to that on the OH−(PW, 15
p. 154). In general, the ionic surface concentration cI is the difference of OH− and H3O+ concentrations that arise in equilibrium, which is estimated by fitting to experi-ments below, plus the additional amount (e.g. Eq. 4) that comes from growth or subli-mation. Because the ions have one elementary charge ±e, the surface charge density
σ = −e cOH. For simplicity, we assume cOH is strictly two-dimensional. Equation (4) 20
gives an order-of-magnitude estimate of the nonequilibrium surface charge because it assumes the ions simply respond to the electric field from the Bjerrum defects. A more accurate treatment must consider how the ions and L− diffuse and interact with the electric field, but such a treatment requires numerical methods. It can be shown that the low mobility of OH− (compared to H3O+) also tends to increase surface OH−, 25
so that Eq. (4) likely underestimates surface OH−. For example, the estimate below suggests τI/τB≈ 104, which would increase the OH−by nearly 104over Eq. (4) if OH− was completely immobile and had an increase of creation rate at the surface similar to that of D+. Another consequence of the tendency of Bjerrum and ionic surface charges
ACPD
3, 41–73, 2003Charging of ice-vapor interfaces
J. Nelson and M. Baker
Title Page Abstract Introduction Conclusions References Tables Figures J I J I Back Close Full Screen / Esc
Print Version Interactive Discussion
c
EGU 2003
to cancel is that it can explain why ionic charging appears to increase with growth rate (Baker et al., 1987; Berdeklis and List, 2001), whereas the surface potential is rela-tively insensitive to growth and sublimation rates (Caranti and Illingworth, 1980) (entry 6, Table 1a).
We briefly address the role of D+ mobility and the reason d not l increases at the 5
surface during growth. Mobility can be neglected if the diffusive flux of D+, DDd0(x), is much less than the sweeping flux v d . If the region of large D+ concentration is limited to a region of thickness∆ then justification for our neglect of D+ diffusion requires that
DD/v∆ << 1. Presently, the diffusion constant of D+ is poorly known; for example, Petrenko and Whitworth (PW, p. 154) only suggest that it is much less than that of 10
L− and might depend on an interaction with vacancies. If DD equals the H2O self-diffusion constant at −10◦C, that is, about 10−15m2s−1, and∆ ∼ 0.1 µm, then mobility can be ignored when |v | >> 0.01 µm s−1, which is generally satisfied for ice crystals in the atmosphere. Although these values of DD and ∆ are very uncertain, it is fairly well established that D+ is less mobile than L−; hence, the qualitative results here 15
should be valid even when the mobility of D+ influences the charging. Finally, consider Eq. (1) when growth first starts; here, ∂d /∂t ≈ −v d00 > 0 at the surface. Similarly, ∂l /∂t≈ −vl00, which is negative at the surface because l00 > 0 according to the analysis
in PR. Thus, growth causes d to increase at the surface and l to decrease.
To compare predicted and measured surface charging, we estimate numerical val-20
ues in Eq. (4) based on various measurements. At −10◦C, theory (PR) can explain measured ac and dc electrical properties of the surface if d0(0)= 3 × 1027m−3, which we assume is independent of temperature. The recombination time τB is unknown and thus is estimated here. An electrostatic model for the recombination of D+ and L− yields τB = 10−9ε/3πµLqL< l >, where µLis the mobility of L− with effective charge 25
qL= −0.38e and ε is the high-frequency dielectric constant. With recommended
val-ues µL = 2 × 10⁻⁸m2 V−1s−1 at −20◦C, ε = 3.16, and activation energies of 0.25 eV (for µL) and 0.73 eV (for < l >) (PW, p. 154), τB ≈ 4.6 × 10⁻⁵s at −20◦C and Eq. (4) predicts cOH = 1.5 × 10¹⁶, 8.4 × 10¹⁶, and 5.4 × 10¹⁷m−2 for −10, −20, and
ACPD
3, 41–73, 2003Charging of ice-vapor interfaces
J. Nelson and M. Baker
Title Page Abstract Introduction Conclusions References Tables Figures J I J I Back Close Full Screen / Esc
Print Version Interactive Discussion
c
EGU 2003
−30◦C, respectively, for a growth rate of 1 µm s−1. This calculated growth charging exceeds an estimated equilibrium cOH of ≈ 6 × 10¹⁵m−2(10−4− 10−3C m−2from PW, p. 238), which explains entry 5 in Table 1a. During sublimation, v < 0 and hence d decreases as l increases at the surface, which pulls H3O+ to the surface. Because the dc surface conductivity is proportional to mobility times surface concentration, the 5
increased concentration of the highly-mobile H3O+ during sublimation should increase the dc surface conductivity as is measured (entry 7, Table 1a). The success of this model at explaining observations in Table 1a lends confidence to its application to the more difficult case of ice-ice collisions.
4. Charge transfer during ice-ice collisions
10
An obvious manifestation of large-scale charge separation is lightning, which requires net gain or loss of charge during ice-ice collisions (Illingworth, 1985). In well char-acterized experiments on ice-ice collisional charging, sub-millimeter, freshly- frozen, mono-dispersed ice spheres near equilibrium collided with a larger ice surface, and induction rings tracked the charge on the spheres before and after impact (Gaskell 15
and Illingworth, 1980; hereafter GI). In these experiments, when the target ice is not growing, the charge transfer∆Q is roughly independent of the temperature and doping of the target but depends on doping in the ice sphere (Illingworth and Caranti, 1985). This independence is inconsistent with surface state theory (e.g. Castle, 1997) that has been successfully applied to the charging of other materials. We argue below that this 20
unusual property of charging during ice-ice collisions, as well as the other observed relations in Table 1b, arise from a primarily one-way transfer of charged melt.
Experiments by Mason and Dash (2000) found that negative charge transfer between contacting ice surfaces is correlated with a mass transfer, and subsequent analysis indicated that the mass is likely melt (Dash et al., 2001). Pressure melting can explain 25
ACPD
3, 41–73, 2003Charging of ice-vapor interfaces
J. Nelson and M. Baker
Title Page Abstract Introduction Conclusions References Tables Figures J I J I Back Close Full Screen / Esc
Print Version Interactive Discussion
c
EGU 2003
elastic rebound of a small ice crystal on a flat ice surface is (Higa et al., 1998)
Pcon = 195(Rcr/rtp)0.6U0.4, (5)
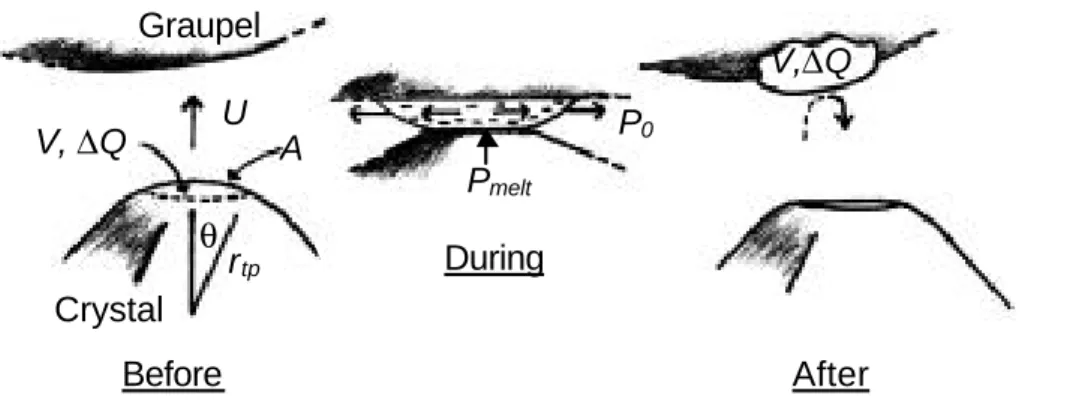
where Rcr is the equivalent sphere radius of the smaller crystal, rtp is its radius of curvature at the initial point of contact (Fig. 4), and U [m s−1] is its impinging speed normal to the surface. We fit Kishimoto and Maruyama’s (1998) data on the melting 5
pressure of ice Pmel t[MPa] to
Pmel t= −12.237 T − 0.1171 T2, (6) for temperature T [◦C] between 0 and −24◦C. Equating Pcon and Pmel t sets a critical speed above which pressure melting can occur in the contact region. Table 2 shows that these critical speeds are much less than the 5 m s−1updrafts in the strong electrical 10
charging regions of thunderstorms, particularly when rtp << Rcr. Hence, elasticity theory indicates that pressure melting occurs for typical ice-ice collisions in clouds. But collisional forces change dramatically once melt forms, so the theory by itself cannot predict the amount of melt transfer. To estimate this quantity, a cruder approach is used.
15
Just before contact, the ice surface on one particle will generally differ from that on the other. It can have a different temperature, charge density, and radius of curvature. In some experiments, for example those of Latham and Mason (1961) and Mason and Dash (2000), the two contacting ice surfaces likely had nearly equal radii of curvature. The theories of Latham and Mason (1961) and Dash et al. (2001), respectively, fit these 20
experiments. However, their theories poorly explain other experimental data: charge transfer based only on temperature differences (Latham and Mason’s) has been ruled out as the generator of thunderstorm electricity (Illingworth, 1985), and Dash et al.’s mechanism based on different surface charge densities and temperatures between the two surfaces does not explain measured charge transfers between two nongrowing 25
crystals (GI). In contrast, the initial points of contact between colliding atmospheric ice particles should have very different radii of curvature. We argue here that, in most
ACPD
3, 41–73, 2003Charging of ice-vapor interfaces
J. Nelson and M. Baker
Title Page Abstract Introduction Conclusions References Tables Figures J I J I Back Close Full Screen / Esc
Print Version Interactive Discussion
c
EGU 2003
cases, the estimated direction of mass transfer is dominated by the difference in radii of curvature between the particles.
When contact occurs, the pressure builds up until melt forms. This melt can form on both particles in the contact region; however, the melt that forms in the initially sharper particle has a much stronger horizontal pressure gradient forcing the fluid to 5
the side and thus to the flatter particle (Fig. 4). If a slice of area a and thickness∆x melts and remains at Pmel t(T ), the work to quasistatically push this fluid to the side is
Pmel t(T )a∆x. There will be local cooling caused by melting and heating due to viscous dissipation and refreezing, but for simplicity, we assume T remains near its original value. The total work to remove the melt from the sharper particle cannot exceed the 10
loss of incident kinetic energy KE due to the collision. Thus, summing over the volume slices of thickness∆x, the total transferred volume V [m3]= P a∆x, is
V = f 1923Rcr3 U2/Pmel t(T ), (7)
where the density of ice at −10◦C was assumed and f is the fraction of KE used to transfer mass. Dash et al. (2001) predict about 12-fold more melt volume than that 15
in Eq. (7) because they neglect the work to push the melt aside. Because other pro-cesses, including some mass flow from flatter to sharper surface, can also remove KE from the collision, f is less than the inelasticity of the collision. Measurements with ice spheres (Higa et al., 1998) impacting normally on a flat ice surface show that the in-elasticity increases with decreasing size and is ≈ 0.5 for Rcr = 1.4 mm. Thus, f could 20
exceed 0.5 for atmospheric ice crystals if no other processes absorb KE, although
f ∼ 0.03 − 0.3 fits the charging measurements described below (which are likely av-erages over both normal and glancing collisions). We assume that V is bound by the original point’s spherical surface and a slice normal to the contact plane (Fig. 4) and thus the original surface charge in this volume transfers and freezes to the flatter ice 25
surface, which, unless otherwise stated, is assumed to be the graupel. When the grau-pel is significantly warmer than the crystal, the graugrau-pel contact point could melt before that in the crystal and possibly reverse the overall direction of charged-mass transfer. Such a reversal of mass transfer might explain the positive graupel charging (Pereyra
ACPD
3, 41–73, 2003Charging of ice-vapor interfaces
J. Nelson and M. Baker
Title Page Abstract Introduction Conclusions References Tables Figures J I J I Back Close Full Screen / Esc
Print Version Interactive Discussion
c
EGU 2003
et al., 2000) when the graupel surface was above ∼ −7◦C and the crystals were about −10◦C, but in another study, this positive charging did not occur, even when the grau-pel was 5◦C warmer than the crystal (Marshall et al., 1978). Due to the complexity and unknown nature of atmospheric ice-ice collisions, our mass transfer mechanism is presently speculative. The main point is the predicted direction of mass transfer. 5
In addition to the pressure-gradient argument that we described above, other factors should also favor mass transfer to the flatter particle. These include shearing off of the sharper point and partial penetration of the sharper point into the flatter surface. Also, the sharper particle is more likely to melt because it might be softer for two reasons: greater frictional heating if it rubs along the flatter surface and because the sharper 10
points are generally on the particle growing rapidly from the vapor. (Melting can arise from electrostatic pressure within charged ice (PR), which implies that the more highly-charged, fast-growing crystal is softer at its corners than the slower-growing crystal.) 4.1. Charge transfer in equilibrium
We first use measured charge transfers for collisions between frozen droplets and rel-15
atively flat, nongrowing surfaces (simulated graupel) to fit f and the equilibrium con-tribution to σ. We then use these best-fit parameters to compare predicted with mea-sured charge transfers during collisions of facetted growing crystals with graupel. For
Rcr < 70 µm, the charge transfer∆Q [fC] from nongrowing ice spheres to the simulated
graupel at −10◦C is ≈ −1.6 U (Rcr/50)2, where U and Rcr have units m s−1 and µm, 20
respectively (GI). Using V from Eq. (7) and assuming the spherical cap of Fig. 4, the predicted charge transfer is
∆Q ≈ −3.9 × 10⁵U σ
0(f /Pmel t)0.5(Rcr/50)2, (8)
where σ0[C m−2] is the ionic surface charge density for stationary interfaces (hereafter “equilibrium”) and Pmel t[MPa] is evaluated at the ambient temperature. The fact that 25
∆Q is proportional to U and not U2
is due to geometry: over a realistic range of θ, the area A of a spherical cap increases as 2√(πrtpV ) (Fig. 4). As ∆Q ∝ A, it follows that
ACPD
3, 41–73, 2003Charging of ice-vapor interfaces
J. Nelson and M. Baker
Title Page Abstract Introduction Conclusions References Tables Figures J I J I Back Close Full Screen / Esc
Print Version Interactive Discussion
c
EGU 2003
∆Q ∝ V0.5
∝ U, which agrees with entry 2 in Table 1b. Further analysis for the case that the curvature at the contact point rtp differs from the radius of the sphere Rcr with the same mass as the crystal leads to∆Q[fC] ≈ 156Uσ0(f /Pmel t)0.5rtp0.5Rcr1.5. We fix f so that∆Q fits measurements; e.g. σ0f0.5= 4.3 × 10⁻⁵C m−2 and thus f = 0.16 for an estimated equilibrium σ0of 10−4C m−2 (PW, p. 238). This fit for the −10◦C data also 5
agrees well with Buser and Aufdermaur’s measurements at −45◦C for Rcr = 10 µm and U = 10 m s−1: using Pmel t = 380 MPa, the predicted charge is ∆Qp = −0.32 fC versus the measured value of −0.3 fC. Thus, Eq. (8), with constant σf0.5, can be used over a wide radius and temperature range.
4.2. Charge transfer between ice crystals and graupel 10
Neither vapor-grown ice crystals nor graupel are spheres. Vapor-grown ice crystals generally have flat, facetted faces separated by sharp edges and corners. In the ab-sence of some presently unknown alignment force, all collisions should involve the corner of one particle striking a relatively flat section of the other particle. The shape at a crystal corner should be approximately spherical and the resolution in ice crystal pho-15
tographs suggests that rtp < 10 µm. Conversely, graupel surfaces grow when drops
of diameter typically exceeding 15 µm impact, flatten, and freeze. Thus, when graupel does not have frost, the graupel likely has the flatter surface in most collisions. How-ever, as there is considerable variation possible in impact orientation and local shape on a graupel surface, significant variation in∆Q is predicted; this variation should be 20
particularly large when the graupel has frost or fragile rime branches, which agrees with experiment (entry 3, Table 1b).
The charging due to growth (Eq. 4) plus the fitted equilibrium charge (below Eq. 8) results in a charge transfer to the graupel∆Q[fC] of
∆Q = −(K0+ vf0.5Kv)U rtp0.5R 1.5 cr P −0.5 mel t, (9) 25
ACPD
3, 41–73, 2003Charging of ice-vapor interfaces
J. Nelson and M. Baker
Title Page Abstract Introduction Conclusions References Tables Figures J I J I Back Close Full Screen / Esc
Print Version Interactive Discussion
c
EGU 2003
from the conversion of units. For convenience, the units for v , U , rtp, Rcr, and Pmel t are µm s−1, m s−1, µm, µm, and MPa, respectively. The temperature dependence of Kv is from µl and < l >. In addition, temperature dependences of K0, other factors in Kv (e.g. d0), and collisional and environmental parameters in f could modify Eq. (9) but are presently unknown.
5
Charge transfer data in the literature are usually presented in terms of maximum crystal dimension D. But, because ice crystals change shape during growth, Rcris not proportional to D; rather, for up to 5 min of growth, measurements find Rcr3 ∝ D1.7 for tabular crystals and Rcr3 ∝ D1.03 for columnar crystals (Takahashi et al., 1991). Col-lision experiments (Keith and Saunders, 1990) with vapor-grown crystals impacting a 10
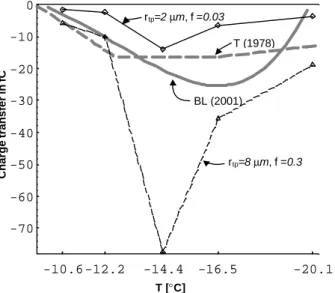
stationary ice target at −25◦C and U = 10 − 50 m s−1showed that∆Q ∝ D0.6−0.8. With this growth data, Eq. (9) predicts∆Q ∝ D0.5−0.9 (including both columnar and tabular cases), which agrees well with measurement (entry 4 in Table 1b). Furthermore, for reasonable parameter values, Eq. (9) quantitatively agrees with collision experiments under simulated thunderstorm conditions as shown in Fig. 5. The predicted peaks in 15
the charging near −14.4◦C are due to the peaks in v and Rcr at this temperature (entry 5, Table 1b). Thus, the variation in growth rate dominates the temperature trend, a fac-tor that has not been explicitly realized in previous models of the charge transfer but is consistent with the oft-stated hypothesis from Baker et al. (1987): “The faster-growing particles (by vapor transfer) acquire positive charge”. Other trends are apparent. For 20
example, lower temperatures have larger charging mainly because of the decrease in the L− concentration with temperature. Also, larger radii of curvature rtp at the contact point have greater charging because of the greater surface area (which can explain entry 6 in Table 1b), and a larger collision efficiency f results in more charging because more ice melts. Finally, we mention that previous charging theories have difficulty ex-25
plaining the positive charging of graupel when the ice crystals are sublimating (Saun-ders et al., 2001); but such charging follows from Eq. (9) because v<0 and Kv>> K0
(entry 7, Table 1b).
ACPD
3, 41–73, 2003Charging of ice-vapor interfaces
J. Nelson and M. Baker
Title Page Abstract Introduction Conclusions References Tables Figures J I J I Back Close Full Screen / Esc
Print Version Interactive Discussion
c
EGU 2003 5. Further implications of charge transfer model for thunderstorm
electrifica-tion
5.1. Thunderstorms
In thunderstorms, the collision speed U and the colliding ice particles’ masses and growth rates all increase, in general, with increasing updraft speeds. Thus, our model 5
can explain why fast updraft speeds and rapid vapor growth v in clouds are needed to produce vigorous electrification in the main (negative) charging zone of thunderstorms. This model applies to collisions between dry surfaces in which one is sharper than the other; thus it explains the negative charging regime (∆Q < 0) in which the graupel is relatively smooth (Takahashi, 1978), which is T < −10◦C and cloud liquid water con-10
tents ρl ∼ 0.3 − 3 g m−3 (Fig. 6a). Takahashi’s complete data set, which is consistent with the later studies of Pereyra et al. (2000) and Takahashi and Miyawaki (2002), successfully models thunderstorms (Helsdon et al., 2001) and shows that the tripolar nature of thunderstorms arises from the boundary in T − ρl space between negative and positive graupel charging. Due to the “knobbly” shape of graupel, predicting exact 15
surface conditions is difficult; but estimates in Williams et al. (1991) indicate that the graupel surface 1) has vapor-grown frost due to the relatively low surface temperature at the lowest ρl values (regime of mostly positive charging), 2) sublimates due to the relatively high surface temperature on the graupel at middling ρl values (mostly nega-tive charging), and 3) has liquid water at the highest ρl values (posinega-tive charging). In 20
the negative regime, some collisions might involve a facet region of the crystal strik-ing a graupel “knob” (Fig. 6b) and thus transferrstrik-ing charged mass to the crystal. But such collisions can also negatively charge the graupel because sublimation charges the graupel surface positively (v < 0 in Eq. (9)). At high ρl, the graupel’s liquid film would greatly soften the collision, and the dry, cooler surface of a rebounding crystal 25
should instead remove charged liquid from the graupel (Fig. 6g). This should produce overall positive charging (Takahashi, 1978; Graciaa et al., 2001), even if most crystals stick to the graupel. Conversely, positive charging at low ρl should result if the frost has
ACPD
3, 41–73, 2003Charging of ice-vapor interfaces
J. Nelson and M. Baker
Title Page Abstract Introduction Conclusions References Tables Figures J I J I Back Close Full Screen / Esc
Print Version Interactive Discussion
c
EGU 2003
the sharper point at the collision (Fig. 6d) or if ice breaks off the graupel (Fig. 6f). In the former case, Eq. (9) would apply with the opposite sign, but fracture, which does oc-cur in the positive regime at low ρl, removes much larger amounts of negative charge (Hallett and Saunders, 1979). A maximum amount of charge when a fractured surface is removed from graupel is estimated by multiplying the charge per area in Eq. (4) by 5
the surface area of the fast-growing frost surface (which neglects neutralizing H3O+ in the interior of the ice (Fig. 2)). This amount can exceed −104fC. Thus, even if only a small fraction of the collisions result in fracture, the fractured pieces can dominate the average charge transfer. Our model is consistent with the negative charging regime in thunderstorms and suggests a change to positive at higher and lower ρl (entry 8, Ta-10
ble 1b). Therefore, the model here describes a plausible mechanism of thunderstorm electrification.
In addition to the noninductive charge transfer described above, charges induced on ice particles by the in-cloud electric field can also be transferred from particle to par-ticle. This ice-ice inductive charge transfer increases the thunderstorm charging rate 15
after the noninductive ice crystal-graupel mechanism establishes a strong field (Hels-don et al., 2001). Previously, researchers have assumed that these induced charges are transferred by conduction during brief, melt-free collisions (e.g. Illingworth and Caranti, 1985). Given the brevity of such a collisional contact and the relative slow-ness of conduction, this process has been considered weak. However, if the charge is 20
transferred with melt, as argued here, then ice-ice induction can have greater influence on thunderstorm charging. Thus, charge transfer accompanying mass transfer could partly explain why experiments on ice-ice induction with snow crystals (Scott and Levin, 1970) showed larger charge transfers than the standard inductive theory with conduc-tion and also larger charge transfers than experiments with ice spheres (Illingworth and 25
Caranti, 1985). Furthermore, the ice-ice inductive charge transfer should increase with
U as it does with noninductive collisional charge transfer (e.g. Eq. 8), not decrease
as previous theories assume, because the charge transfer mechanism should be the same for both inductive and noninductive charging.
ACPD
3, 41–73, 2003Charging of ice-vapor interfaces
J. Nelson and M. Baker
Title Page Abstract Introduction Conclusions References Tables Figures J I J I Back Close Full Screen / Esc
Print Version Interactive Discussion
c
EGU 2003
5.2. Effect of impurities on charge transfer
Real ice generally contains impurities, which can affect ice electrical properties. Buser and Aufdermaur (1977) found that NH3added to frozen droplets increased their neg-ative charge transfer to a metal target, whereas HF reversed the sign of the transfer (entry 9, Table 1b) and had a larger effect than NH3for equal concentrations. To ex-5
plain these trends, we assume that NH3 and HF substitute for an H2O molecule in the ice lattice and the concentration of these impurities is greater in the ice interior than it is on the surface. (The latter is consistent with the tendency of ice to reject impurities and freezing of an ice shell around the droplet before the interior is completely frozen.) The substitution of NH3 in ice is thought to release an OH−, leaving a relatively immobile 10
D+ and NH+4 (PW p. 99). Some of this OH−should migrate to the surface, which would increase the OH− concentration at the surface and lead to the observed result. A simi-lar argument holds for NH4OH, which would explain results of experiments on sand-ice collisions (Jayaratne, 1991). Conversely, the substitution of HF in ice is thought to re-lease an H3O+ and an L−, leaving a relatively immobile F− (PW p. 98). Some of the 15
H3O+ should migrate to the surface, which would increase the H3O+ concentration at the surface and lead to the observed result; in addition, migration of L− to the surface would produce an electric field that can pull more H3O+ to the surface (Fig. 1). HCl should have an effect similar to HF but there are as yet no relevant measurements. Measured charging tendencies (Jayaratne, 1991; Jayaratne et al., 1983) with doping 20
of NaCl and (NH4)2SO4are qualitatively consistent with our model if one assumes that these compounds dissociate and separate in ice according to measured trends (e.g. Workman and Reynolds, 1950), but quantitative prediction is difficult.
6. Implications of the model to other geophysical and planetary phenomena
In this section, we speculate on the possible roles played by charge redistribution and 25
ACPD
3, 41–73, 2003Charging of ice-vapor interfaces
J. Nelson and M. Baker
Title Page Abstract Introduction Conclusions References Tables Figures J I J I Back Close Full Screen / Esc
Print Version Interactive Discussion
c
EGU 2003
6.1. Charging between ice and other materials
Non-sublimating ice charges positively when sand particles rebound from it (Jayaratne, 1991). As sand is much harder than ice, charged-mass transfer is predicted to be from the ice surface to the sand and thus should positively charge the ice in agreement with measurement. Also, in the laboratory, ice spheres impacting metals at 10 m s−1 5
deposit net negative charge during rebound, the only exceptions being metals that easily emit electrons from their surface (Buser and Aufdermaur, 1977; Caranti et al., 1985). The hardness of metals allows pressure melting of ice to occur in such collisions (Table 2), and thus the measurements support the present model. However, such charging, which can be a nuisance when crystals strike antennas and aircraft (FAA, 10
2001) or cause corona and sparks from objects in contact with blowing snow (Ives, 1938), should be greatly alleviated if the metal is coated by a thin layer of soft material such as silicone rubber. For example, Table 2 shows that ice crystals would require supersonic speeds to transfer charge to rubber via pressure melting.
6.2. Heterogeneous chemistry 15
Uptake of tropospheric gases by liquid drops is often highly dependent on pH; however, the effect of intrinsic ice surface pH on surface chemical reactions has not been studied. Charging during growth should make the ice surface more basic due to the high OH− concentration. For example, if 20 fC of surface charge is contained in a volume V ≈ 3 µm3 (typical of data in Fig. 5), the average pH upon melting would be 9.6. The pH 20
right at the surface would likely be greater than this average. 6.3. Crystal aggregation
Consequences of surface charging and pressure melting during collisions are largely ignored in atmospheric and planetary studies even though both phenomena can signif-icantly influence various phenomena in these fields. For example, maximum snowflake 25
ACPD
3, 41–73, 2003Charging of ice-vapor interfaces
J. Nelson and M. Baker
Title Page Abstract Introduction Conclusions References Tables Figures J I J I Back Close Full Screen / Esc
Print Version Interactive Discussion
c
EGU 2003
size increases dramatically for snowfalls above about −10◦C with a smaller peak near −12◦C. Aggregation of snow crystals into snowflakes should depend on collision stick-iness and electrostatic forces between the crystals. Pressure melting should make the surfaces stickier in collisions. Furthermore, because collisions transfer only a fraction of the surface charge, collisions involving the tip of one crystal and the center of an-5
other can retain strong electrostatic attraction even after the charged-mass transfer. Thus, the growth charging in this model can partly explain why tip-center attachments of two snow crystals are common (Finnegan and Pitter, 1988). At low temperatures, the electrostatic attraction can be high for fast-growing frost crystals. This attraction likely explains the fragile “yukimarimo” frostballs that form in Antarctica on the snow surface 10
when light winds break rapidly-grown frost crystals that tumble about and clump to-gether (Kameda et al., 1999). Even at low temperatures, growth charging and pressure melting might influence the aggregation of water-frost covered particles in planetary rings (Jurac et al., 1995) and in planetesimal formation.
6.4. Ferroelectric ice grains 15
Ice grains in snowpacks are often subjected to temperature gradients that allow subli-mation on the warmer side of an air gap and growth on the colder side. According to our model, growth polarizes the lattice with an electric field in one direction, whereas sublimation polarizes in the opposite direction (relative to the surface). Thus, such ice grains can partly polarize from the growing to sublimating ends, which means that the 20
ice becomes partly hydrogen-ordered and ferroelectric along the average temperature gradient. Raman spectroscopy and inelastic neutron scattering on ice from Antarctica, which originated as snowpack, showed proton ordering in samples kept below 237 K (Fukazawa et al., 1998). Such ordering has been a mystery because solid ice in the laboratory transforms to the hydrogen-ordered XI phase only below 72 K; but the 25
growth-sublimation of small grains at low temperature might cause such an orientation to freeze into the lattice and remain until the ice is warmed enough for the Bjerrum defects to migrate back to their usual disordered state. Hence, this surface charging
ACPD
3, 41–73, 2003Charging of ice-vapor interfaces
J. Nelson and M. Baker
Title Page Abstract Introduction Conclusions References Tables Figures J I J I Back Close Full Screen / Esc
Print Version Interactive Discussion
c
EGU 2003
might partly explain the hydrogen ordering in Antarctic ice. Also, the polarity predicted by our model was measured in crystalline ferroelectric ice films grown at 135—140 K (Iedema et al. 1998). The latter study argued that the polarization was caused by growth, as we do here.
7. Conclusions
5
Explaining the charging of ice in the atmosphere has enormous difficulties because of the complex nature of ice crystal growth, the four types of charge carriers in ice, and because the atmospheric environment includes updrafts, electric fields, water droplets, and various free charges. The nature of the ice surface is itself the source of much de-bate, and the collisional process will likely be poorly understood for some time. These 10
complexities justify our simplification of the problem, but it means that the present theory will likely evolve as finer experimental and theoretical details become known. Some details, such as the depth distributions of the charges, non-zero mobility of D+, and second-order terms might reduce the charging predicted at the outermost surface layer, whereas repulsion of charges at the growing surface (and electrical induction 15
before impact) should push (and pull) more charge to the collision points at the cor-ners and thus increase the charging. Also, disorder of the ice-vapor interface, which is predicted to increase with surface charge (PR), allows greater charged-melt transfer than that proposed here. The microscale roughness of graupel during riming should also be determined. Nevertheless, our theory is based on established properties of 20
ice and is the first that is broadly consistent with wide range of observations. It gives semiquantitative agreement with experiments that, when used in a cloud model, suc-cessfully simulate thunderstorm charging. When more data on the electrical properties of the ice-melt interface become available, we can apply the theory to melt growth. Finally, other hydrogen-bonded crystals have ionic and Bjerrum defects (Tonkonogov, 25
1998) and thus might have surface charging similar to that in ice. Examples include many minerals, and NH3 and H2S crystals, which are common in the atmosphere of
ACPD
3, 41–73, 2003Charging of ice-vapor interfaces
J. Nelson and M. Baker
Title Page Abstract Introduction Conclusions References Tables Figures J I J I Back Close Full Screen / Esc
Print Version Interactive Discussion
c
EGU 2003
the outer planets. Asymmetry between their contacting surfaces is important whether or not pressure melting occurs. For example, collisions can fracture sharp crystal cor-ners, which can lead to large-scale charge separation via gravitational sedimentation. Thus, the surface charging of hydrogen-bonded crystals such as ice by the motion of Bjerrum defects could have widespread implications.
5
Acknowledgement. Ch. Knight of NCAR made numerous suggestions for improvement
includ-ing the interpretation of yukimarimo formation, C. Saunders of UMIST found several errors in an early version and suggested comparison to measured surface potentials and sublimating ice, and T. Takahashi of Obirin University made several helpful clarifications. MBB is grateful for the support of the Bosack-Kruger Foundation and also for NSF grant ATM-0211247. 10
References
Baker, B, Baker, M. B., Jayaratne, E. R., Latham, J., and Saunders, C. P. R.: The influence of diffusional growth rates on the charge transfer accompanying rebounding collisions between ice crystals and soft hailstones, Q. J. R. Meteorol. Soc., 113, 1193–1215, 1987.
Berdeklis, P. and List, R.: The ice crystal-graupel collision charging mechanism of thunderstorm 15
electrification, J. Atmos. Sci., 58, 2751–2770, 2001.
Buser, O. and Aufdermaur, A. N.: Electrification by collisions of ice particles on ice or metal tar-gets, in Electrical Processes in the Atmosphere, Eds. H. Dolezalek and R. Reiter, Steinkopf, Darmstadt, Germany, 1977.
Caranti, J. M. and Illingworth, A. J.: Surface potentials of ice and thunderstorm charge separa-20
tion, Nature, 284, 44–46, 1980.
Caranti, J. M., Illingworth, A. J., and Marsh, S. J.: The Charging of Ice by Differences in Contact Potential, J. Geophys. Res., D 90, 6041–6046, 1985.
Castle, G. S. P.: Contact charging between insulators, J. Electrostatics, 40 and 41, 13–20, 1997.
25
Dash, J. G., Mason, B. L., and Wettlaufer, J. S.: Theory of collisional charging of ice: Micro-physics of thunderstorm electrification, J. Geophys. Res., 106, 20395–20402, 2001.
Dong, Y. and Hallett, J.: Charge Separation by Ice and Water Drops During Growth and Evap-oration, J. Geophys. Res., 97, 20361–20371, 1992.
ACPD
3, 41–73, 2003Charging of ice-vapor interfaces
J. Nelson and M. Baker
Title Page Abstract Introduction Conclusions References Tables Figures J I J I Back Close Full Screen / Esc
Print Version Interactive Discussion
c
EGU 2003
FAA: Aeronautical Information Manual, Sect. 5 (Potential flight hazards), Subsect. 7-5-10 (Pre-cipitation static),http://www.faa.gov/atpubs/aim/Chap7/aim0705.html, 2001.
Fifolt, D. A., Petrenko, V. F., and Schulson, E. M.: Preliminary study of electromagnetic emis-sions from cracks in ice, Phil. Mag., B 67, 289–299, 1992.
Finnegan, W. G. and Pitter, R. L.: A postulate of electric multipoles in growing ice crystals: their 5
role in the formation of ice crystal aggregates, Atmos. Res., 22, 235–250, 1988.
Fletcher, N. H.: Surface structure of water and ice II: a revised model, Phil. Mag., 18, 1287– 1300, 1968.
Fukazawa, H. Mae, S. Ikeda, S., and Whalley, E.: Proton ordering in Antarctic ice observed by Raman and neutron scattering, Chem. Phys. Lett., 294, 554–558, 1998.
10
Gaskell, W. and Illingworth, A. J.: Charge transfer accompanying individual collisions between ice particles and its role in thunderstorm electrification, Q. J. Roy. Meteorol. Soc., 106, 841– 854, 1980.
Gibbard, S., Levy, E. H., and Lunine, J. I.: Generation of lightning in Jupiter’s water cloud, Nature, 378, 592–595, 1995.
15
Graciaa, A., Creux, P., Lachaise, J., and Schechter, R. S.: Charge transfer between colliding hydrometeors: Role of surface tension gradients, J. Geophys. Res., D 106, 7967–7972, 2001.
Hallett, J. and Saunders, C. P. R.: Charge Separation Associated with Secondary Ice Crystal Production, J. Atmos. Sci., 36, 2230–2235, 1979.
20
Helsdon, J. H., Wojcik, W. A., and Farley, R. D.: An examination of thunderstorm charging mechanisms using a two-dimensional storm electrification model, J. Geophys. Res., 106, 1165–1192, 2001.
Higa, M. Arakawa, M., and Maeno, N.: Size Dependence of Restitution Coefficients of Ice in Relation to Collision Strength, Icarus, 133, 310–320, 1998.
25
Iedema, M. J., Dresser, M. J., Doering, D. L., Rowland, J. B., Hess, W. P., Tsekouras, A. A., and Cowin, J. P.: Ferroelectricity in Water Ice, J. Phys. Chem., B 102, 9203–9214, 1998. Illingworth, A. J.: Charge separation in thunderstorms: small scale processes, J. Geophys.
Res., 90, 6026–6032, 1985.
Illingworth, A. J. and Caranti, J. M.: Ice Conductivity Restraints on the Inductive Theory of 30
Thunderstorm Electrification, J. Geophys. Res., D 90, 6033–6039, 1985.
Ives, R. L.: Weather Phenomena of the Colorado Rockies, (see pp. 704-5), J. Franklin Inst., 226, 691–755, 1938.
ACPD
3, 41–73, 2003Charging of ice-vapor interfaces
J. Nelson and M. Baker
Title Page Abstract Introduction Conclusions References Tables Figures J I J I Back Close Full Screen / Esc
Print Version Interactive Discussion
c
EGU 2003
Jaccard, C.: Thermoelectric effects in ice crystals I. Theory of the steady state, Phys. Kondens. Materie ,1, 143–151, 1964.
Jayaratne, E. R.: Charge separation during the impact of sand on ice and its relevance to theories of thunderstorm electrification, Atmos. Res., 26, 407–424, 1991.
Jayaratne, E. R., Saunders, C. P. R., and Hallett, J.: Laboratory studies of the charging of 5
soft-hail during ice crystal interactions, Quart. J. R. Met. Soc., 109, 609–630, 1983.
Jurac, S., Baragiola, R. A., Johnson, R. E., and Sittler, E. C., Jr.: Charging of ice grains by low-energy plasmas: Application to Saturn’s E ring, J. Geophys. Res., A 100, 14821–14831, 1995.
Kameda, T., Hoshimi, H., Azuma, N., and Motoyama, H.: Observation of “yukimarimo” on the 10
snow surface of the inland plateau, Antarctica ice sheet, J. Glaciology, 45, 394–396, 1999. Keith, W. D. and Saunders, C. P. R.: Charging of aircraft: high-velocity collisions, J. Aircraft, 27,
218–222, 1990.
Kishimoto, Y. and Maruyama, M.: Growth of Ice Ih in Water and Measurements of its Melting Curve, Rev. High Pressure Sci. Technol., 7, 1144–1146, 1998.
15
Latham, J.: The electrification of frost deposits, Quart. J. Roy. Meteorol. Soc., 89, 265–270, 1963.
Latham, J. and Mason, B. J.: Electric charge transfer associated with temperature gradients in ice, Proc. Roy. Soc., A, 260, 523–536, 1961.
Maeno, N.: Measurements of surface and volume conductivities of single ice crystals, in 20
Physics and Chemistry of Ice, ed. E. Whalley, S. J. Jones, and L. W. Gold, Roy. Soc. Canada, Ottawa, 140–145, 1973.
Marshall, B. J. P., Latham, J., and Saunders, C. P. R.: A laboratory study of charge transfer accompanying the collision of ice crystals with a simulated hailstone, Q. J. R. Met. Soc., 104, 163–178, 1978.
25
Mason, B. L. and Dash, J. G.: Charge and mass transfer in ice-ice collisions: a mechanism for thunderstorm electrification, J. Geophys. Res., 105, 10185–10192, 2000.
Ohtake, T. and Suchannek, R. G.: Electric properties of ice fog crystals, J. Appl. Meteorol., 9, 289–293, 1970.
Pereyra, R. G., Avila, E. E., Castellano, N. E., and Saunders, C. P. R.: A laboratory study of 30
graupel charging, J. Geophys. Res., 105, 20803–20812, 2000.
Petrenko, V. F. and Colbeck, S. C.: Generation of electric fields by ice and snow friction, J. Appl. Phys., 77, 4518–4521, 1995.
ACPD
3, 41–73, 2003Charging of ice-vapor interfaces
J. Nelson and M. Baker
Title Page Abstract Introduction Conclusions References Tables Figures J I J I Back Close Full Screen / Esc
Print Version Interactive Discussion
c
EGU 2003
Petrenko, V. F. and Ryzhkin, I. A.: Surface States of Charge Carriers and Electrical Properties of the Surface Layer of Ice, J. Phys. Chem. B, 101, 6285–6289, 1997.
Petrenko, V. F. and Whitworth, R. W.: Physics of Ice, Oxford Univ. Press, Oxford, 1999.
Pruppacher, H. R. and Klett, J. D.: Microphysics of Clouds and Precipitation 2nd edn, Kluwer Academic, Norwell, Massachusetts, 1997.
5
Rydock, J. P. and Williams, E. R.: Charge separation associated with frost growth, Q. J. R. Meteorol. Soc., 117, 409–420, 1991.
Saunders, C. P. R., Peck, S. L., Aguirre Varela, G. G., Avila, E. E., and Castellano, N. E.: A laboratory study of the influence of water vapor and mixing on the charge transfer process during collisions between ice crystals and graupel, Atmos. Res. 58, 187–203, 2001.
10
Schmidt, R.: Properties of blowing snow, Rev. Geophys. Space Phys., 20, 39–44, 1982. Scott, W. D. and Levin, Z.: The effect of potential gradient on the charge separation during
interactions of snow crystals with an ice sphere, J. Atmos. Sci., 27, 463–473, 1970.
Takahashi, T.: Riming electrification as a charge generation mechanism in thunderstorms, J. Atmos. Sci., 35, 1536–1548, 1978.
15
Takahashi, T., Endoh, T., Wakahama, G., and Fukuta, N.: Vapor diffusional growth of free-falling snow crystals between −3 and −23◦C, J. Meteorol. Soc. Jpn., 69, 15–30, 1991.
Takahashi, T. and Miyawaki, K.: Reexamination of Riming Electrification, J. Atmos. Sci., 59, 1018–1025, 2002.
Tonkonogov, M. P.: Dielectric spectroscopy of hydrogen-bonded crystals, and proton relaxation, 20
Phys.-Uspekhi, 41, 21–48, 1998.
Vonnegut, B.: Orientation of ice crystals in the electric field of a thunderstorm, Weather, 20, 310–312, 1965.
Williams, E. R., Zhang, R., and Rydock, J.: Mixed-phase microphysics and cloud electrification, J. Atmos. Sci., 48, 2195–2203, 1991.
25
Workman, E. J. and Reynolds, S. E.: Electrical Phenomena Occurring during the Freezing of Dilute Aqueous Solutions and Their Possible Relationship to Thunderstorm Electricity, Phys. Rev., 78, 254–259, 1950.
ACPD
3, 41–73, 2003Charging of ice-vapor interfaces
J. Nelson and M. Baker
Title Page Abstract Introduction Conclusions References Tables Figures J I J I Back Close Full Screen / Esc
Print Version Interactive Discussion
c
EGU 2003 Table 1. (a) Relevant electrical properties of ice
# Experimentally established property 1 High static dielectric constanta. 2 Thermoelectric effectb.
3 High surface dc conductivity in equilibriumc.
4 Nonzero field E and interior charge separation Q over entire crystal during growthd. 5 Both E and Q greater during growth than in equilibriume.
6 Surface potential insensitive to vapor growth or sublimationf. 7 Surface dc conductivity increases during sublimationc.
a
= See Petrenko and Whitworth (1999) chapter 4 and references therein.
b= Jaccard (1964) c= Maeno (1973) d
= Inferred from the frost growth experiments of Rydock and Williams (1991), Dong and Hallett (1992), and Latham (1963). E positive points from surface to crystal center, which would result from Q > 0 at surface and Q < 0 in interior. These experiments indicate an excess of OH− at the surface for growing frost and an excess of H+at the surface during sublimation.
e
= Based on Williams et al.’s (1991) interpretation of Latham’s (1963) experiments.
f
ACPD
3, 41–73, 2003Charging of ice-vapor interfaces
J. Nelson and M. Baker
Title Page Abstract Introduction Conclusions References Tables Figures J I J I Back Close Full Screen / Esc
Print Version Interactive Discussion
c
EGU 2003 Table 1. (b) Relations of charge transfer to graupel∆Q from laboratory experiments
# Observed relation explained by the model
1 ∆Q mostly independent of physical properties of the flatter surfacea. 2 ∆Q ∝ Ua.
3 Variable∆Q under same conditions; ∆Q < 0 even occurs in ∆Q > 0 regimea. 4 ∆Q ∝ Dmwith m=2 for spheresa, m< 1 for vapor-grown iceb.
5 ∆Q peaks near T = −15◦C for vapor-grown crystalsc.
6 In equilibrium,∆Q smaller for vapor-grown ice crystals than for spheresd. 7 ∆Q > 0 when vapor-grown ice crystals are sublimatinge.
8 For T < −10◦C,∆Q < 0 regime for ρl ≈ 0.3 − 3 g m
−3
,∆Q > 0 regime at other ρl c
. 9 ∆Q increases for ice doped with NH3, but reverses sign with HF dopingf.
Based on experiments with ice spheres (rtp= Rcr = D/2) and vapor-grown ice (rtp << Rcr <
D/2) impacting graupel. D is the maximum crystal dimension, U is the impact speed, and T is
the ambient temperature. In 5 and 8, the experimental clouds had cloud liquid water of density
ρl; in all others, ρl ∼ 0.
a= Based on GI (relations 1, 2, 3, 4) and Marshall et al. (1978) (relations 1, 2, 3) for ∆Q < 0
regime and data in Illingworth and Caranti (1985) (relation 1).
b
= Keith and Saunders (1990)
c
= Takahashi (1978) (relations 5 and 8) and Berdeklis and List (2001) (relation 5)
d= Compare data in GI to reports of almost no charging when only vapor-grown crystals strike
graupel (i.e. ρl≈ 0 so v = 0 in Takahashi, 1978 and Baker et al., 1987) e= Saunders et al. (2001)
f
= Buser and Aufdermaur (1977)
ACPD
3, 41–73, 2003Charging of ice-vapor interfaces
J. Nelson and M. Baker
Title Page Abstract Introduction Conclusions References Tables Figures J I J I Back Close Full Screen / Esc
Print Version Interactive Discussion
c
EGU 2003 Table 2. Collision speed U [m s−1] above which pressure melting can occur in ice crystal
collisions T [◦C] −5 −10 −15 −20 −25 Rcr/rtp collision type 1 ice sphere-graupel 4.9 × 10⁻² 2.5 × 10⁻¹ 5.9 × 10⁻¹ 1.0 1.6 10 snow-graupel 1.6 × 10⁻³ 7.8 × 10⁻³ 1.9 × 10⁻² 3.3 × 10⁻² 5.0 × 10⁻² 10 snow-snow 2.2 × 10⁻³ 1.1 × 10⁻² 2.6 × 10⁻² 4.7 × 10⁻² 7.0 × 10⁻² 10 snow-metal 3.9 × 10⁻⁴ 1.9 × 10⁻³ 4.6 × 10⁻³ 8.3 × 10⁻³ 1.2 × 10⁻² 10 snow-rubber 2.4 × 10⁴ 1.2 × 10⁵ 2.9 × 10⁵ 5.2 × 10⁵ 7.8 × 10⁵ Values from Eqs. (5) and (6). Graupel refers to a flat ice surface. The snow-snow collision is for tip-to-center collisions between two ice crystals of the same mass and follows by replacing Rcr3
with 0.5 Rcr3 in Eq. (5). The bottom two rows apply to snow crystals striking large, flat surfaces
of the listed material; metal refers to any material with Young’s modulus greatly exceeding that of ice (9.33 GPa), and the estimates for rubber assumed a Young’s modulus of 1 MPa.
ACPD
3, 41–73, 2003Charging of ice-vapor interfaces
J. Nelson and M. Baker
Title Page Abstract Introduction Conclusions References Tables Figures J I J I Back Close Full Screen / Esc
Print Version Interactive Discussion c EGU 2003 D+ f e d c b a 6 5 4 3 2 1 H3O+ L -OH-
H atom after move H atom before move Fixed H atom Fixed O atom polarization before move polarization after move +qB -qB
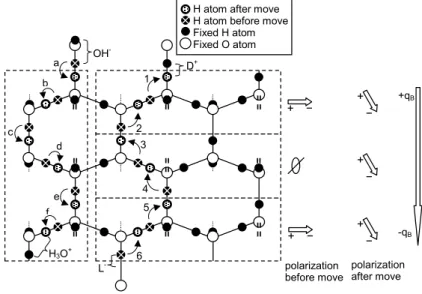
Fig. 1. Creation of a D+and L−defect by the rotation of an H2O molecule and the subsequent downward migration of the L− along a prism plane of ice (3 stacked boxes on right). Before step 1, H atoms in the positions of the solid black circles produce net dipole moments that are neither up nor down in all three boxes as shown to the right (e.g. compare H atoms above and below a horizontal line in the middle of a box; the middle box has no dipole moment but the others point to the right). After step 1, the top bond has a D+defect (2 H atoms) and the bond below and left has an L−defect (no H atoms). Step 2 moves an H to the empty bond created by step 1 thus moving the L− defect down. After 6 such moves, the only L− is at the bottom, the only D+ is at the top, and all three boxes now have net polarization pointing down. Thus, the ice effectively has net positive charge on top (qB = 0.38e) and negative charge on bottom;
this holds even if, as theory predicts, the 2 H atoms in a D+ defect are not collinear. Indeed, the middle and lower boxes would be polarized even if the D+ was not present. Similarly, the vertical box on the left shows the creation of an OH−and H3O+by the shift of an H-atom along
a hydrogen bond (step a) and the subsequent downward migration of H3O+ in b–f. 68
ACPD
3, 41–73, 2003Charging of ice-vapor interfaces
J. Nelson and M. Baker
Title Page Abstract Introduction Conclusions References Tables Figures J I J I Back Close Full Screen / Esc
Print Version Interactive Discussion c EGU 2003 OH -D+ H3O+ L -D+ OH -E E -Q -Q +Q +Q v H3O+ L- v OH -H3O+ L- OH
-Fig. 2. Regions of concentrated charge without growth or sublimation (left) and during growth
at speed v (right). In “equilibrium”, the interior L−and H3O+ charges are very near the surface (left; only charges on top surface shown), whereas they build-up near the crystal center during growth (right). Growth also increases surface D+and OH−as described in the text.
ACPD
3, 41–73, 2003Charging of ice-vapor interfaces
J. Nelson and M. Baker
Title Page Abstract Introduction Conclusions References Tables Figures J I J I Back Close Full Screen / Esc
Print Version Interactive Discussion c EGU 2003 d (x′) d (x′+∆x′) d0(x) d (x) v∆t (sweeping in ∆t) ∆t (FB- d (x′)l(x′)/<l>τB) (net recombination in ∆t) x x′+∆x′ x′ surface
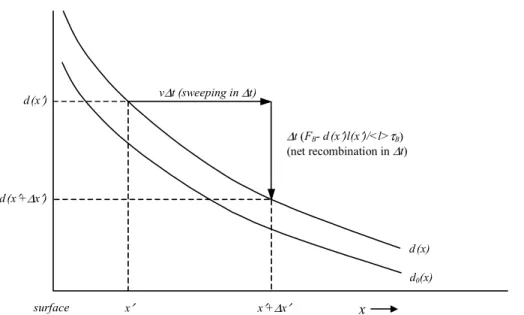
Fig. 3. The balance between the sweeping flux and creation-recombination determines the
perturbed D+ concentration d (x) near the surface. In time∆t growth adds a layer of thickness
v∆t, thus effectively sweeping charge d(x0) at point x0a distance∆x0= v∆t from the surface. In this time, net recombination removes an amount∆t (FB− d (x
0
)l (x0)/ < l > τB).