HAL Id: hal-01971924
https://hal.archives-ouvertes.fr/hal-01971924
Submitted on 7 Jan 2019HAL is a multi-disciplinary open access archive for the deposit and dissemination of sci-entific research documents, whether they are pub-lished or not. The documents may come from teaching and research institutions in France or abroad, or from public or private research centers.
L’archive ouverte pluridisciplinaire HAL, est destinée au dépôt et à la diffusion de documents scientifiques de niveau recherche, publiés ou non, émanant des établissements d’enseignement et de recherche français ou étrangers, des laboratoires publics ou privés.
Crystallography of Growth Blocks in Spheroidal
Graphite
Etienne Brodu, Emmanuel Bouzy, Jean-Jacques Fundenberger, Benoit
Beausir, Lydia Laffont, Jacques Lacaze
To cite this version:
Etienne Brodu, Emmanuel Bouzy, Jean-Jacques Fundenberger, Benoit Beausir, Lydia Laffont, et al.. Crystallography of Growth Blocks in Spheroidal Graphite. Materials Science Forum, Trans Tech Publications Inc., 2018, 925, pp.54-61. �10.4028/www.scientific.net/MSF.925.54�. �hal-01971924�
OATAO is an open access repository that collects the work of Toulouse researchers and makes it freely available over the web where possible
Any correspondence concerning this service should be sent
to the repository administrator: [email protected]
This is an author’s version published in: http://oatao.univ-toulouse.fr/21395
To cite this version:
Brodu, Etienne and Bouzy, Emmanuel and Fundenberger, Jean-Jacques and Beausir, Benoit and Laffont, Lydia and Lacaze, Jacques Crystallography of Growth Blocks in Spheroidal Graphite. (2018) Materials Science Forum, 925. 54-61. ISSN 1662-9752
Crystallography of Growth Blocks in Spheroidal Graphite
Etienne Brodu
1,a, Emmanuel Bouzy
1,b, Jean-Jacques Fundenberger
1,c,
Benoit Beausir
1,d, Lydia Laffont
2,e, Jacques Lacaze
2,f,*1LEM3, Université de Lorraine, Metz, France 2CIRIMAT, Université de Toulouse, Toulouse, France
a[email protected], b[email protected], c[email protected], d[email protected],
e[email protected], f[email protected]
Keywords: spheroidal graphite, cast iron, crystallinity, transmission electron microscopy, transmission Kikuchi diffraction (TKD)
Abstract. A better understanding of spheroidal graphite growth is expected in a near future thanks
to widespread use of transmission electron microscopy. However, common transmission electron microscopy is quite time consuming and new indexing techniques are being developed, among them is transmission Kikuchi diffraction in a scanning electron microscope, a recent technique derived from electron backscatter diffraction. In the present work, on-axis transmission Kikuchi diffraction in scanning electron microscope, completed by transmission electron microscopy, was used with the objective of producing new observations on the microstructure of spheroidal graphite. This study shows that disorientations between blocks and sectors in spheroidal graphite are quite large in the early growth stage, which may be indicative of a competition process selecting the best orientations for achieving radial growth along the c direction of graphite.
Introduction
The growth mechanism of graphite in spheroidal graphite cast irons is still controversial more than 70 years after the discovery that minute addition of magnesium changes the usual lamellar shape of graphite to a nodular one. In the 1970’s, transmission electron microscopy (TEM) has been used to characterize defects in lamellar graphite in relation to growth mechanisms [1]. This is not until the 1980’s that the first attempt was carried out on spheroidal graphite which suggested that spheroidal growth proceeds by continuous spreading of a layer at the outer surface of the spheroids [2]. This layer should continuously bend so that the c direction remains parallel to the spheroid radius in any location inside the nodule in agreement with a previously proposed growth model [3]. However, such a model could not account for the well-known fact that spheroidal graphite consists in sectors radiating from the centre which present significant disorientations between each other. In the 1990’s, independent TEM studies confirmed the existence of disoriented sectors [4,5] and reported that blocks of highly crystalline graphite are stacked on each other from the nodule centre to the periphery of the sectors. These observations were considered [4] as a proof that spheroidal graphite forms by a screw dislocation or spiral growth mechanism [6-8].
However, work undergone in the 2010's showed that the blocks stack upon each other may be unevenly tilted around their c axis which leads to disregard screw- and spiral-like mechanism [9,10]. Qing et al. [11] also observed graphite blocks with well-defined c orientation on a large nodule taken out from a sample that had been quenched at intermediate solidification stage. They reported the presence of numerous point defects in such blocks but did not observe any long range structure that would support a screw or spiral-like growth mechanism of these blocks. These recent works led suggesting growth proceeds by continuous nucleation of new graphite layers and their lateral spreading along the surface [12] and this has been adopted by Li et al. from their observation of spheroidal graphite growth during high temperature graphitization of a steel [13]. A model for such a growth has recently been proposed [14].
In order to deepen our understanding of spheroidal graphite growth, new observations were performed by TEM and by a very novel technique in the scanning electron microscope (SEM), called on-axis transmission Kikuchi diffraction (on-axis TKD) [15]. On-axis TKD followed the first development of TKD by Keller and Geiss [16], its peculiarity being that the detector is centred horizontally under the thin foil (i.e. perpendicular to the electron beam) while the detector is vertical in the initial TKD configuration as it is for electron back scattered diffraction (EBSD). TKD (both on-axis and conventional) allows producing orientation maps with a spatial resolution of a few nanometres, which cannot be achieved by EBSD [17,18]. Besides, on-axis TKD is particularly fast; up to a few hundreds of patterns can be automatically recorded and indexed per second [19]. Both TEM and on-axis TKD have been applied in the present study with the objective of characterizing disorientations inside and between growth blocks of a graphite spheroid.
Experimental Details
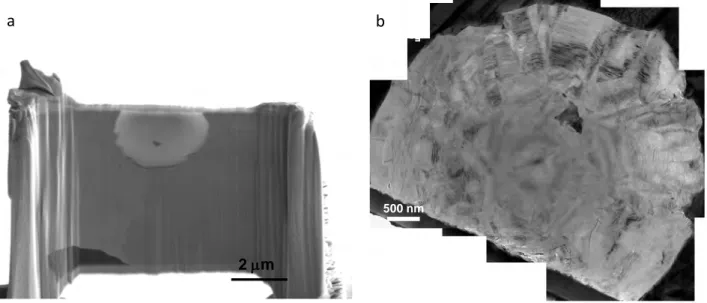
This study deals with a thin-wall cast iron that solidified partly in the stable system (graphite is the carbon-rich phase) and partly in the metastable one (cementite is the carbon-rich phase). In such a mottled structure, growth of graphite nodules is stopped at early stage. The melt has been spheroidized with magnesium and its final composition consisted in 3.77 wt.% C, 0.219 wt.% Mn and 1.9 wt.% Si, balance Fe. On a section of the as-cast material, a thin foil specimen containing a diametrical section of a spheroid, was obtained using focused ion beam (FIB) – lift out technique in a JEOL FIB-4600F scanning electron microscope (Fig. 1a). For avoiding damage of the foil, the last milling step was performed at a beam tension of 2 keV and a beam current of 15 pA for a minute, followed by one more minute at 2 keV and 39 pA.
A JEOL JEM-2100F transmission electron microscope, operated at 200 kV, was used for imaging the sample. As stressed in previous studies [20,21], a low dose beam is used to avoid irradiation damage of graphite. In order to investigate the structure of the graphite nodule, diffraction patterns were obtained using the selected area electron diffraction (SAED) mode or by Fourier transform of the HRTEM (High Resolution TEM) images. Then, a Zeiss Supra40 operated at 30 keV was used to produce orientation maps of the nodule by on-axis TKD which has much to do with low voltage TEM (10-30 keV) while being carried out in a SEM. With on-axis TKD, Kikuchi patterns are produced in transmission and then indexed to deduce the crystal orientation. Additional information is provided in the results section.
Figure 1 – SEM image of a diametrical section of a graphite nodule obtained by FIB (a) and
photomontage of bright field images showing an overview of the sample (b). 2 µm
b
500 nm
Results
TEM. Fig. 1b is a photomontage of bright field images presenting an overview of the sample
microstructure. The inner zone of the nodule – about 1.5 µm in diameter - shows highly disoriented graphite layers and is discussed elsewhere [22]. Such a deformation was evidenced by the oblong shape of the SAED patterns recorded in this area. This inner zone will not be considered any further in the present work.
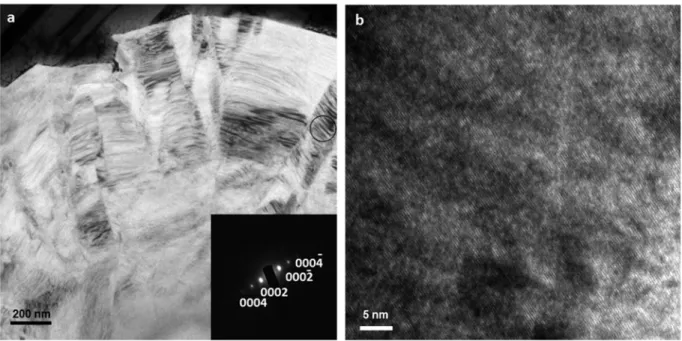
Fig. 2-a shows an enlargement of Fig. 1-b where it is seen that the outer zone of the nodule is alike usual observations, with graphite consisting in radial sectors made up of block units with the 0002 direction of graphite nearly parallel to the nodule radius as shown with the SAED pattern (insert in Fig. 2-a) of the marked area (solid circle).
A HRTEM lattice fringe image of the same area as that of the SAED pattern (Fig 2-b) consists of relatively straight fringes which are characteristic of highly graphitic materials in agreement with the well-defined spots of the SAED pattern. Qing et al. have shown that evenly distributed point defects are observed in such blocks [11] which may account for the apparent small irregularities in the graphite stacking.
Figure 2 – Enlargement of the image of the periphery of the nodule seen in Fig. 1-b, with in insert
the SAED pattern corresponding to the dark circle (a) and HRTEM image in the area of the solid circle showing well stacked graphene layers (b).
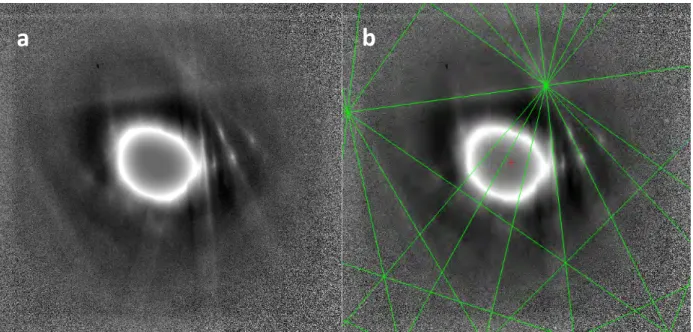
TKD. Fig. 3-a shows a typical diffraction pattern obtained by transmission Kikuchi diffraction
(TKD) on the same graphite spheroid as for TEM observations. It is seen that the diffraction pattern is poorly contrasted, rather blurred and with only few visible bands making them challenging to index, both by the software and manually. The reason for the poor quality of the patterns is unknown but it definitely results in a low indexation rate on orientation maps.
Then, diffraction patterns were indexed with the software ESPRIT 2.0 by Bruker, which was initially developed for EBSD. This software looks specifically for bright bands in the Hough transform, which are typical of EBSD patterns. The band contrast in on-axis TKD patterns is different from EBSD: depending on the sample thickness and incident energy, the band contrast in TKD is either bright or dark [23]. In the present case, the band contrast is very ambiguous, as seen in Fig. 3-a, and the software tends to mix up bright Kikuchi lines with Kikuchi bands, resulting in an error on the determination of the orientation. One can see in Fig. 3-b that the solution is shifted by a few degrees as the green lines should have been located along the centre of the bands. The uncertainty is evaluated to about ±2.5°.
Figure 3 – Typical diffraction pattern obtained on spheroidal graphite with on-axis TKD (a) and
indexation result with the software ESPRIT 2 (b). Parameters: accelerating voltage E = 30 keV, distance detector-sample DD = 24 mm, working distance WD = 5.3 mm, aperture 60 µm - high current mode (about 2 nA), pattern resolution 600 × 600 pixels. Acquisition time: 30 ms × 3 images (90 ms total per pattern).
Although not fully satisfying as described in relation with Fig. 3, indexation could produce orientation results. Fig. 4 presents quality index maps produced by TKD with a step size of 20 nm for the whole nodule section (Fig. 4-a) and 10 nm for the marked area (Fig. 4-b). These quality maps display a grey-scale contrast function of the quality of the patterns: diffraction patterns with well-defined and contrasted Kikuchi bands appear light-grey in the quality maps, while patterns with blurred, low contrasted bands appear dark-grey or even black. Typically, patterns produced at or near a high angle boundary joint are blurred by overlapping of several orientations, resulting in black pixels in the quality map. Thus, quality maps produce a first view of the microstructure via the delimitation of disoriented domains (i.e. grains or growth blocks). In particular, the radial separation of blocks and sectors is evidenced, as well as many changes in orientation along the radius of the nodule. Note also that the central part of the nodule appearing black in the quality map is consistent with the highly disoriented structure previously evidenced with TEM and mentioned above.
Figure 4 – Quality pattern maps produced by on-axis TKD on the spheroidal graphite nodule seen
in Fig. 1: whole view of the nodule section with a step size of 20 nm (a) and focus on the marked area with a step size of 10 nm (b).
a
b
The left column of Fig. 5 shows inverse pole figures along the X and Y directions (IPFX and IPFY respectively) superimposed on the quality pattern map of Fig. 4-b. Further, the right column in Fig. 5 shows pole figures of the same area for the (100) and (001) axes of the hexagonal lattice. The colour code in the (100) and (001) pole figures corresponds to the code in the IPFX map. In addition, symbols (triangles, squares...) are inserted in order to visualize unambiguously in the two pole figures the location of the blocks seen in the IPF maps. First, in the (001) pole figure, it is clearly seen that the c axis of the hexagonal graphite structure lies within - or nearly so - the (0XY) plan of the foil. Then, rotation of the c axis around the Z direction (i.e. the direction perpendicular to the (0XY) plan of the foil) is imaged with the dash blue arrow. This way, the c axis appears to remain close to the radial direction of the spheroid. It is seen in following the dashed blue arrow that the rotation of the c axis of the blocks around Z is relatively monotonous except for three blocks marked with a cross symbol (white cross with black contour, white cross with red contour and red cross with black contour) that rotate in the opposite direction. It is difficult however to give any definitive meaning to this observation as the c axis of some of the blocks may be slightly out of the observation plan.
Figure 5 – Left column: IPF orientation maps over the quality pattern map of Fig. 4-b and; right
column: pole figure of the same area for the (100) and (001) c axis of the hexagonal lattice. The colour code of the dots on the pole figures corresponds to the domains visible on the IPFX.
The disorientations between neighbouring blocks have been indicated in the IPFX and IPFY maps with solid lines with a colour depending on the disorientation angle. Although orientation relationships between blocks are affected by the error mentioned above and cannot be determined
with accuracy better than a few degrees, it is seen that the disorientations can be up to 40°. Such large values have already been reported for boundaries between neighbouring sectors though the values are most often in the range 10-30° [24,25].
The nearly radial dotted and dashed lines in the IPFX identify paths through blocks stacked on top of one another in the radial direction. When looking at the (001) pole figure, the poles corresponding to such blocks are superimposed, which means that they share the same c axis. In addition, as we can see on the (100) pole figure by following the dotted and dashed lines, these blocks are related by a rotation around the c axis. The disorientation associated to this rotation goes up to 25°, although again these values may be biased by systematic errors in the determination of the orientation of each block. These values appear larger than previously reported disorientations between blocks from a given sector [26]. As the observed nodule is very small because of being in its early growth stage, these large disorientations may be indicative of a competition process: if the nodules had been left to grow to larger size, the best oriented blocks would have given rise to well-developed sectors. On the other hand, the thickness of the blocks in the radial direction is well in line with values reported by Miao et al. [4] and Qing et al. [11].
Examining now the disorientation between blocks along the tangential direction (i.e. blocks belonging to the same circle around the centre of the spheroid), it appears that most of them have the same disorientation around the c axis. Indeed, as we can see on the (100) pole figure, most of the (100) poles of the blocks along the tangential direction are superimposed near the Z direction. Following the blue circle, it is thus realized that there is little rotation of the graphite crystallographic structure around its c axis. This suggests that neighbouring blocks formed while developing some strong relationships between each other. More or less complex twin relations such as those investigated by Qing et al. [11] may be put forward here. This somehow confirms that every block seen in Fig. 4 may be considered as individual sector because such twin boundaries have not been observed within well-developed sectors.
Finally, inside a given block, the error induced by the software tends to remain constant which means that the disorientation of the crystal inside a given block can be discussed. However, few blocks present low enough indexation noise to allow discussing such small disorientations and even fewer for the determination of the disorientation axis. Fig. 6 shows the result for a particular block for which this analysis was possible. One can see small but significant disorientations in the radial direction while there is seemingly no disorientation in the tangential direction. Along the radial direction, the cumulative disorientation increases monotonously with the distance to the nodule centre, amounting to 2.5° over a distance of 600 nm (fig. 6) in excellent agreement with values previously estimated by automatic crystal orientation mapping in a TEM [26]. Besides, this disorientation in the radial direction happens by rotation of the hexagonal crystal around its c-axis. Unfortunately, the angular resolution that could be achieved with graphite does not allow concluding on the existence of a sub-structure inside the blocks that could be related to this disorientation.
Summary
The structure of a graphite nodule in its early growth stage has been found to consist of blocks with their c axis nearly parallel to the nodule radius. This study shows that disorientations between blocks are quite large when compared to previous results on large and fully developed nodules where blocks are arranged within sectors. In the area that was investigated, crystallographic relationship was evidenced between neighbouring blocks which suggests each block is a potential precursor of a sector.
Within individual block, on axis TKD shows that there are disorientations in the radial direction while there is no disorientation in the tangential direction. These disorientations increase monotonously, though remaining very small, which supports the idea they are not associated with any screw dislocation.
Figure 6 – Same quality pattern map as in Fig. 4-b, cumulative disorientation inside a growth
block of the spheroidal graphite nodule, and projection of the disorientation axis along the direction 2 in the crystal coordinate (note that the closer to the reference point, which is in grey, the smaller the disorientation and the more uncertain the disorientation axis).
References
[1] D.D. Double, A. Hellawell, Defects in eutectic flake graphite, Acta Metall. 19 (1971) 1303-1306.
[2] G.R. Purdy, M. Audier, Electron microscopical observations of graphite in cast irons, Mat. Res. Soc. Symp. Proc. 34 (1985) 13-23.
[3] J.P. Sadocha, J.E. Gruzleski, The mechanism of graphite spheroid formation in pure Fe-C-Si alloys, The metallurgy of cast iron, Georgi Pub., 1975, pp. 423-459
[4] B. Miao, D.O. Northwood, W. Bian, K. Fang, M.H. Fan, Structure and growth of platelets in graphite spherulites in cast iron, J. Mater. Sci. 29 (1994) 255-261.
[5] J.P. Monchoux, C. Verdu, G. Thollet, R. Fougères, A. Reynaud, Morphological changes of graphite spheroids during heat treatment of ductile cast irons, Acta mater. 49 (2001) 4355-4362. [6] M. Hillert, Y. Lindblom, The growth of nodular graphite, J. Iron Steel Inst. 148 (1954) 388-390. [7] D.D. Double, A. Hellawell, cone-helix growth forms of graphite, Acta Metall. 22 (1974) 481-487.
[8] D.D. Double, A. Hellawell, The nucleation and growth of graphite. The modification of cast iron, Acta metall. Mater. 43 (1995) 2435-2442.
[9] K. Theuwissen, M.C. Lafont, L. Laffont, B. Viguier, J. Lacaze, Microstructural characterization of graphite spheroids in ductile iron, Trans. Indian Inst. Met. 65 (2012) 627-631.
[10] K. Theuwissen, J. Lacaze, L. Laffont, Structure of graphite precipitates in cast iron, Carbon 96 (2016) 1120-1128.
[11] J. Qing, V.L. Richards, D.C Van Aken, Growth stages and hexagonal-rhombohedral structural arrangements in spheroidal graphite observed in ductile iron, Carbon 116 (2017) 456-469.
[12] R. Ghergu, L. Magnusson Åberg, J. Lacaze, A possible mechanism for the formation of exploded graphite in nodular cast irons, Mater. Sci. For. 790-791 (2014) 435-440.
[13] D. Li, R. Tan, J. Gao, B. Wei, Z. Fan, Q. Huang, K. He, Comparison of pyrolytic graphite spheres from propylene with spheroidal graphite nodules in steel, Carbon 111 (2017) 428-438. [14] J. Lacaze, J. Bourdie, M.J. Castro Roman, A 2-D nucleation-growth model of spheroidal graphite, Acta mater. 134 (2017) 230-235.
[15] J.J. Fundenberger, E. Bouzy, D. Goran, J. Guyon, H. Yuan, A. Morawiec,Orientation mapping by transmission-SEM with an on-axis detector, Ultramicroscopy 161 (2016) 17-22.
[16] R. R. Keller, R. H. Geiss, Transmission EBSD from 10 nm domains in a scanning electron microscope, Journal of Microscopy 245 (2012) 245-251
[17] W. Trimby, Orientation mapping of nanostructured materials using transmission Kikuchi diffraction in the scanning electron microscope, Ultramicroscopy 12 (2012) 16-24.
[18] E. Brodu, E. Bouzy, J.-J. Fundenberger, J. Guyon, A. Guitton, Y. Zhang, On-axis TKD for orientation mapping of nanocrystalline materials in SEM, Materials Characterization 130 (2017) 92-96
[19] H. Yuan, E. Brodu, C. Chen, E. Bouzy, J-J. Fundenberger, L.S. Toth, On-Axis Versus off-Axis Transmission Kikuchi Diffraction Technique: Application to the Characterization of Severe Plastic Deformation Induced Ultrafine Grained Microstructures, Journal of Microscopy 267 (2017) 70-80 [20] R.F. Egerton, Mechanisms of radiation damage in beam-sensitive specimens, for TEM accelerating voltages between 10 and 300 kV, Micro. Res. Tech. 75 (2012) 1550-1556.
[21] J. Reyes-Gasga, R. Garcia-Garcia, Analysis of the electron-beam radiation damage of TEM samples in the acceleration energy range from 0.1 to 2MeV using the standard theory for fast electrons, Rad. Phys. & Chem. 64 (2002) 359–367.
[22] R. Jday, L. Laffont, J. Lacaze, An electron microscopy study of graphite growth in nodular cast irons, submitted for publication
[23] E. Brodu, E. Bouzy, J-J. Fundenberger, Diffraction contrast dependence on sample thickness and incident energy in on-axis Transmission Kikuchi Diffraction in SEM, Ultramicroscopy 181 (2017) 123-133
[24] Miao B, Fang K, Bian W, Liu G. On the microstructure of graphite spherulites in cast irons by TEM and HREM,Acta Metall. Mater. 38 (1990) 2167–2174.
[25] K. Theuwissen, J. Lacaze, M. Véron, L. Laffont, Nano-scale orientation mapping of graphite in cast irons, Mater. Charac. 95 (2014) 187-191.
[26] K. Theuwissen, Etude de l'influence des impuretés et des éléments à l'état de traces sur les mécanismes de croissance du graphite dans les fontes, PhD thesis, INPT, Toulouse, 2013, http://ethesis.inp-toulouse.fr/archive/00002393/