HAL Id: inserm-00410224
https://www.hal.inserm.fr/inserm-00410224
Submitted on 18 Aug 2009
HAL is a multi-disciplinary open access
archive for the deposit and dissemination of
sci-entific research documents, whether they are
pub-lished or not. The documents may come from
teaching and research institutions in France or
abroad, or from public or private research centers.
L’archive ouverte pluridisciplinaire HAL, est
destinée au dépôt et à la diffusion de documents
scientifiques de niveau recherche, publiés ou non,
émanant des établissements d’enseignement et de
recherche français ou étrangers, des laboratoires
publics ou privés.
Maternal personal exposure to airborne benzene and
intrauterine growth.
Rémy Slama, Olivier Thiebaugeorges, Valérie Goua, Lucette Aussel, Paolo
Sacco, Aline Bohet, Anne Forhan, Béatrice Ducot, Isabella Annesi-Maesano,
Joachim Heinrich, et al.
To cite this version:
Rémy Slama, Olivier Thiebaugeorges, Valérie Goua, Lucette Aussel, Paolo Sacco, et al.. Maternal
per-sonal exposure to airborne benzene and intrauterine growth.. Environmental Health Perspectives,
Na-tional Institute of Environmental Health Sciences, 2009, 117 (8), pp.1313-21. �10.1289/ehp.0800465�.
�inserm-00410224�
Maternal exposure to air pollutants, and possibly traffic-related air pollutants dur-ing pregnancy, may influence fetal growth (Jedrychowski et al. 2004; Parker et al. 2005; Ritz and Wilhelm 2008; Slama et al. 2008a; Wilhelm and Ritz 2003). Traffic-related air pollution is a mixture of thousands of com-pounds present in gaseous form or as particulate matter (PM). These include aromatic hydrocar-bons (e.g., benzene, polycyclic aromatic hydro-carbons), nonaromatic hydrocarbons (e.g., alkanes, olefins), metals, and inorganic gases such as nitrogen oxides and carbon monox-ide (Krzyzanowski et al. 2005; Schauer et al. 1999, 2002). Most studies have focused on carbon monoxide (Ritz and Yu 1999), nitro-gen dioxide, PM (Jedrychowski et al. 2004; Parker et al. 2005), and polycyclic aromatic hydrocarbons (Perera et al. 2005). With a few exceptions (e.g., Choi et al. 2006; Jedrychowski et al. 2004), exposure estimates were based on environmental models of outdoor air pollution levels close to the home address. These do not take into account the fact that outdoor levels of
specific pollutants do not always reflect indoor levels, exposure in the workplace, and, impor-tantly, levels in transit, which corresponds to a significant proportion of total personal expo-sure (Bruinen de Bruin et al. 2008; Ilgen et al. 2001b; Jo and Park 1999; Zhu et al. 2007). Therefore, studies relying on a personal expo-sure assessment are warranted.
For a few traffic-related air pollutants, animal experiments have reported effects of maternal exposure on fetal growth (Rocha et al. 2008). In rodents, airborne benzene expo-sure during pregnancy induces a reduction in fetal weight [Agency for Toxic Substances and Disease Registry (ATSDR) 2007]. In humans, studies of associations between benzene levels and pregnancy outcome have been conducted only in occupational settings (Chen et al. 2000; Wang et al. 2000), where benzene exposure is probably correlated with other chemicals than in the general population. Because of its anti knocking properties, benzene is used as an additive in gasoline; its presence in the atmo-sphere is attributable to industrial emissions
and, predominantly, to motor vehicle traffic and combustion processes. Overall, the main sources of exposure in the general population are tobacco smoke, traffic, and other combus-tion processes (ATSDR 2007; Wallace 1996). For these reasons, benzene monitoring is a rel-evant candidate as a proxy measure of exposure to air pollutants related to traffic and to gasoline uses (Aguilera et al. 2008); moreover, it can be assessed by passive air samplers, which are light and relatively simple (Cocheo et al. 2000).
In studies on effects of air pollutants, fetal growth has most often been assessed by meas ures of birth weight, taking into account gestational duration (Glinianaia et al. 2004; Lacasana et al. 2005; Ritz and Wilhelm 2008; Slama et al. 2008a). One study reported a
Address correspondence to R. Slama, INSERM, Team “Environmental Epidemiology Applied to Fertility and Human Reproduction,” U823, Institut Albert Bonniot, BP 170, La Tronche, F-38042 Grenoble CEDEX 9, France. Telephone: 33-476-54-94-02. Fax: 33-476-54-94-14. E-mail: remy.slama@ujf-grenoble.fr
Supplemental Material is available online (doi:10.1289/ehp.0800465.S1 via http://dx.doi.org/). We are indebted to the midwife research assistants (L. Douhaud, S. Bedel, B. Lortholary, S. Gabriel, M. Rogeon, and M. Malinbaum) for data collection and to P. Lavoine for checking, coding, and data entry. We thank N. Job-Spira, P. Ducimetière, S. Bottagisi, and J. Lepeule; and P. Mura and Y. Papet for the assessment of cotinine levels.
The study was funded by a grant from AFSSET (French agency for environmental and occupational health safety). We acknowledge all the funding sources for the EDEN mother–child cohort: Fondation pour la Recherche Médicale, French Ministry of Research (IFR program), Institut national de la santé et de la recherche médicale Nutrition Research Program, French Ministry of Health, AFFSET, French National Institute for Population Health Surveillance, University Paris–Sud, French National Institute for Health Education, Nestlé, Mutuelle Générale de l’Education Nationale, French-speaking association for the study of diabetes and metabolism (Alfediam), and National Agency for Research.
The funding sources had no role in the study design, collection, or interpretation of data, in the writing of the report, or in the decision to submit the paper for publication.
The authors declare they have no competing financial interests.
Received 9 December 2008; accepted 1 April 2009.
Maternal Personal Exposure to Airborne Benzene and Intrauterine Growth
Rémy Slama,1,2 Olivier Thiebaugeorges,3 Valérie Goua,4 Lucette Aussel,5,6 Paolo Sacco,7 Aline Bohet,5,6
Anne Forhan,8 Béatrice Ducot,5,6 Isabella Annesi-Maesano,9,10 Joachim Heinrich,11 Guillaume Magnin,4
Michel Schweitzer,3 Monique Kaminski,10,12 Marie-Aline Charles,8 and the EDEN Mother–Child Cohort Study Group
1Inserm, Institut national de la santé et de la recherché médicale, University J Fourier Grenoble, Avenir Team “Environmental
Epidemiology Applied to Fecundity and Reproduction,” U823, Institut Albert Bonniot, Grenoble, France; 2University J. Fourier Grenoble,
Grenoble, France; 3Service de Gynécologie-Obstétrique, Maternité de Nancy, France; 4Service de Gynécologie-Obstétrique, Centre
Hospitalier Régional de Poitiers, France; 5Institut national de la santé et de la recherche médicale, U822, “Epidémiologie, Démographie
et Sciences Sociales,” Le Kremlin-Bicêtre, France; 6University Paris-Sud, Le Kremlin-Bicêtre, France; 7Fondazione Salvatore Maugeri—
Centro di Ricerche Ambientali, Padova, Italy; 8Institut national de la santé et de la recherche médicale, UMR 780, Villejuif, France; 9Institut national de la santé et de la recherche médicale, EPAR, UMR-S707; 10Faculté de Médecine de Saint-Antoine, UPMC Univ6, Paris,
France; 11Helmholtz Zentrum für Gesundheit und Umwelt, Helmholtz Zentrum München—German Research Center for Environmental
Health, Institute of Epidemiology, Neuherberg, Germany; 12Institut national de la santé et de la recherche médicale, UMRS 953,
Epidemiological research on perinatal health and women’s and children’s health, Villejuif, France
Background: Studies relying on outdoor pollutants measures have reported associations between
air pollutants and birth weight.
oBjective: Our aim was to assess the relation between maternal personal exposure to airborne
ben-zene during pregnancy and fetal growth.
Methods: We recruited pregnant women in two French maternity hospitals in 2005–2006 as part
of the EDEN mother–child cohort. A subsample of 271 nonsmoking women carried a diffusive air sampler for a week during the 27th gestational week, allowing assessment of benzene exposure. We estimated head circumference of the offspring by ultrasound measurements during the second and third trimesters of pregnancy and at birth.
results: Median benzene exposure was 1.8 µg/m3 (5th, 95th percentiles, 0.5, 7.5 µg/m3).
Log-transformed benzene exposure was associated with a gestational age–adjusted decrease of 68 g in mean birth weight [95% confidence interval (CI), –135 to –1 g] and of 1.9 mm in mean head circumference at birth (95% CI, –3.8 to 0.0 mm). It was associated with an adjusted decrease of 1.9 mm in head circumference assessed during the third trimester (95% CI, –4.0 to 0.3 mm) and of 1.5 mm in head circumference assessed at the end of the second trimester of pregnancy (95% CI, –3.1 to 0 mm). conclusions: Our prospective study among pregnant women is one of the first to rely on personal
monitoring of exposure; a limitation is that exposure was assessed during 1 week only. Maternal benzene exposure was associated with decreases in birth weight and head circumference during pregnancy and at birth. This association could be attributable to benzene and a mixture of associ-ated traffic-relassoci-ated air pollutants.
keywords: atmospheric pollution, benzene, birth weight, cohort, fetal growth, head circumference,
personal monitoring, sensitivity analysis, ultrasonography. Environ Health Perspect 117:1313–1321 (2009). doi:10.1289/ehp.0800465 available via http://dx.doi.org/ [Online 1 April 2009]
Slama et al.
negative association between personal expo-sure to fine PM (aerodynamic diameter ≤ 2.5 µm; PM2.5) and head circumference
(Jedrychowski et al. 2004), and another reported a possible effect of air pollution levels in early pregnancy on fetal ultrasound measurements, including head circumference (Hansen et al. 2008). Ultrasound measures constitute a promising approach to examine how early air pollution effects manifest in fetal growth (Hansen et al. 2008). Studying head size is particularly important, as head size is a marker of fetal growth that may specifically be associated with cognitive development in childhood (Yanney and Marlow 2004).
Our aim was to study, among nonsmok-ing women, the influence of personal expo-sure to benzene in the air, seen as a marker of traffic-related air pollution, on measures of fetal growth (birth weight, head circum-ference, biparietal diameter) assessed during pregnancy by ultrasonography and at birth.
Population and Methods
Study population. This study was conducted
in a subgroup of the EDEN (study of pre- and early postnatal determinants of the child’s development and health) mother–child cohort (Drouillet et al. 2009). The primary aim of the EDEN cohort is the study of prenatal and early postnatal nutritional, environmental, and social determinants of children’s develop-ment and health. Women at < 20 gestational weeks (weeks of amenorrhea) were recruited from the maternity wards of Poitiers and Nancy University hospitals (France) between September 2003 and January 2006. Exclusion criteria were personal history of diabetes, mul-tiple pregnancies, intention to deliver out-side the university hospital or to move out of the study region within the next 3 years, and inability to speak French. We estimated partic-ipation rate among eligible women to be 55%. Supplemental Material, Table 1 (doi:10.1289/ ehp.0800465.S1), compares our cohort with a national sample of women who delivered in 2003 (Blondel et al. 2006). Women were given an appointment with a study midwife, planned to take place between 24 and 28 gestational weeks, during which an interview on behav-ioral factors was conducted and biological sam-ples were collected. For this study, we further restricted the EDEN cohort to nonsmoking women, who were asked by the study midwives to carry a diffusive air sampler for 7 consecutive days. For logistic reasons, this part of the study was offered only to women whose study visit took place after February 2005.
The study was approved by the relevant ethical committees (Comité Consultatif pour la Protection des Personnes dans la Recherche Biomédicale, Le Kremlin-Bicêtre University hospital, and Commission Nationale de l’Informatique et des Libertés), and all
participating women gave informed written consent for themselves and for their child to be part of the study.
Assessment of intrauterine growth. We
assessed birth weight from maternity records. Head circumference was assessed at birth and also during a clinical examination of the newborn performed in duplicate by midwife research assistants within 3 days after birth for 95% of newborns. Our a priori choice was to use the average of these two postnatal measures; in sensitivity analyses, we also report the associ-ation between exposure and the single measure of head circumference at birth. We conducted ultrasound examinations between 29 and 36 gestational weeks (5th, 50th, and 95th per-centiles, 30.7, 32.7, and 34.4 gestational weeks; third-trimester examination), between 19 and 27 gestational weeks (5th, 50th, and 95th percentiles, 20.7, 22.4, and 24.7 weeks; second-trimester examination), and before 15 gestational weeks (5th, 50th, and 95th percen-tiles, 11.2, 12.6, and 14.0 weeks; first-trimester examination). Because of the possible associa-tion between head circumference at birth and cognitive development in childhood (Yanney and Marlow 2004), and because of the avail-ability of both pre- and postnatal measures of head circumference by different approaches, we a priori decided to focus on ultrasound measures of head circumference. In addition to the measurements at birth, we assessed head circumference during the second- and third-trimester (but not first-third-trimester) ultrasound examinations. Therefore, we also report asso-ciations of exposure with biparietal diameter (the widest diameter of the head), which we assessed at the first trimester examination; this was strongly correlated with head circumfer-ence during the second and third trimesters (coefficient of correlation, 0.92 during the sec-ond trimester and 0.80 during the third tri-mester, p < 10–3). Ultrasound measurements
were performed according to Hadlock’s criteria (1994). Before the study start, the first five ultrasound measurements performed by each obstetrician were reviewed by one of us (O.T.). We assessed gestational duration at each exam-ination and at birth from the date of the last menstrual period (LMP) (Slama et al. 2008b). When information on this date was missing or when the LMP-based gestational duration was > 44 gestational weeks, we used the obstetri-cian’s ultrasound-based estimate.
Exposure to benzene. We used a diffusive
air sampler (Radiello, Fondazione Salvatore Maugeri–Centro di Ricerche Ambientali, Padova, Italy) (Cocheo et al. 2000), which relies on radial symmetry diffusion (Cocheo et al. 1996). The cylindrical diffusive body contains a stainless steel net cylindrical car-tridge, filled with activated charcoal. The absorbing cartridge was stored in a capped glass tube before and after the 7-day exposure
period and sent by post to Institut national de la santé et de la recherche médicale (Inserm) by the participating woman after use, together with a questionnaire on the conditions of use. We excluded subjects for whom the diffu-sive part of the sampler was broken during use (n = 4). The charcoal cartridges were then temporarily stored and then shipped to the Maugeri Foundation, where they were stored at 4°C before analysis. Cartridges were shipped together with a bar code identifier and infor-mation on the hours and days of start and end of exposure to ambient air, but no information on pregnancy outcome. We desorbed the col-lected vapors from the cartridge using carbon disulfide solvent with a benzene concentra-tion < 0.1 µg/mL and analyzed the soluconcentra-tion using high-resolution gas chromatography with flame ionization detector. Taking into account the actual number of hours of exposure of the dosimeter, we converted the benzene concen-tration in the solution to a mean concenconcen-tration in the air during the period of exposure. The detection limit for an exposure of 5 days is 0.1 µg/m3 benzene. Women were given
illus-trated instructions and were asked not to touch the diffusive air sampler with their hands, avoid contact with water, carry the air sampler always with them, attaching it on their clothes as close as possible to their collar, and to keep it close to their bed when they slept.
Regression models. We studied the
relation-ship between benzene and birth weight and the relationship between benzene and mea-sures of head size assessed at birth and during the third trimester in distinct linear regression models (Stata SE version 10.1; StataCorp., College Station, TX, USA). We also studied the association between benzene exposure and measures of head size assessed during the first and second trimesters, assuming that benzene levels were indicative of exposure in early preg-nancy. Benzene was considered either as a con-tinuous variable, using the log-transformed values because of the skewed distribution of exposure, or as a variable whose categories cor-responded to exposure tertiles defined on the whole population with an exposure estimate. We performed linear trend tests with a cat-egorical variable whose values corresponded to the category-specific median benzene level.
Additionally, we conducted a longitudinal analysis including all three assessments of head circumference simultaneously, using multiple linear regression with a random effect variable corresponding to the mother–child pair and interaction terms with gestational age. We plot-ted the values of head circumference predicplot-ted by this longitudinal analysis as a function of benzene and gestational age, together with the observed values.
Sensitivity analyses. We repeated the
anal-yses among women who declared that their schedule during the week of use of the air
sampler was similar to that during the previous month (usual schedule group). We also esti-mated the effect of benzene levels adjusting for the ultrasound-based gestational age instead of the LMP-based gestational age (Slama et al. 2008b). To determine whether an associa-tion between benzene and head circumference could be explained by an association between benzene and birth weight, we also estimated the effect of benzene on head circumference after excluding small-for-gestational-age births (10th percentile), using sex- and gestational age–specific references (Mamelle et al. 1996). Finally, we repeated analyses for various sub-groups defined according to the conditions of use of the air sampler.
Potential confounders. We selected
con-founders a priori, excluding all variables possi-bly affected by the health outcome or exposure (Rothman and Greenland 1998). We assessed exposure to passive smoking during the second trimester of pregnancy by a retrospective ques-tion filled in at birth asking whether someone smoked regularly in the presence of the woman, at home, in the workplace, or somewhere else. We also performed urinary cotinine measure-ments. Maternal urine was collected during the study visit at 24–28 gestational weeks and immediately frozen at –80°C. We then thawed a 1-mL aliquot and analyzed it by gas chroma-tography/mass spectrometry. We considered the group of women with a urinary cotinine level > 50 ng/mL (n = 5) to potentially include smokers and excluded them; additionally, we excluded two women who had declared to be nonsmokers during the interview with the midwife but who later declared to have smoked during the third trimester of pregnancy. Mean cotinine levels were 0.8 ng/mL among women who declared not to have been exposed to pas-sive smoking and 2.3 ng/mL among women who declared to have been exposed to sive smoking (p < 0.01). In addition to pas-sive smoking, cotinine levels, and gestational duration at the time of the measurement of fetal size (linear and quadratic terms), we also adjusted for sex of newborn, birth order, maternal height (continuous variable), prepreg-nancy weight [broken stick model with a knot at 60 kg (Slama and Werwatz 2005)], mater-nal age at end of study, and calendar month of conception. We also adjusted for maternal occupational exposure to paints, pesticides (n = 3, based on the questionnaire filled in between 24 and 28 gestational weeks), and center. We further adjusted models for head circumfer-ence at birth for cesarean sections (yes/no) and for the number of days between birth and the assessment of head circumference.
Results
Participants. A total of 2,002 pregnant
women were recruited in the cohort. Among these women, 484 were nonsmoking women
whose clinical examination took place after February 2005, and 304 women (63%) agreed to carry the dosimeter. Benzene levels and one measure of fetal growth were known for 271 women (89% of women who agreed to carry the dosimeter; overall participation rate within the cohort, 56%). Compared with approached nonsmoking women who refused to carry the air sampler or with no exposure estimate, those with an estimated benzene exposure were more often > 25 years of age and nulliparous at inclu-sion and more often declared to be exposed to passive smoking [Supplemental Material, Table 2 (doi:10.1289/ehp.0800465.S1)]. We found no evidence that participants and non-participants differed in terms of offspring birth weight or head circumference at any measure-ment (Student’s mean comparison test, all
p-values > 0.29).
Benzene levels. Participants carried the air
sampler in the 27th week (median) of amen-orrhea for a median duration of 7.0 days (Table 1). All benzene levels exceeded the detection limit, with a mean of 2.6 µg/m3
and a median of 1.8 µg/m3 (5th, 95th
percen-tiles, 0.5, 7.5 µg/m3; range, 0.3–19.4 µg/m3);
26 (10%) and 6 values (2%) were > 5 and 10 µg/m3, respectively. Although we found
no strong evidence of an association between exposure and the main means of transporta-tion when exposure was categorized (Table 2), mean log-transformed exposure was higher for women using a car as the main means of trans-portation, compared with those walking, both before (p = 0.04) and after (p = 0.02) adjust-ment for month of measureadjust-ment, center, and passive smoking. In unadjusted analyses, ben-zene levels tended to increase with gestational duration (p = 0.10).
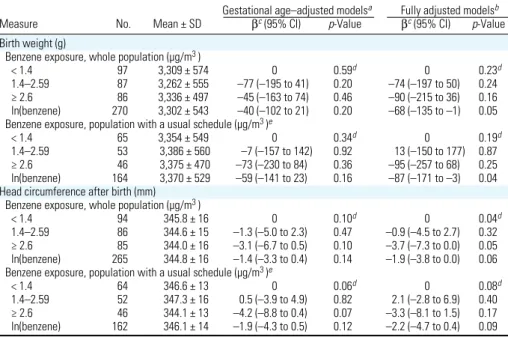
Benzene and birth weight. Median
ges-tational week at delivery was 39.9 (5th, 95th percentiles, 35.6, 41.7 weeks). A benzene level in the highest exposure category was associ-ated with an adjusted decrease in mean birth weight by 90 g [95% confidence interval (CI), –215 to 36 g], compared with the low-est exposure category. Each increase of one
in log-transformed benzene exposure (cor-responding to a multiplication of exposure by 2.72) was associated with an adjusted decrease of 68 g in birth weight (95% CI, –135 to –1 g; Table 3).
Benzene and head circumference assessed
at birth by the midwife. Compared with
obser-vations in the lowest exposure category, expo-sures in the intermediate and highest exposure categories were associated with adjusted decreases in mean head circumference at birth of 0.9 mm (95% CI, –4.5 to 2.7 mm) and 3.7 mm (95% CI, –7.3 to 0.0 mm), respec-tively (linear trend test, p = 0.04; Table 3). Log-transformed exposure showed a similar trend, corresponding to a decrease by 1.9 mm for each increase by one in log-transformed exposure (95% CI, –3.8 to 0.0; Table 3).
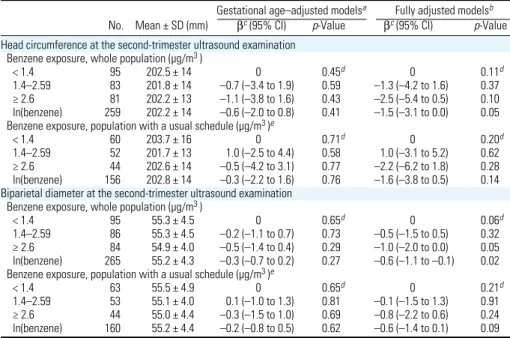
Benzene and ultrasound measurements of
head size. At the third-trimester
ultrasonog-raphy, the adjusted decrease associated with benzene exposure in the highest exposure cat-egory was 4.8 mm for head circumference (95% CI, –8.8 to –0.8 mm, p-value for lin-ear trend across exposure tertiles, 0.02) and 1.3 mm for biparietal diameter (95% CI, –2.6 to 0.1 mm; p-value for linear trend across ter-tiles, 0.02; Table 4). Log-transformed expo-sure showed consistent but statistically weaker associations with head circumference (p = 0.09) and biparietal diameter (p = 0.09).
At the second-trimester ultrasonography, the adjusted decrease in head circumference associated with exposure in the highest cat-egory was 2.5 mm (95% CI, –5.4 to 0.5 mm;
p-value for linear trend across exposure
cat-egories, 0.11), and the adjusted decrease in biparietal diameter was 1.0 mm (95% CI, –2.0 to 0.0 mm; test for linear trend across categories, p = 0.06, Table 5). Each increase by one in log-transformed exposure was asso-ciated with an adjusted decrease by 1.5 mm in head circumference (95% CI, –3.1 to 0.0 mm, compared with –1.9 and –1.9 mm at birth and during the third trimester, respec-tively) and by 0.6 mm in biparietal diameter (95% CI, –1.1 to –0.1 mm) (Table 5).
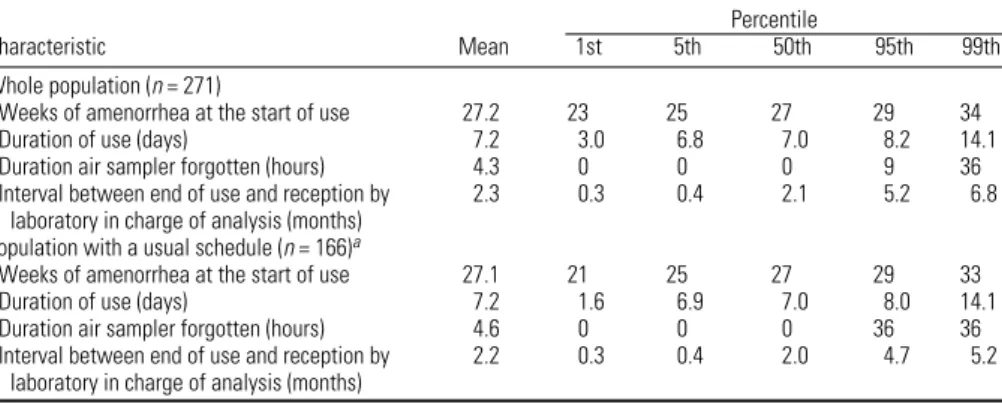
Table 1. Characteristics of use of the passive air sampler (271 nonsmoking women from the EDEN cohort).
Percentile
Characteristic Mean 1st 5th 50th 95th 99th
Whole population (n = 271)
Weeks of amenorrhea at the start of use 27.2 23 25 27 29 34
Duration of use (days) 7.2 3.0 6.8 7.0 8.2 14.1
Duration air sampler forgotten (hours) 4.3 0 0 0 9 36
Interval between end of use and reception by 2.3 0.3 0.4 2.1 5.2 6.8 laboratory in charge of analysis (months)
Population with a usual schedule (n = 166)a
Weeks of amenorrhea at the start of use 27.1 21 25 27 29 33
Duration of use (days) 7.2 1.6 6.9 7.0 8.0 14.1
Duration air sampler forgotten (hours) 4.6 0 0 0 36 36
Interval between end of use and reception by 2.2 0.3 0.4 2.0 4.7 5.2 laboratory in charge of analysis (months)
aRestricted to women who declared that their schedule during the week of assessment of benzene exposure was similar to their schedule during the previous month.
Slama et al.
Finally, at the first-trimester ultrasonog-raphy, compared with the lowest exposure category, the highest category was associated with an adjusted decrease in biparietal diam-eter by 0.9 mm (95% CI, –1.6 to –0.2 mm;
p-value for linear trend, 0.03) (Table 6). Each
increase by one in log-transformed exposure was associated with a decrease by 0.4 mm in biparietal diameter during the first trimester (95% CI, –0.7 to 0.0 mm, compared with –0.6 and –0.6 mm during the third and sec-ond trimesters, respectively).
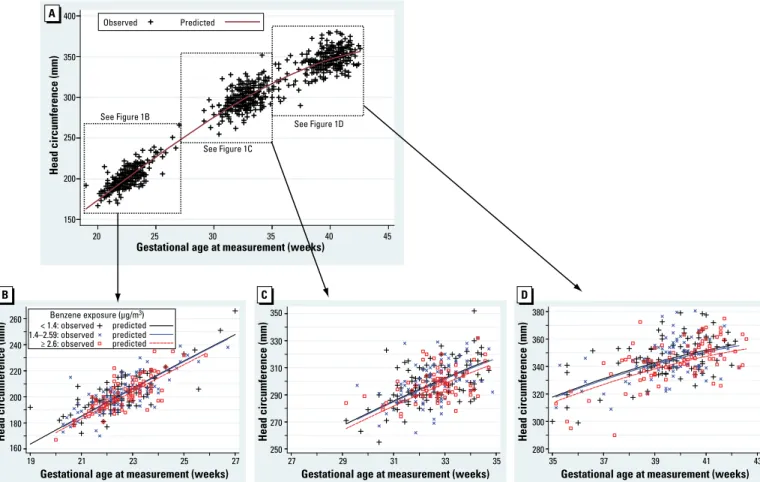
Longitudinal analysis. Figure 1 shows the
results of the longitudinal analysis combin-ing second, third trimester, and birth mea-surements of head circumference, which are
consistent with the above-described trimester-specific analyses.
Sensitivity analyses. When we restricted
the analysis to the “usual schedule” group, the estimated birth weight change corresponded to a decrease of 87 g for each increase by one in log-transformed exposure (95% CI, –171 to –3 g; Table 3). Concerning head circumfer-ence and biparietal diameter, the results in the usual schedule group were similar to those in the whole population (Tables 3–6), although
p-values were generally larger, with smaller
sample sizes. The association with benzene was somewhat stronger when we assessed head circumference from the single measurement at birth (the variation in head circumference
associated with the highest exposure category was –5.7 mm; 95% CI, –10.2 to –1.2 mm), compared with our original analysis using the average of two measurements within 3 days after birth (Figure 2A).
Associations remained similar after exclu-sion of subjects who lived in homes where wood or coal was used as a source of heat-ing (a potential indoor source of benzene). We observed qualitatively similar results after exclusion of small-for-gestational-age births (Figure 2). Associations with head circumfer-ence were similar for subjects who had used the air samplers at least 5 days, for subjects who had not forgotten it in a room from which they were absent (or forgotten it for
Table 2. Characteristics of the participants and their association with benzene levels.
ap-Value of Kruskal–Wallis rank test (or trend test if specified). The test was performed excluding the category corresponding to missing values. bp-Value of chi-square test (exact test when required). The test was performed excluding the category corresponding to missing values. cp-Value of nonparametric trend test by Cuzick (1985). dDuring the week before the start of use of the passive air sampler. eThe value was set to 0 for women for whom car was not the most frequent means of transportation. fAverage during the period of use of the pas-sive air sampler of the measurements from the permanent monitoring station closest from the home address.
Mean
(median) Benzene level
benzene [µg/m3 (%)]
No. level < 1.4 1.4–2.59 ≥ 2.6
Characteristic (%) (µg/m3) p-Valuea (n = 97) (n = 87) (n = 87) p-Valueb
Sex of offspring 0.82 0.40
Male 147 (54) 2.6 (1.8) 37 29 34
Female 124 (46) 2.6 (1.8) 34 36 30
Gestational duration (weeks) 0.10c 0.02
27–36 23 (8) 2.3 (1.4) 48 30 22 37–38 54 (20) 2.8 (1.9) 35 26 39 39–40 143 (53) 2.5 (1.8) 36 39 25 ≥ 41 51 (19) 2.7 (2.3) 31 20 49 Birth weight (g) 0.65 0.97 < 2,500 21 (7) 3.0 (2.2) 33 33 33 ≥ 2,500 249 (91) 2.5 (1.8) 36 32 32 Missing value 1 (0.3) 2.7 (2.7) Birth order 0.43c 0.53 First birth 129 (48) 2.6 (1.8) 38 33 29 Second birth 89 (33) 2.7 (1.8) 38 28 34
Third birth or more 53 (20) 2.3 (2.0) 26 37 36
Maternal age at conception (years) 0.88 0.97
< 25 39 (14) 2.5 (1.7) 36 28 36 25–29 108 (40) 2.9 (1.8) 35 32 32 30–34 81 (30) 2.6 (1.9) 35 32 33 ≥ 35 43 (16) 2.3 (1.8) 40 35 26 Maternal height (cm) 0.71 0.88 < 160 75 (27) 2.3 (1.8) 35 35 31 160–169 152 (56) 2.7 (1.8) 34 32 34 ≥ 170 41 (15) 2.7 (1.8) 41 29 29 Missing value 3 (1) 0.6 (0.3)
Maternal prepregnancy weight (kg) 0.26 0.38
< 50 27 (10) 2.7 (1.9) 41 26 33
50–59 114 (42) 2.2 (1.6) 42 31 27
60–69 81 (30) 2.9 (2.1) 23 38 38
70–79 30 (11) 3.3 (1.9) 40 27 33
≥ 80 19 (7) 2.1 (1.6) 37 32 32
Maternal age at end of education (years) 0.15c 0.06
≤ 17 14 (5) 2.7 (2.4) 14 36 50
18–19 45 (17) 2.6 (2.0) 33 29 37
20–21 53 (19) 2.7 (1.8) 25 43 32
22–23 80 (29) 2.4 (1.5) 49 23 29
> 23 79 (29) 2.6 (1.8) 35 35 29
Urinary cotinine level (ng/mL) 0.11c 0.57
< Limit of detection 209 (77) 2.5 (1.7) 37 33 30
0.1–5 48 (18) 2.5 (1.9) 33 31 35
> 5 14 (5) 3.0 (2.5) 21 29 50
Maternal passive smoking (second trimester) 0.07 0.25
No 211 (78) 2.5 (1.8) 38 31 31
Yes 60 (22) 2.9 (2.1) 27 37 37
Mean
(median) Benzene level,
benzene [µg/m3 (%)]
No. level < 1.4 1.4–2.59 ≥ 2.6
Characteristic (%) (µg/m3) p-Valuea (n = 97) (n = 87) (n = 87) p-Valueb
Month of benzene measurement < 10–4 < 10–3
January–March 91 (34) 2.8 (2.3) 21 35 44
April–June 68 (25) 2.1 (1.5) 47 26 26
July–September 65 (24) 2.5 (1.0) 65 18 17
October–December 47 (17) 2.8 (2.2) 9 53 38
Month of conception of the child < 10–4 < 10–3
January–March 66 (24) 2.0 (1.0) 65 23 12
April–June 42 (15) 3.2 (2.2) 12 52 36
July–September 80 (30) 2.9 (2.3) 15 38 48
October–December 83 (30) 2.4 (1.6) 45 24 31
Use of wood or coal for heating 0.82 0.30
No 237 (87) 2.6 (1.8) 36 33 31
Yes 25 (9) 2.3 (2.2) 36 20 44
Missing value 9 (3) 3.1 (2.4)
Most frequent means of transportationd 0.06 0.29
Car 199 (73) 2.7 (1.9) 32 34 34
Bus 10 (4) 2.6 (2.2) 20 40 40
Walk 47 (17) 2.1 (1.3) 51 26 23
Other 14 (5) 2.1 (1.5) 43 29 29
Missing value 1 (0.4) 0.3 (0.3)
Daily time spent in a car (min)e 0.71 0.72
< 30 142 (52) 2.6 (1.8) 35 33 32
30–59 77 (28) 2.2 (1.7) 40 27 32
≥ 60 47 (17) 3.2 (2.0) 30 38 32
Missing value 5 (2) 1.7 (2.0)
NO2 estimate at home address (µg/m3 )f < 10–3 < 10–3
< 18.44 89 (33) 2.1 (1.4) 55 19 26
18.45–29.39 88 (32) 2.1 (1.8) 35 35 30
> 29.40 88 (32) 2.8 (2.2) 18 43 39
Missing value 6 (2) 2.6 (2.8)
PM10 estimate at home address (µg/m3 )f 0.02 0.02
< 16.37 84 (31) 2.6 (1.7) 42 27 31
16.37–20.69 86 (32) 2.2 (1.5) 45 34 21
> 20.70 84 (31) 2.9 (2.2) 24 36 40
Missing value 17 (6) 2.8 (2.6)
Home with windows opening on the street 0.003 0.02
No 58 (21) 1.7 (1.4) 52 26 22 Yes 207 (76) 2.8 (1.9) 32 33 35 Missing value 6 (2) 2.1 (2.3) Center 0.005 0.05 Nancy 160 (59) 2.9 (2.0) 30 36 34 Poitiers 111 (41) 2.1 (1.6) 44 27 29
< 12 hr), and after exclusion of observations with an interval between the end of use of the sampler and storage in a refrigerator of > 90 days during part of the June–September period (Figure 2). As expected, associations tended to be weaker when we adjusted for ultrasound-based rather than LMP-based ges-tational duration (Figure 2). The estimated effect of benzene tended to be stronger among the group of 141 women who declared to have regular cycles, compared with results based on the whole population (Figure 2B).
Discussion
In a cohort of nonsmoking women recruited during the first half of pregnancy, we observed decreased birth weight, decreased head cir-cumference during the second and third trimesters of pregnancy and at birth, and decreased biparietal diameter during preg-nancy in association with maternal benzene exposure.
Several studies in which exposure had been estimated from the air pollution levels in the vicinity of the home address had reported decrements in birth weight (corrected for ges-tational age) or increases in the risk of small-for-gestational-age births in association with air pollution levels (Jedrychowski et al. 2004; Parker et al. 2005; Ritz and Wilhelm 2008; Slama et al. 2008a; Wilhelm and Ritz 2003). Our study tends to confirm the association between air pollutants and gestational age– corrected birth weight using personal exposure assessment, adjusting for many potential con-founders not always considered in previous studies, and focusing on a marker of air pollu-tion specific of traffic and combuspollu-tion sources. Several studies have tried to identify win-dows of sensitivity to air pollutants during pregnancy, by testing associations between trimester-specific exposure variables and birth weight, without yielding a consistent picture (reviewed by Slama et al. 2008a). Only one study assessed fetal growth during pregnancy: In a study that assessed exposure from the air quality monitoring station data, Hansen et al. (2008) reported an association between the concentration of PM with an aerodynamic diameter < 10 µm and head circumference assessed by ultrasound between 13 and 26 ges-tational weeks. Their results and ours suggest that air pollutants could influence fetal head circumference during the second trimester of pregnancy. The fact that in our study benzene levels exhibited associations with biparietal diameter assessed at the end of the first trimes-ter indicates that air pollution effects might manifest even earlier in pregnancy. However, this analysis should be considered with cau-tion because the first- trimester examinacau-tion was conducted at a time point more distant from benzene monitoring than the later ultra-sound examinations.
Table 3. Associations between benzene levels during pregnancy and measurements of the offspring at birth.
Gestational age–adjusted modelsa Fully adjusted modelsb
Measure No. Mean ± SD βc (95% CI) p-Value βc (95% CI) p-Value
Birth weight (g)
Benzene exposure, whole population (µg/m3 )
< 1.4 97 3,309 ± 574 0 0.59d 0 0.23d
1.4–2.59 87 3,262 ± 555 –77 (–195 to 41) 0.20 –74 (–197 to 50) 0.24 ≥ 2.6 86 3,336 ± 497 –45 (–163 to 74) 0.46 –90 (–215 to 36) 0.16 ln(benzene) 270 3,302 ± 543 –40 (–102 to 21) 0.20 –68 (–135 to –1) 0.05 Benzene exposure, population with a usual schedule (µg/m3 )e
< 1.4 65 3,354 ± 549 0 0.34d 0 0.19d
1.4–2.59 53 3,386 ± 560 –7 (–157 to 142) 0.92 13 (–150 to 177) 0.87 ≥ 2.6 46 3,375 ± 470 –73 (–230 to 84) 0.36 –95 (–257 to 68) 0.25 ln(benzene) 164 3,370 ± 529 –59 (–141 to 23) 0.16 –87 (–171 to –3) 0.04 Head circumference after birth (mm)
Benzene exposure, whole population (µg/m3 )
< 1.4 94 345.8 ± 16 0 0.10d 0 0.04d
1.4–2.59 86 344.6 ± 15 –1.3 (–5.0 to 2.3) 0.47 –0.9 (–4.5 to 2.7) 0.32 ≥ 2.6 85 344.0 ± 16 –3.1 (–6.7 to 0.5) 0.10 –3.7 (–7.3 to 0.0) 0.05 ln(benzene) 265 344.8 ± 16 –1.4 (–3.3 to 0.4) 0.14 –1.9 (–3.8 to 0.0) 0.06 Benzene exposure, population with a usual schedule (µg/m3 )e
< 1.4 64 346.6 ± 13 0 0.06d 0 0.08d
1.4–2.59 52 347.3 ± 16 0.5 (–3.9 to 4.9) 0.82 2.1 (–2.8 to 6.9) 0.40 ≥ 2.6 46 344.1 ± 13 –4.2 (–8.8 to 0.4) 0.07 –3.3 (–8.1 to 1.5) 0.17 ln(benzene) 162 346.1 ± 14 –1.9 (–4.3 to 0.5) 0.12 –2.2 (–4.7 to 0.4) 0.09 Model’s adjusted R2 (whole population only, models with log-transformed exposure) was 0.54 for birth weight and also
0.54 for head circumference after birth.
aAdjusted for gestational age at birth (linear and quadratic terms). bAdjusted for gestational age at birth (linear and
quadratic terms), sex, maternal passive smoking (questionnaire data), urinary cotinine levels (three categories), prepreg-nancy weight, height, birth order, occupational exposure to paints or pesticides, month of conception, maternal age at end of studies, and center. Models for head circumference were further adjusted for cesarian birth (yes/no), and the number of days between birth and measurement of head size. cParameter of the linear regression model associated with benzene, corresponding to the difference in mean birth weight (g) or head circumference (mm) with respect to the first exposure category; for the continuous coding, β corresponds to the change in mean birth weight (g) or head circumfer-ence (mm) for each increase by one in log-transformed exposure. dp-Value for linear trend across exposure categories. eRestricted to women who declared that their schedule during the week of assessment of benzene exposure was similar to their schedule from the previous month.
Table 4. Association between benzene levels during pregnancy and head ultrasound measurements
dur-ing the third trimester of pregnancy.
Gestational age–adjusted modelsa Fully adjusted modelsb
Measure No. Mean ± SD (mm) βc (95% CI) p-Value βc (95% CI) p-Value
Head circumference at the third-trimester ultrasound examination Benzene exposure, whole population (µg/m3 )
< 1.4 93 298.7 ± 15 0 0.15d 0 0.02d
1.4–2.59 86 299.0 ± 15 –0.9 (–4.6 to 2.7) 0.61 –1.6 (–5.4 to 2.3) 0.43 ≥ 2.6 80 297.6 ± 11 –2.7 (–6.3 to 1.0) 0.16 –4.8 (–8.8 to –0.8) 0.02 ln(benzene) 259 298.5 ± 14 –0.5 (–2.5 to 1.4) 0.58 –1.9 (–4.0 to 0.3) 0.09 Benzene exposure, population with a usual schedule (µg/m3 )e
< 1.4 63 298.9 ± 16 0 0.09d 0 0.06d
1.4–2.59 52 300.5 ± 14 1.1 (–3.4 to 5.5) 0.63 2.6 (–2.7 to 7.8) 0.33 ≥ 2.6 43 296.5 ± 10 –3.8 (–8.5 to 0.9) 0.11 –4.1 (–9.3 to 1.2) 0.13 ln(benzene) 158 298.8 ± 14 –0.5 (–3.0 to 2.0) 0.69 –1.8 (–4.6 to 1.0) 0.21 Biparietal diameter at the third-trimester ultrasound examination
Benzene exposure, whole population (µg/m3 )
< 1.4 93 83.2 ± 4.8 0 0.07d 0 0.02d
1.4–2.59 86 83.3 ± 4.2 –0.2 (–1.3 to 0.9) 0.66 –0.2 (–1.5 to 1.0) 0.69 ≥ 2.6 81 82.8 ± 3.7 –1.0 (–2.1 to 0.1) 0.08 –1.3 (–2.6 to –0.1) 0.04 ln(benzene) 260 83.1 ± 4.3 –0.3 (–0.9 to 0.3) 0.27 –0.6 (–1.2 to 0.1) 0.09 Benzene exposure, population with a usual schedule (µg/m3 )e
< 1.4 63 83.4 ± 5.3 0 0.12d 0 0.09d
1.4–2.59 52 83.8 ± 4.2 0.2 (–1.2 to 1.7) 0.76 0.5 (–1.2 to 2.2) 0.59 ≥ 2.6 44 82.9 ± 4.0 –1.1 (–2.6 to 0.4) 0.15 –1.2 (–2.9 to 0.5) 0.15 ln(benzene) 159 83.4 ± 4.6 –0.3 (–1.1 to 0.5) 0.43 –0.7 (–1.6 to 0.2) 0.14 Model’s adjusted R2 (whole population only, models with log-transformed exposure) was 0.32 for head circumference and
0.35 for biparietal diameter.
aAdjusted for gestational age at examination (linear and quadratic terms). bAdjusted for gestational age at the
exami-nation (linear and quadratic terms), sex, maternal passive smoking (questionnaire data), urinary cotinine levels (three categories), prepregnancy weight, height, parity, occupational exposure to paints or pesticides, month of conception, maternal education, and center. cParameter of the linear regression model associated with benzene, corresponding to the difference in mean head size expressed in millimeters with respect to the first exposure category or, for the continu-ous coding, to the change in mean head size for each increase by one in log-transformed exposure. dp-Value for linear trend across exposure categories. eRestricted to women who declared that their schedule during the week of assess-ment of benzene exposure was similar to their schedule from the previous month.
Slama et al.
Our analyses suggested a stronger associa-tion (measured on an additive scale) between benzene and fetal growth among male than among female newborns. Ghosh et al. (2007) suggested that air pollution effects on the risk of a low-birth-weight birth (assessed by multiplicative models) may differ by sex. In a cohort of pregnant women conducted in Poland, personal PM2.5 (PM with an
aerody-namic diameter < 2.5 µm) exposure was more strongly associated with head circumference
(using additive models) among male than among female newborns (Jedrychowski et al. 2009). Stronger effects of maternal smok-ing among male compared with female fetuses have also been reported, using either birth weight or biparietal diameter assessed by ultrasound as the outcome (Zaren et al. 2000). Our results are in line with these two studies (Jedrychowski et al. 2009; Zaren et al. 2000), relying on other measures of air pollution exposure.
Previous studies of associations between maternal benzene exposure and birth out-comes in human populations have been conducted in occupational settings, where benzene is used as a solvent and as an inter-mediate in the synthesis of many families of products (Chen et al. 2000; Wang et al. 2000). In a study in Taiwan, 792 women were recruited during pregnancy, among which 354 were considered occupation-ally exposed to benzene. After adjustment, a potential benzene exposure was associated with a nonsignificant reduction in mean birth weight of 15 g (95% CI, –52 to 82 g); in a model with an interaction term between benzene exposure and work stress, mean birth weight of offspring of the 57 women consid-ered exposed to both factors was reduced by 183 g (95% CI, 65 to 301 g), compared with women considered exposed to neither factor (Chen et al. 2000). This study is difficult to compare with ours because it deals with occu-pational exposure, which generally stops dur-ing the third trimester of pregnancy (Chen et al. 2000), and because exposure assessment was performed on a binary scale by an indus-trial hygienist and did not consider nonoc-cupational exposures. Moreover, benzene exposure is probably a proxy for exposure to different mixtures of pollutants in occupa-tional and nonoccupaoccupa-tional settings.
The main strengths of our study are its prospective design, the use of ultrasound meas urements to assess fetal growth, and the personal assessment of benzene exposure. The main limitation is that assessment was per-formed only once during 7 consecutive days, so we had no direct information on the vari-ability in exposure during pregnancy. In addi-tion, the sample size was too limited to study rare events such as occurrence of small-for-gestational-age births.
Possible implications. Head circumference
is correlated with brain volume in neonates (Lindley et al. 1999). The possible long-term consequences of air pollution effects on head circumference or brain volume are difficult to establish. A review concluded that children with poor prenatal head growth may be at risk for adverse neurodevelopmental outcomes (Yanney and Marlow 2004). Few studies have directly addressed the consequences of pre-natal exposure to air pollutants on cognitive development in childhood. Within a New York City, New York, cohort, prenatal expo-sure to polycyclic aromatic hydrocarbons was associated with lower mental development index at 3 years of age and a greater risk of cognitive developmental delay (Perera et al. 2006). However, this association remained after adjustment for birth weight and head circumference at birth (Perera et al. 2006), so any effect of polycyclic aromatic hydrocar-bons on mental development is unlikely to be
Table 5. Association between benzene levels during pregnancy and head ultrasound measurements
dur-ing the second trimester of pregnancy.
Gestational age–adjusted modelsa Fully adjusted modelsb
No. Mean ± SD (mm) βc (95% CI) p-Value βc (95% CI) p-Value
Head circumference at the second-trimester ultrasound examination Benzene exposure, whole population (µg/m3 )
< 1.4 95 202.5 ± 14 0 0.45d 0 0.11d
1.4–2.59 83 201.8 ± 14 –0.7 (–3.4 to 1.9) 0.59 –1.3 (–4.2 to 1.6) 0.37 ≥ 2.6 81 202.2 ± 13 –1.1 (–3.8 to 1.6) 0.43 –2.5 (–5.4 to 0.5) 0.10 ln(benzene) 259 202.2 ± 14 –0.6 (–2.0 to 0.8) 0.41 –1.5 (–3.1 to 0.0) 0.05 Benzene exposure, population with a usual schedule (µg/m3 )e
< 1.4 60 203.7 ± 16 0 0.71d 0 0.20d
1.4–2.59 52 201.7 ± 13 1.0 (–2.5 to 4.4) 0.58 1.0 (–3.1 to 5.2) 0.62 ≥ 2.6 44 202.6 ± 14 –0.5 (–4.2 to 3.1) 0.77 –2.2 (–6.2 to 1.8) 0.28 ln(benzene) 156 202.8 ± 14 –0.3 (–2.2 to 1.6) 0.76 –1.6 (–3.8 to 0.5) 0.14 Biparietal diameter at the second-trimester ultrasound examination
Benzene exposure, whole population (µg/m3 )
< 1.4 95 55.3 ± 4.5 0 0.65d 0 0.06d
1.4–2.59 86 55.3 ± 4.5 –0.2 (–1.1 to 0.7) 0.73 –0.5 (–1.5 to 0.5) 0.32 ≥ 2.6 84 54.9 ± 4.0 –0.5 (–1.4 to 0.4) 0.29 –1.0 (–2.0 to 0.0) 0.05 ln(benzene) 265 55.2 ± 4.3 –0.3 (–0.7 to 0.2) 0.27 –0.6 (–1.1 to –0.1) 0.02 Benzene exposure, population with a usual schedule (µg/m3 )e
< 1.4 63 55.5 ± 4.9 0 0.65d 0 0.21d
1.4–2.59 53 55.1 ± 4.0 0.1 (–1.0 to 1.3) 0.81 –0.1 (–1.5 to 1.3) 0.91 ≥ 2.6 44 55.0 ± 4.4 –0.3 (–1.5 to 1.0) 0.69 –0.8 (–2.2 to 0.6) 0.24 ln(benzene) 160 55.2 ± 4.4 –0.2 (–0.8 to 0.5) 0.62 –0.6 (–1.4 to 0.1) 0.09 Model’s adjusted R2 (whole population only, models with log-transformed exposure) was 0.64 for head circumference and
0.56 for biparietal diameter.
aAdjusted for gestational age at examination (linear and quadratic terms). bAdjusted for gestational age at the
exami-nation (linear and quadratic terms), sex, maternal passive smoking (questionnaire data), urinary cotinine levels (three categories), prepregnancy weight, height, parity, maternal occupational exposure to paints or pesticides, month of conception, maternal education, and center. cParameter of the linear regression model associated with benzene, cor-responding to the difference in mean head size expressed in millimeters with respect to the reference category or, for the continuous coding, to the change in mean head size for each increase by one in log-transformed exposure. dp-Value for linear trend across categories. eRestricted to women who declared that their schedule during the week of assessment of benzene exposure was similar to their schedule from the previous month
Table 6. Association between benzene levels during pregnancy and ultrasound measurements of
bipari-etal diameter during the first trimester of pregnancy.
Gestational age–adjusted modelsa Fully adjusted modelsb
Benzene exposure No. Mean ± SD (mm) βc (95% CI) p-Value βc (95% CI) p-Value
Whole population (µg/m3 )
< 1.4 84 22.1 ± 2.9 0 0.11d 0 0.03d
1.4–2.59 85 21.6 ± 3.2 –0.5 (–1.2 to 0.1) 0.10 –0.7 (–1.4 to 0.0) 0.05 ≥ 2.6 84 21.9 ± 3.2 –0.6 (–1.2 to 0.1) 0.08 –0.9 (–1.6 to –0.2) 0.01 ln(benzene) 253 21.9 ± 3.1 –0.2 (–0.5 to 0.2) 0.30 –0.4 (–0.7 to 0.0) 0.06 Population with a usual schedule (µg/m3 )e
< 1.4 57 21.9 ± 2.8 0 0.42d 0 0.25d
1.4–2.59 50 21.9 ± 3.1 –0.1 (–0.9 to 0.7) 0.83 –0.3 (–1.2 to 0.7) 0.58 ≥ 2.6 44 22.5 ± 3.4 –0.4 (–1.2 to 0.5) 0.42 –0.6 (–1.5 to 0.4) 0.24 ln(benzene) 151 22.1 ± 3.1 0.0 (–0.5 to 0.4) 0.85 –0.2 (–0.7 to 0.3) 0.37 Model’s adjusted R2 (whole population only, model with log-transformed exposure) was 0.57.
aAdjusted for gestational age at examination (linear and quadratic terms). bAdjusted for gestational age at the
exami-nation (linear and quadratic terms), sex, maternal passive smoking (questionnaire data), urinary cotinine levels (three categories), prepregnancy weight, height, parity, maternal occupational exposure to paints or pesticides, month of conception, maternal education, and center. cParameter of the linear regression model associated with benzene, corre-sponding to the difference in mean biparietal diameter expressed in millimeters with respect to the reference category or, for the continuous coding, to the change in mean biparietal diameter for each increase by one in log-transformed expo-sure. dp-Value for linear trend across exposure categories. eRestricted to women who declared that their schedule during the week of assessment of benzene exposure was similar to their schedule from the previous month.
entirely mediated by changes in head circum-ference at birth.
Benzene exposure as a proxy for exposure
to traffic-related air pollutants. The mean
per-sonal benzene levels were 2.1 µg/m3 in the
Poitiers area (a city of 100,000 inhabitants), compared with 2.9 µg/m3 in Nancy area, a
more densely populated city of 300,000 inhabitants with higher mean environmental concentrations of NO2 estimated by the air
quality monitoring stations (F. Caïni, Atmo Poitou-Charentes, personal communica-tion). By comparison, mean exposure levels of 5.1 µg/m3 have been reported among
non-smokers in Madrid, Spain, for the year 2003, and of 2.9 µg/m3 in Dublin, Ireland, in 2004
(Ballesta et al. 2006). Among our nonsmoking population, benzene exposure exceeded the European Union limit of 5 µg/m3 planned for
the ambient air in 2010 for 26 subjects (10% of the population).
The main route of exposure to benzene is through the air, and the main sources of expo-sure among nonsmoking subjects from the general population are fuel and environmen-tal tobacco smoke (Wallace 1996). Benzene is a recognized carcinogen, and emissions from
most consumer products are expected to be very low. Although we cannot rule out the existence of indoor sources of benzene in the general population not related to fuel or ciga-rette smoke, the correlation between benzene exposure and outdoor NO2 levels does not
speak in favor of important indoor sources of benzene. About 10% of women lived in a home where wood was used for heating; exclusion of these women did not modify the association between benzene and head circumference. Benzene is used as an addi-tive in unleaded gasoline, in which a volume concentration of up to 1% is currently per-mitted in the United States and the European Union. Its presence in traffic exhaust is attrib-utable to some benzene escaping the combus-tion process and benzene being a by-product of the partial combustion of other organic compounds. Benzene is also present in the environment because of other combustion processes such as residential heating or indus-trial emissions. Benzene levels much higher than common outdoor levels have been reported in car cabins (Ilgen et al. 2001b; Jo and Park 1999), so sitting in a car for about 1 hr/day can substantially increase personal
exposure; a European study estimated that exposures in transit contribute to 29% of total personal benzene exposure (Bruinen de Bruin et al. 2008). Benzene environmental levels have been shown to be higher in the vicinity of roads with high traffic and in homes with a garage with a connecting door to the liv-ing rooms (Ilgen et al. 2001a). In our study, benzene exposure was higher for women who used the car as their main means of transpor-tation. For these reasons, benzene exposure in our nonsmoking population in which effects of passive smoking have been controlled for can be seen as a proxy for exposure to traffic or combustion-related air pollutants.
Possible biological mechanisms. There is
support from experiments in rodents for an effect of maternal exposure to airborne ben-zene (not associated to other traffic-related air pollutants) on fetal weight [reviewed by ATSDR (2007)]. More probably, if it reflects a causal mechanism, the association that we observed could be attributable to a joint effect of several traffic-related air pollutants. In mice, effects on fetal weight have been reported for traffic exhaust exposure during pregnancy (Rocha et al. 2008; Veras et al. 2008). Several
Figure 1. Head circumference as a function of gestational age at measurement and maternal benzene exposure. Head circumference was assessed between 19
gestational weeks and birth (A), between 19 and 27 gestational weeks (by ultrasonography) (B), between 27 and 35 gestational weeks (by ultrasonography) (C), and between 35 and 43 gestational weeks (after birth) (D). The predicted curves are adjusted for gestational age at examination (polynomial coding and interac-tion terms with all adjustment variables but educainterac-tion and center), sex, maternal passive smoking (quesinterac-tionnaire data), urinary cotinine level, prepregnancy weight, height, parity, maternal occupational exposure to paints or pesticides, month of conception, maternal education, and center.
160 180 200 220 240 260 Head circumference (mm) 19 21 23 25 27
Gestational age at measurement (weeks)
< 1.4: observed 1.4–2.59: observed predicted Benzene exposure (µg/m3) 250 270 290 310 330 350 27 29 31 33 35
Gestational age at measurement (weeks)
280 300 320 340 360 380 35 37 39 41 43
Gestational age at measurement (weeks)
150 200 250 300 350 400 Head circumference (mm) 20 25 30 35 40 45
Gestational age at measurement (weeks)
Observed
See Figure 1C
See Figure 1D
Head circumference (mm) Head circumference (mm)
See Figure 1B
predicted predicted
Predicted
Slama et al.
mechanisms could explain an effect of traffic-related air pollutants on fetal growth (Kannan et al. 2006; Slama et al. 2008a). These pollut-ants might influence endothelial function and blood viscosity, which could alter maternal– placental oxygen and nutrient exchanges and thus affect fetal growth (Slama et al. 2008a). This mechanism is supported by an experi-ment on mice that found effects of urban PM air pollution on placental morphology assessed, among other parameters, by the diameter of vessels (Veras et al. 2008). Endocrine disrup-tion is another possible mechanism; indeed,
endocrine disruption may play a role in the occurrence of intrauterine growth restric-tion and might be induced by diesel exhaust (Takeda et al. 2004).
Assessment of fetal growth. The association
between benzene exposure and head size at birth was stronger when we assessed head size from the single measurement right after birth than when we assessed it from the repeated measurements performed within a few days after birth, although trends were qualitatively similar. In additional analyses performed on the whole cohort, the estimated adjusted effect
of maternal smoking was stronger for the sin-gle measure than for the average of the two measures (data not shown). The amplitude (but not the frequency) of measurement error is expected to be lower for the two measures than for the single measure. However, several factors that could not be adjusted for (e.g., postnatal nutrition of the newborn) might influence head size in the days after birth, so specific studies are warranted to determine which measure of head size is more relevant to characterize the influence of environmental factors on head circumference. In agreement with our expectation (Slama et al. 2008b), the estimated effect of exposure was stronger when we adjusted fetal size for gestational age based on the date of LMP, compared with based on the obstetrician estimate. The fact that the apparent effect of benzene tended to be stronger in the subgroup of women with a regular menstrual cycle than among the whole population, as highlighted by our sensitivity analyses, should be considered with caution because of the relatively small size of this sub-group. Although the direction of a bias due to measurement error on an adjustment factor is generally difficult to predict, this observation might be attributable to LMP-based gesta-tional age being more efficiently assessed in the subgroup of women with regular cycles.
Exposure assessment. Compared with
approaches relying on measures in the envi-ronment, personal air samplers have the advantage of taking into account both indoor and outdoor exposures, as well as exposure in each microenvironment such as vehicle cabins. A limitation is that, unless repeated measurements are performed, they do not allow the capture of temporal variations in exposure. In our study, women carried the sampler at the same stage of fetal develop-ment and for a whole week to try to capture most of the usual situations of exposure. A German study with repeated measurements of indoor and outdoor benzene levels 6–13 months apart showed important intraindi-vidual variation; however, after adjustment for season of measurement and region, the between-home standard deviation of benzene levels was greater than the within-home stan-dard deviation, and the seasonal variations in benzene levels showed similar patterns across locations of measurement (Topp et al. 2004). Although the absolute value of exposure is expected to vary with time, it is plausible that the distribution of the population into expo-sure tertiles exhibits limited variations across time; that is, women in the highest exposure tertile at 27 gestational weeks may also corre-spond to a large proportion of the women in the highest tertile of exposure averaged over a longer period. In our study, restricting analy-ses to women with a time schedule during the week of use of the air sampler similar to that
Figure 2. Sensitivity analysis: estimated effect of benzene levels (≥ 2.6 µg/m3, the reference being
< 1.4 µg/m3) on head circumference after exclusion of specific subgroups of the population or
adjust-ment for additional variables. Diamonds indicate point estimates; horizontal lines indicate the 95% CIs. Abbreviations: ETS, environmental tobacco smoke; SGA, small for gestational age. (A) Benzene and head circumference after birth (average of two measurements). (B) Benzene and head circumference at the third trimester (29–36 gestational weeks) ultrasound examination.
aThe sample sizes correspond to the adjusted analyses and thus slightly differ from those given in Table 3 or Table 4. b Ex-clusion of women occupationally exposed to paints or pesticides. cExclusion of air samplers stored for ≥ 3 months during any period including a day in the warm season (June–September). dThe single measure of head circumference performed right after birth was used instead of the average of the two independent measures performed shortly after birth.
1 Original adjusted analysis (Table 3)a 91 85
2 Also adjusted for systolic blood pressure 91 85 3 Also adjusted for diastolic blood pressure 91 85
4 Not adjusted for center 91 85
5 Restricted to Poitiers center 43 30
6 Restricted to Nancy center 48 55
7 Restricted to women with regular cycle 51 41 8 Restricted to regular cycle or always used the pill 78 74 9 Exclusion of SGA births (10th percentile) 84 81 10 Women with cotinine < detection level only 72 61 11 Not exposed to ETS (questionnaire data) only 73 59 12 Adjusted for ultrasound-based gestational age 91 85 13 Excluding occupational exposuresb 90 83
14 Restricted to the usual schedule group 63 46
15 Male newborns only 50 49
16 Female newborns only 41 36
17 Restriction to benzene levels < 15 µg/m3 91 82
18 Dosimeters carried ≥ 5 days and forgotten < 12 hr 86 75 19 Interval between use and reception < 3 monthsc 69 75
20 Single measure of head circumferenced 91 85
21 Exclude births by cesarian section 78 70 22 Excluding homes where wood is used for heating 82 74
1 Original adjusted analysis (Table 4)a 90 80
2 Also adjusted for systolic blood pressure 90 80 3 Also adjusted for diastolic blood pressure 90 80
4 Not adjusted for center 90 80
5 Restricted to Poitiers center 43 28
6 Restricted to Nancy center 47 52
7 Restricted to women with regular cycle 50 39 8 Restricted to regular cycle or always used the pill 77 70 9 Exclusion of SGA births (10th percentile) 82 75 10 Women with cotinine < detection level only 71 58 11 Not exposed to ETS (questionnaire data) 73 56 12 Adjusted for ultrasound-based gestational age 90 80 13 Excluding occupational exposuresb 89 78
14 Restricted to the usual schedule group 62 43
15 Male newborns only 49 46
16 Female newborns only 41 34
17 Restriction to benzene levels < 15 µg/m3 90 77
18 Dosimeters carried ≥ 5 days and forgotten < 12 hr 86 68 19 Interval between use and reception < 3 monthsc 67 70
20 Excluding homes where wood is used for heating 82 70
–10 –9 –8 –7 –6 –5 –4 –3 –2 –1 0 1 2 3 4 5 1 2 3 4 5 6 7 8 9 10 11 12 13 14 15 16 17 18 19 20 21 22 1 2 3 4 5 6 7 8 9 10 11 12 13 14 15 16 17 18 19 20 –10 –9 –8 –7 –6 –5 –4 –3 –2 –1 0 1 2 3 –10 –9 –8 –7 –6 –5 –4 –3 –2 –1 0 1 2 3 –10 –9 –8 –7 –6 –5 –4 –3 –2 –1 0 1 2 3 4 5 Analysis Analysis
Variation in mean head circumference at birth (mm)
Variation in mean head circumference at 3rd-trimester ultrasonography (mm)
Analysis
Benzene level [µg/m3 (no.)]
Benzene level
[µg/m3 (no.)] Change in mean head circumference after birth (mm)
(exposure ≥ 2.6 µg/m3 vs. < 1.4 µg/m3)
< 1.4 ≥ 2.6
Analysis
Change in mean head circumference at 3rd-trimester ultrasonography (mm) (exposure ≥ 2.6 µg/m3 vs. < 1.4 µg/m3)