HAL Id: in2p3-00843888
http://hal.in2p3.fr/in2p3-00843888
Submitted on 15 Jul 2013
HAL is a multi-disciplinary open access
archive for the deposit and dissemination of
sci-entific research documents, whether they are
pub-lished or not. The documents may come from
teaching and research institutions in France or
abroad, or from public or private research centers.
L’archive ouverte pluridisciplinaire HAL, est
destinée au dépôt et à la diffusion de documents
scientifiques de niveau recherche, publiés ou non,
émanant des établissements d’enseignement et de
recherche français ou étrangers, des laboratoires
publics ou privés.
Acceptance tests for the SPIRAL2 SC LINAC RF power
systems
M. Di Giacomo
To cite this version:
M. Di Giacomo. Acceptance tests for the SPIRAL2 SC LINAC RF power systems. IPAC 13 - The
4th International Particle Accelerator Conference, May 2013, Shanghai, China. Joint Accelerator
Conferences Website, pp.2702-2704, 2013. �in2p3-00843888�
ACCEPTANCE TESTS FOR THE SPIRAL2 SC LINAC RF POWER
SYSTEMS*
M. Di Giacomo, GANIL-SPIRAL2, Caen, France.
Abstract
The Spiral2 SC linac uses solid state amplifiers ranging from 2.5 to 19 kW and external circulators to drive normal and superconducting cavities working at 88.0525 MHz. The project has no manpower for in house development and all power devices are ordered to commercial companies. Robust acceptance tests have then been defined to check reliability with respect to our application. The papers describes the tests procedure and results on our first units.
INTRODUCTION
The SPIRAL2 accelerator is composed of a normal conducting injector and a surpeconducting (SC) linac. The linac uses two families of quarter wave resonators at low and high beta (7, 12%) hosted in cryomodules separated by warm sections for focusing and diagnostic devices.
Each cavity is driven by a solid state amplifier (SSA), protected by an external circulator as shown in Fig. 1.
Figure 1: Power chain of the SC linac cavities. We have chosen to put the circulator as close as possible to the cavity, to reduce stress and losses in the transmission lines. Due to the building layout and to room availability in the accelerator hall, we have a first T-line section from the amplifier to the circulator, L1, standing a reduced mismatching (4% of reflected power or VSWR<1.5) and a second section, L2, with high VSWR.
SSA ACCEPTANCE TESTS
As shown in Fig.2, we have four kinds of SSA, all based on the same 2.5 kW module.
Figure 2: Amplifier architecture.
This base module is equipped with four, 1 kW transistors (BLF578, NXP) combined by in-phase, isolated combiners (Wilkinson). Two modules are combined again with the same kind of device two obtain 5 kW units. Two or four of these units are coupled using star, non-isolated, combiners to obtain the 10 and 19 kW units.
Test Bench
Acceptance tests are performed on a 20 kW test bench [1] based on a phase shifter and a variable VSWR device (VVD). The VVD uses a 50Ω load in parallel to a λ/4 variable stub, while a trombone, able to change the line length over more than a half wave, is used as phase shifter (Fig.3).
a) b)
Figure 3: Test bench picture (a) and bloc diagram (b).
Mismatched Test Conditions
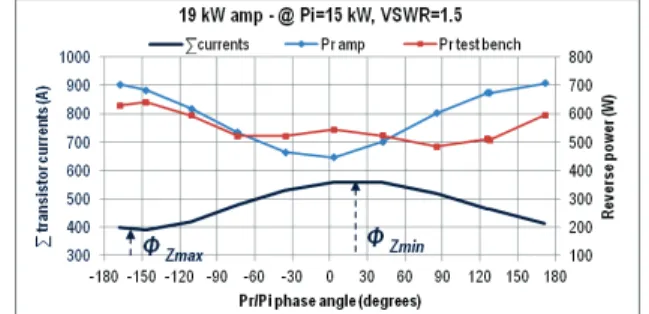
The VVD is set for VSWR equal 1.5 while the trombone position is swept by steps of 20°. Measured values are represented as a function of the Pr/Pi phase angle. For each amplifier, we look for the phases giving
maximum (Zmax) and minimum (Zmin) load impedance by
driving the amplifier at constant output power (Pi) and looking at the total transistor current. It is to be noticed that the curve has to be plotted at intermediate power level, otherwise it appears deformed and maximum and minimum points can’t be defined correctly. The plot of Fig. 4 is for instance obtained on a 19 kW amplifier, running at 15 kW, locked to the test bench directional coupler indication.
Figure 4: Example of results after a λ/2 span of the phase shifter position, the amplifier being driven at constant output power.
Reflected Power Protection
On the second vertical axis, Fig. 4 shows the amount of reflected power (Pr) indicated by the test bench reference
Φ shifter 0-180° AMP Dir Cpl VVD Variable L Variable VSWR Device ___________________________________________
* The research leading to these results has received funding from the European Commision under the Eucard FP7 Research Infrastructures grant agreement no.227579
WEPFI002 Proceedings of IPAC2013, Shanghai, China
ISBN 978-3-95450-122-9 2702 Copyright c○ 2013 by J A CoW — cc Cr eati v e Commons Attrib ution 3.0 (CC-BY -3.0)
07 Accelerator Technology and Main Systems T08 RF Power Sources
directional coupler and by the amplifier monitor. These indications are sometimes far for the nominal value (600W), and we are still working to understand whether this is due to a measurement error or whether the amount of reverse power is modified by the trombone characteristic impedance. Nevertheless, the amplifier indication being some 10% higher than the reference one, the threshold of the reflected power protection should be corrected of this factor.
Amplifier Responses
Once we have identified the two reference mismatched conditions, we measure input/output responses and other typical parameters like stability, harmonics and efficiency at this point and on 50Ω. We also look for max operating temperature and perform endurance power tests, with long breaks to produce cycled stressing conditions. An example of amplifier responses is shown in Fig. 5.
Figure 5: Amplifier responses and operating diagrams The green curves are the nominal response and operating diagrams on 50Ω, with the 1 dB compression point at nominal power (10 kW). The response changes a
lot with VSWR phase: ΦZmin increases linearity while
ΦZmax drastically decreases the compression point. Dotted
lines represent operating conditions available only in short pulses (few ms) at low duty cycle as the average output power is limited by the manufacturer.
All over these operating points, we observed harmonics level below -35 dBc, amplitude and phase stabilities of the output power better than 3% and 6° respectively and efficiency around 70%, at rated power and on matched load.
Junction Temperature
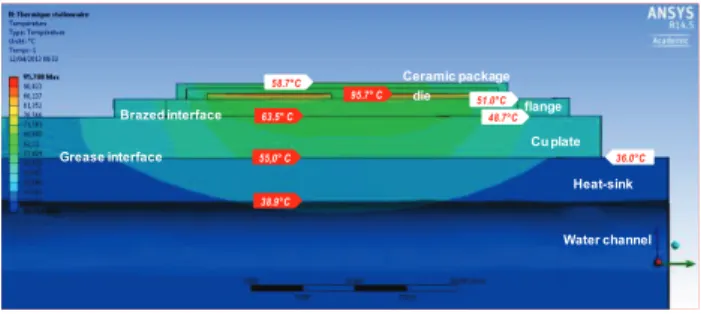
To estimate the junction temperature one has to know the dissipated power and the temperature under the transistor. In our case the device is brazed to a thick copper plate, screwed to the heat-sink. Eight pallets are cooled by the same heat-sink and a temperature probe is placed as shown in Fig. 6, rather far from the transistors.
Figure 6: Thermal model geometry and probe position. Fitting several measurements, performed around the device (values on white background on Fig. 7) in collaboration with the manufacturer, we have found the
most correct values for the interface conductivities. Fig. 7 shows the temperature distribution when 120 W are dissipated on each of the two dies which constitute the BLF578 and with input water temperature of 26°C.
Figure 7: Thermal simulation results.
Due to the high thermal flow, the temperature under the device increases quickly and the transistor is practically sitting on 63.5°C instead of 48.7°C as could be measured around.
Using the model, it has also been possible to establish that the increment of the junction temperature is roughly four times higher than the rise observed on the probe, as shown on Fig. 8.
a) b)
Figure 8: Operating temperatures.
The second diagram of Fig. 8 shows the average temperature of the two heat-sinks cooling a 10 kW amplifier. It is interesting to notice that the temperature increases very quickly with the output power and that it is maximum around 50, 60% of the nominal power.
Operating temperature on rather matched load is estimated around 120°C. Transient phenomena could push it up to 150°C. Nevertheless, these values should grant around 100 years of reliable operation, according to the time-to-failure diagram of the data sheet [2].
Endurance Tests
We perform long time tests to check endurance at
highest current (Zmax, rated power), highest input and
output voltages (Zmin, rated power) and highest
temperature (Zmax, half power). We consider very
important to have long breaks in order to produce cycled stressing conditions on the components and on the thermal interfaces.
CIRCULATOR AND T-LINE TESTS
Circulators are qualified using the phase shifter only, placed to change the line length L1 or L2. The mismatched condition is a short circuit.L2 has a strong effect on the circulator behaviour and the manufacturer suggests applying a distance from a voltage node slightly longer than 3λ/8 to minimize the
Ceramic package Cu plate Heat-sink Water channel die flange Grease interface Brazed interface 38.9°C 36.0°C 55,0° C 63.5° C 48.7°C 51.0°C 58.7°C 95.7° C 1 2 3 4 5 6 7 8 9 0 20 40 60 80 100 120 140 160 0 50 100 150 200 250 300 350 400 450 rat io o f t em perat ur e i ncrem en ts Te m per at ur e (°C ) Thermal power/transistor (W) Probe and junction temperatures and trend of their increment ratio vs loss
Tj T plate (Tj-26°C)/(Tp-26°C) b b b
Proceedings of IPAC2013, Shanghai, China WEPFI002
07 Accelerator Technology and Main Systems T08 RF Power Sources ISBN 978-3-95450-122-9 2703 Copyright c○ 2013 by J A C oW — cc Cr eati v e Commons Attrib ution 3.0 (CC-BY -3.0)
electric field on the ferrites in order to reduce insertion loss and thermal drift. This value has been confirmed for the 20 kW circulators and has been corrected of some 15 cm in the case of the 10 kW ones as shown in Fig. 9.
Figure 9: Isolation and loss near optimum position. Measurements are performed at 10 kW peak power and variable duty cycle.
Proper tuning of L2 reduces the insertion loss to less than 2.5% (to be compared to 7% in the worst case) and the acceptance range is rather large: ±15 cm. It is interesting to notice that the physical length measured on the mean fibre fits the electric one, even when several elbows are involved. This has been verified on our test bench and at the site where the cryomodules are tested. In both cases, differences of only few cm have been observed on ~6m long lines with up to ten elbows.
We also checked that length L1 has negligible effect on the circulator performances and that it can be used to control the amplifier response. Fig. 10 shows that isolation and loss don’t change significantly and this is still the case for other values of length L2.
Figure 10: Circulator parameters when L2 is shorted at 3λ/8 and L1 is swept over a range of 180° (λ/2).
Circulator Center Frequency and Cavity Qext
Fig. 9 shows that the circulator is tuned in order to have isolation better than -17 dB all over the operating power range. This corresponds to a cold center frequency lower (~86.5 MHz) than the operating value, which increases with thermal drift. Perfect tuning is achieved around 4 kW in mismatched conditions and with almost 8 kW on 50Ω. As thermal drift changes both input and output impedances, isolation is not the only affected parameter:
the cavity external Q factor (Qext) also changes as shown
in Fig. 11 where the measured relation between power and field is compared to the quadratic lows corresponding
to nominal and ± 10% Qext values. The cavity response
initially follows a curve with much lower Qext and comes
to the nominal one at an incident power of few kW. When beam is present and reverse power decreases, the drift should be slower, nevertheless we could need to change the circulator tuning to take into account this effect too
and to reach the right Qext at nominal beam power
(~7 kW).
Figure 11: Effect of the circulator thermal drift on the cavity Qext.
Transmission Lines Dimensions
31/8” T-lines are foreseen for the L2 sections and have
been used on the test bench. Neither elbows nor inner contacts encountered any problem when used at high VSWR, all phase angles, up to 20 kW.
CONCLUSIONS
Most power devices have been characterised before their installation on the accelerator.
A small mismatching of the circulator port, can quickly affect the amplifier response. This can be a problem when maximum power is required but can be counteracted by a proper tuning of the T-line length (L1) in between the two devices. The phase angle of direct and forward powers corresponding to the optimum L1 has been identified for each kind of amplifier and will be used as control parameter.
The T-line length between the circulator and the cavity is critical to minimize losses and thermal drift of the circulator frequency. Optimum length is comprised between 4λ/10 and 3λ/8 and the physical length measured on the mean fibre fits the electric one, even when several elbows are involved.
Thermal drift of the circulator frequency affects the isolation but also the external Q factor of the cavity. This point still needs more investigation to define the best circulator frequency tuning.
ACKNOWLEDGMENT
The author is grateful to C. Barthe-Dejean for the thermal simulations; to S. Bonneau and more generally to the RF group for the preparation work and help during measurements; to C. Schann and L. Martinache (Bruker team) for providing data measured around the transistor in operation; to L. Maurice (CEA/Irfu) for measurement on the SC cavity external Q factor.
REFERENCES
[1] M. Di Giacomo et al. “The test bench for the power amplifiers of the SPIRAL2 SC linac”, SRF 2007, Tsukuba, Japan 2007, WEP84.
[2] NXP Application Notes : AN10800.
0 50 100 150 200 250 300 0 20 40 60 80 100 Lo ss ( W ) Duty cycle (%) 10 kW circuator - L2 shorted = 3λ/8+ΔL 3λ/8 +15° +30° +45° -27 -25 -23 -21 -19 -17 0 20 40 60 80 100 is ol at io n ( dB ) Duty cycle (%) 10 kW circulator - L2 shorted = 3λ/8+ΔL 3λ/8 +15° +30° +45° -42 -39 -36 -33 -30 -27 -24 -21 -18 -15 -12 0 20 40 60 80 100 120 140 160 180 dB
phase shifter position (degrees)
10 kW circulator: Isolation @ L2=3λ/8 50 W 500 W 2,5 kW 0 50 100 150 200 250 300 350 0 20 40 60 80 100 120 140 160 180 Lo ss ( W )
phase shifter position (degrees)
10 kW circulator: loss @ L2=3λ/8 2,5 kW 5 kW 10 kW
WEPFI002 Proceedings of IPAC2013, Shanghai, China
ISBN 978-3-95450-122-9 2704 Copyright c○ 2013 by J A CoW — cc Cr eati v e Commons Attrib ution 3.0 (CC-BY -3.0)
07 Accelerator Technology and Main Systems T08 RF Power Sources