HAL Id: hal-00740722
https://hal.archives-ouvertes.fr/hal-00740722
Submitted on 10 Oct 2012HAL is a multi-disciplinary open access archive for the deposit and dissemination of sci-entific research documents, whether they are pub-lished or not. The documents may come from teaching and research institutions in France or abroad, or from public or private research centers.
L’archive ouverte pluridisciplinaire HAL, est destinée au dépôt et à la diffusion de documents scientifiques de niveau recherche, publiés ou non, émanant des établissements d’enseignement et de recherche français ou étrangers, des laboratoires publics ou privés.
Using Mutual Information and Answer Set
Programming to refine PWM based transcription
regulation network
Andres Aravena, Carito Guziolowski, Anne Siegel, Alejandro Maass
To cite this version:
Andres Aravena, Carito Guziolowski, Anne Siegel, Alejandro Maass. Using Mutual Information and Answer Set Programming to refine PWM based transcription regulation network. Jobim 2012, Jul 2012, Rennes, France. pp.171. �hal-00740722�
Using Mutual Information and Answer Set Programming
to refine PWM based transcription regulation network
Andr´es ARAVENA1,2, Carito GUZIOLOWSKI3, Anne SIEGEL2and Alejandro MAASS1,4
1
Mathomics, Center for Mathematical Modeling (UMI 2807 CNRS), University of Chile, and Center for Genome Regulation (Fondap 15090007), Santiago, Chile
{andres.aravena,amaass}@dim.uchile.cl
2
IRISA Team Dyliss, CNRS - Universit´e de Rennes 1 (UMR 6074) INRIA, 35042 RENNES Cedex - France [email protected]
3
Hamamatsu TIGA Center, Institute for Medical Biometry and Informatics, University of Heidelberg, Germany [email protected]
4
Departamento de Ingenier´ıa Matem´atica, University of Chile, Santiago, Chile
Abstract Transcriptional regulatory network models can be reconstructed ab initio from DNA
sequence data by locating the binding sites, defined by position specific score matrices, and iden-tifying transcription factors by homology with known ones in other organisms. In general the resulting network contains spurious elements, because the pattern matching methods for binding site location have low specificity, while homology to known transcription factors does not always identify correctly new ones.
In the case of A. ferrooxidans, one of the bacterias involved in industrial bioleaching processes,
the sequence based network reconstruction results in 66 transcription factors and 182 binding site motifs represented in 27 435 sites. In this work we use differential expression experimental data, in the form of Mutual Information, as logical constraints to be satisfied by any valid regulatory network subgraph. These rules are expressed as an Answer Set Program, a logical program-ming paradigm, and used to determine the minimal sets of motif and transcription factors which constitute a genetic regulatory network compatible with the experimental evidence. The result-ing network comprises 27 transcription factors and 14 motifs in 2 428 instances, satisfyresult-ing all constraints.
Keywords Transcriptional regulatory network reconstruction, mutual information, logical pro-gramming.
1 Introduction
Regulation plays a major role in the transition from cell genotypes to phenotypes. The transcription of each gene is controlled by a regulatory region upstream of the transcription start site, where transcription factors can bind [1]. The chain of interactions between genes, transcription factors (TFs) and binding sites (BS) is known as the transcription regulation network, usually represented as a signed oriented graph [2]. Knowledge of this graph is the foundation of the qualitative or quantitative modeling of cell behavior, [3] thus constituting one of the main tools in system biology modeling of development as well as organism maintenance.
Experimental methods are used to identify the regions in the chromosome to which a protein binds, and for purifying and identifying a DNA-bound protein [4]. These experiments have not been widely applied because they are expensive and time consuming [5]. In addition, most of the results of these methods are focused on human and other eukaryotic organisms. However, some results for bacteria are organized in databases such as Prodoric [6], RegulonDB, RegTransBase and CoryneRegNet. Besides the direct wet-lab experimentation, there are two main strategies for regulatory network reconstruction: (1) directly recognizing regulatory elements in the genomic sequence, and (2) using expression data to determine gene regulatory relationships based on statistical correlation.
The first strategy for in silico network reconstruction uses the experimental sequences to extrapolate to other taxonomically related organisms [5]. Usual computational approaches focus either on: (1) mapping TFs and their target genes from one genome to another, or (2) using the binding site motif described in one organism to look for binding sites in a new one [7]. Neither of these approaches is perfect since orthology by itself cannot ensure that DNA-binding properties are conserved, or that both proteins respond to the same signals. On the other hand, significant variability has been observed among the binding site motifs for the same TF (e.g. see LexA in [8]) in the different bacterial phylogenetic groups. Finally, TFs can act either as activators or repressors, depending on the precise placement of their binding sites respect to the transcription start site [1]. In practice, this strategy requires two steps: (1) orthologous detection for TFs and target genes; as well as (2) new binding site prediction using position weight matrices (PWM) or other motif model. The first step can be accomplished using bidirectional Blast. For the second step there are several alternative tools such as MEME/MAST or PoSSuMsearch. Both utilize existing motif descriptions characterized as PWM and a probabilistic model to determine plausible binding sites. Unfortunately all these models produce a large number of false positives [9]. One strategy to reduce the number of false positives is the use of comparative genomics to see if the binding site is conserved among phylogenetically related organisms [10]. These strategies are known to limit the number of false positives at the cost of increasing the number of false negatives [11].
The second strategy uses a set of differential expression results, from the same organism in several stress conditions, to statistically determine the relationship between genes, from the point of view of expression regulation. Mutual information is a statistical concept describing a probabilistic relationship between variables, which can be used to identify and characterize relationships that are not detected by linear correlation [12]. In this case these variables are gene expression levels measured along several stress conditions. If two genes have a related behavior —for example if one goes up every time another goes down— then knowing the expression of one gives some information about the other. This is evaluated by mutual information. These relationships are not necessarily causal, for example if genes A and B are regulated by a third one C, mutual information will be significative between A and B as well as between A and C [13]. High mutual information is a necessary but not sufficient condition for causality. Once mutual information is evaluated, there are also several strategies to determine which are the mutual information values that correspond to significant gene relationships, and to prune the resulting graph. The general idea is to keep only the direct causal links and to drop the edges which can be better explained by a third gene. Among these strategies are Relevance Networks, ARACNe, CLR, MRNET and C3NET [14], which is the method used in this work.
In this paper, we propose an hybrid strategy to reduce the size of the set of putative TFs and binding sites using mutual information relationships derived from differential expression experimental data coded as rules in a logical program. The result is an unoriented graph which may have a small intersection with the transcriptional regulation network, because transcription factors can act at very low concentrations, and thus may be below the detection threshold of differential expression experiments. To handle this we consider operons instead of genes as the network nodes. Thus, if a TF regulates a given gene, all the operon where the TF belongs appears to control all the operon of the target gene. This makes sense because, in bacteria, operons are the minimal transcriptional unit [15].
This logical program is coded in Answer Set Programming (ASP), a declarative problem solving paradigm in logic programming and knowledge representation, which offers a rich modeling language along with highly efficient inference engines based on Boolean constraint solving technology. In ASP, a problem encoding is a set of logic programming rules which are first transformed into an equivalent propositional logic program and then processed by an answer set solver, which searches for specific solutions to the rules, called Answer Sets. ASP allows solving search problems of high complexity [27].
In summary we have two sources of data for regulation network: (1) the putative TFs and their possible binding sites, and (2) behavioral relationships stated by mutual information. Complementing these with operon prediction, we ask two questions:
– Can each of the mutual information relationships be explained by a shared regulatory element controlling both genes?
– If so, which is the minimal core of TFs and binding sites required to explain all mutual information rela-tionships?
The plan of this work is the following. First, we reconstructed a genetic regulatory network for
Acidi-thiobacillus ferrooxidansbased in the publicly available sequences. Second, we estimate mutual information from microarray experiments in several stress conditions. Finally, we encode both information (based on reg-ulation and experiments) in Answer Set Programming (ASP) to find the minimal set of TFs and binding site families that explains the observed correlations. This procedure optimizes over the complete space of possible configurations and defines a core regulatory network whose properties are further analyzed.
2 Materials
Genomic DNA sequences were downloaded from NCBI with accession number NC 011761. The func-tional annotation corresponds to [16]. TFs where determined as the best Blast hit with e-value under 1E-5 against Prodoric database of proteins [6]. Binding sites where located using FIMO from the MEME/MAST suite [17,18] and motifs from Prodoric database, represented as position weight matrices. Gene grouping in operons is given by the prediction of the recent database ProOpDB [19].
Microarray slides where printed with DNA segments from a native Acidithiobacillus ferrooxidans strain (Wenelen DSM16786). Genomic DNA was shotgun by sonication and 5 568 segments of 2Kbp nominal size where sequenced by both ends and printed in duplicate [20]. Acidithiobacillus ferrooxidans grows naturally in ferric or sulfuric medium. The set of experiments evaluated expression in ferric medium in the green channel and compared it versus: (i) sulfur medium, (ii) shift to sulfur, that is, ferric medium with last minut addition of sulfur, (iii) shift to Chalcopyrite (CuFeS2), (iv) shift to Pyrite (FeS2), (v) shift to coveline (CuS), (vi) shift to raw mine ore, and (vii) shift to quartz (SiO2) in the red channel. Cell culture, RNA extraction, hybridization and scanning were performed by BioSigma S.A. (Colina, Chile) as described in [20].
Spot quality assessment was performed using several indices summarized in a Qcom value following [21], which is further used as spot weight. Expression was normalized intra-slide using Lowess regression and inter-slides using Gquantile, since green channel was the same condition for all 7 experiments considered [22]. Each DNA segment expression value was calculated as the weighted average of the spots representing it. Since each spot contains DNA segments which can include several genes, we developed a protocol to determine each gene contribution to total spot luminescence. Using Blast each spot sequence was mapped to ATCC23270 genome. To recover the individual gene expression we solve the minimization
~g= arg min ||~c − M~g||2
s.t. ~g ≥ 0. (1)
where ~c is the vector of observed spots luminescence, ~g has components representing the equivalent lumi-nescence (and thus concentration) of each gene, and M is a matrix whose element Mi,j is the length of the intersection between spot i sequence and gene j in the Blast alignment.
This transformation is applied to each channel in each slide. The resulting experiment set was analyzed using the standard procedure implemented in Limma framework [23] for the R statistical package [24]. A linear model was fitted to each gene using lmFit method and eBayes was used to estimate statistical significance of observed values [25].
Differential expression data from 56 microarrays corresponding to 7 stress conditions was used to estimate the mutual information between genes using c3net library in R [14]. ASP code was executed using the Potassco implementation [26].
3 Results
In this section we detail the results of network reconstruction based on sequence data and its further pruning using logical programming to constraint the network to experimental evidence from differential expression results. Our main result is a reduced network, consistent with the experimental data, with a lower number of spurious regulatory elements and with a size more amenable to be analyzed and simulated using classical tools.
Element Network 1 Network 2 Network 3 (genes) (operons) (ASP optimization) Nodes1 3143 1542 1542
Nodes2 182 182 14
Edges1→2 66 66 27
Edges2→1 27435 22011 2428
MI Restrictions 1245 1206 1206
Table 1. Summary of results for each stage of network reconstruction. Regulatory networks are bipartite graphs,
connecting Nodes1(genes or operons) to Nodes2(binding site motifs). The first network is the full reconstruction linking
transcription factor (determined by homology to known transcription factor sequences in Prodoric database) to motifs (found with MEME/FIMO using PWM profiles in Prodoric database) and back to genes (from official annotation in NCBI). Edges1→2 derive from literature relating transcription factor and motifs, while Edges2→1 exists when a motif
has a instance in the promoter region of a gene. Restrictions were determined from mutual information calculated on experimental data as described in the text. Network 2 consolidates genes into operons (as predicted in ProOpDB), reducing network size based on biological hypothesis. The final network is the result of the method we present in the text. The size of the final network, supporting the same experimental evidence, is much smaller than the original one, TF are reduced by one third, BS are reduced to 8% of the initial number, as marked in boldface.
Transcription regulation networks can be represented as bipartite graphs, with genes and BS motifs as nodes. Our first result was obtained using MAST and motifs from Prodoric database to find 182 motifs rep-resented in 27 435 putative binding sites upstream of 3 143 genes in A. ferrooxidans. Using reference protein sequences from the same database, we found by homology 66 genes whose product could encode TFs which can bind in 36 of the 182 motifs. This first network is summarized in the first column of TABLE1.
Mutual information was calculated from 56 microarrays representing 7 stress conditions as described in Materials, and then filtered using the Conserved Causal Core Network protocol (C3NET, [14]). This protocol discards the weakest mutual information links and keeps a spanning-tree with 1 245 edges between genes whose behavior is experimentally related and constitute restrictions that any network simplification must satisfy.
A second network, also summarized in TABLE1, was obtained simplifying the first one by grouping the 3 143 genes into 1 542 predicted operons, as predicted in ProOpDB. The 27 435 edges connecting motifs to genes are replaced by 22 011 edges, while the 1 245 mutual information relations are reduced to 1 206.
Our third result uses our method to express the network and minimize the number of relations subject to the mutual information restrictions. We encode biological constraints as disjunctive rules that can be processed by ASP, that is as a finite set of rules of the form
a1; . . . ; al← al+1, . . . , am, not am+1, . . . , not an
where anare atoms. Intuitively, atoms can be viewed as facts and rules as deductions to determine new facts. Rules shall be read from right to left: at least one fact in the left part a1; . . . ; al (called ”head”) shall be true whenever all facts in the right part (called “body”) al+1, . . . , am, not am+1, . . . , not anare satisfied. Conse-quently, the rule with empty head← a. means that the fact a is always false. The answers set of a logical program is a set of atoms that satisfy all the logical rules, together with minimality and stability properties, ensuring that every atom appears in at least one rule.
A strong feature that we use in the following is that atoms can be stated as predicates describing relation-ships between variables. For instance, upstream(M, G) means that the motif M is present in the regulatory region of the gene G; canBind(G, M ) means that gene G codes for a transcription factor which can bind to motif M ; and miRel(G, G′) represent that genes G and G′are related by mutual information, that is, this edge is conserved by C3NET protocol. The predicate inOperon(G, O) is used to group a set of genes G into an operon O. Several genes can be part of the same operon, but no gene can be in two operons.
The first ASP program takes each gene pair related by mutual information and looks for shared motifs either in their upstream region or in the respective promoting region for operons which can regulate indirectly. Since
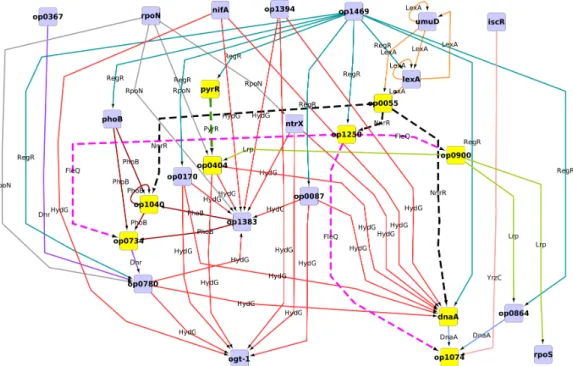
Figure 1. Core regulatory network of A. ferrooxidans. Nodes stand for operons, while colored edges stand for different transcription
factors transcribed by the operons. This graph represents the connected component of the union of all optimal solutions, being its intersection represented by yellow nodes and dashed edges. Different operons having a common predecessor in the graph contain genes which are correlated in mutual information outputs. To facilitate visualization we show only the operons involved in at least one of the optimal solutions and omit “leaf” operons, that is, those that not control other operons.
mutual information is an index of a related behavior, we expect that each mutual-information-related gene pair should share at least one motif in the sense previously described. We found only one case: AFE 0560 and AFE 2588 are two hypothetical proteins, each in a monocystronic operon, related by mutual information but no common motif was found. This will be further examined, but in a first instance we ignore them.
Leaving this particular case aside we can restrict the model to forbid mutual information relationships which can not be explained. Since several TFs are represented by many genes, we explore the combinatorial space looking for the smallest subsets of TFs satisfying the constraints given by mutual information. This optimization procedure, made feasible by ASP code, also reduces the number of binding site motif used. For each gene G that can bind we generate an eventual bound instance
{bound(G, M )} ← canBind(G, M ).
In ASP syntax this means that for each gene G which can bind to motif M , there will be at most one instance of bound(G, M ), or none. This is the key part of the program, as this generates all the combinatorial possibilities. Then a motif M controls an operon O either if it is directly upstream it or if there is a transcript factor G mediating
controles(M, O) ← upstream(M, G), inOperon(O, G).
controles(M, O) ← controles(M, O′), inOperon(O′, G′), bound(G′, M′), upstream(M′, G), inOperon(O, G).
Now a mutual information link is explained when there is a motif M that can control both
explained(O, O′) ← controles(M, O), controles(M, O′), inOperon(O, A), inOperon(O′, B), miRel(A, B).
So the main restriction is that all mutual information links must be explained, or equivalently, no mutual information link must remain unexplained
← miRel(A, B), inOperon(O, A), inOperon(O′, B), not explained(O, O′).
Under this ruleset we minimize the number of bound(G, M ) predicates, that is, we look for minimization of the number of TFs used, which can explain the observed mutual information relationships, in particular when
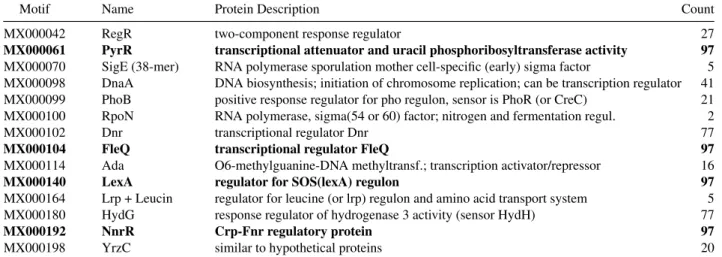
Motif Name Protein Description Count MX000042 RegR two-component response regulator 27 MX000061 PyrR transcriptional attenuator and uracil phosphoribosyltransferase activity 97 MX000070 SigE (38-mer) RNA polymerase sporulation mother cell-specific (early) sigma factor 5 MX000098 DnaA DNA biosynthesis; initiation of chromosome replication; can be transcription regulator 41 MX000099 PhoB positive response regulator for pho regulon, sensor is PhoR (or CreC) 21 MX000100 RpoN RNA polymerase, sigma(54 or 60) factor; nitrogen and fermentation regul. 2 MX000102 Dnr transcriptional regulator Dnr 77 MX000104 FleQ transcriptional regulator FleQ 97 MX000114 Ada O6-methylguanine-DNA methyltransf.; transcription activator/repressor 16 MX000140 LexA regulator for SOS(lexA) regulon 97 MX000164 Lrp + Leucin regulator for leucine (or lrp) regulon and amino acid transport system 5 MX000180 HydG response regulator of hydrogenase 3 activity (sensor HydH) 77 MX000192 NnrR Crp-Fnr regulatory protein 97 MX000198 YrzC similar to hypothetical proteins 20
Table 2. Binding Site Motifs used in any of the optimal solutions. All mutual information relationships can be explained using just
7 TFs at a time, in what we call an optimal solution. There are 97 different optimal solutions, which use only these motifs. The four motifs marked in boldface are used in all solutions, suggesting they play a key role in the transcriptional regulation. Motif and protein identifiers were taken from Prodoric Database.
several genes could encode TFs binding to the same motif. The minimal number of TFs achieved is 7, which can be realized by 97 different configurations. In the union of all 97 optimal solutions there are 14 motifs (see TABLE2) and 27 TFs (see TABLE3), forming a connected subgraph of the initial regulation network, shown in FIG. 1. All operons can be regulated by one of these TFs through binding sites matching one of these motifs. This intersection of all optimal solutions is represented by dashed edges.
As seen in TABLE3, in all 97 solutions the TF PyrR binds to motif MX000061 and regulates the operon op0404, while FleQ binds always to motif MX000104 regulating three operons. Finally, NnrR binds always to motif MX000192 which regulates gene AFE 2696 (op1250) and operons op1040 and op1543 (which contains gene dnaA). At the same time, the motif MX000140 (LexA) was reported in 55 of the 97 instances to regulate gene lexA (AFE 1868), and in the other 42 instances regulates gene umuD (AFE 1750). Both genes encode putative LexA TFs.
The presence in the solution set of several sigma dependent TFs is consistent with the literature, which describes them as part of the basic transcription modification mechanisms. It is worth noticing that the house-keeping sigma-70 appears in only one solution, meaning that it is not involved in the regulations triggered by the experimental conditions. On the other side sigma-54, associated with nitrogen regulation, appears twice, as encoded by gene AFE 2696 in all solutions, and alternatively by genes AFE 0447, AFE 0957, AFE 174, AFE 2955 and AFE 3025. There are also other TFs related to nitrogen assimilation, as AFE 0024 and AFE 1527. This suggests that sigma-54 plays an important role in the adaptation from an pure iron energy source to a medium including sulfur as an energy source.
An enrichment analysis (data not shown) of GO categories associated to all genes in the operons of FIG. 1
shows significative presence of transcription factors, iron-sulfur cluster assembly and lypopolysaccharide trans-port, which has been related to the bioleaching activity of A. ferrooxidans.
4 Conclusions
We have presented an hybrid method for regulatory network reconstruction, which combines probabilistic tools for identification of regulatory elements and experimental relationships, with ASP logical programming to identify the core regulation elements consistent with experimental evidence considering the whole space of possible configurations between regulators and correlated genes. This last point is essential when comparing our approach with other integrative approaches, such as DISTILLER [28] which cannot afford exploring the whole space of configurations and therefore introduces additional criterias of minimum number of correlated genes and regulators in the motifs that could generate biased results.
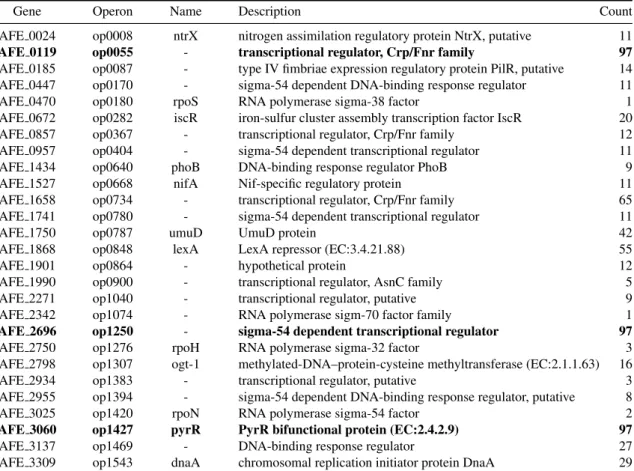
Gene Operon Name Description Count AFE 0024 op0008 ntrX nitrogen assimilation regulatory protein NtrX, putative 11 AFE 0119 op0055 - transcriptional regulator, Crp/Fnr family 97 AFE 0185 op0087 - type IV fimbriae expression regulatory protein PilR, putative 14 AFE 0447 op0170 - sigma-54 dependent DNA-binding response regulator 11 AFE 0470 op0180 rpoS RNA polymerase sigma-38 factor 1 AFE 0672 op0282 iscR iron-sulfur cluster assembly transcription factor IscR 20 AFE 0857 op0367 - transcriptional regulator, Crp/Fnr family 12 AFE 0957 op0404 - sigma-54 dependent transcriptional regulator 11 AFE 1434 op0640 phoB DNA-binding response regulator PhoB 9 AFE 1527 op0668 nifA Nif-specific regulatory protein 11 AFE 1658 op0734 - transcriptional regulator, Crp/Fnr family 65 AFE 1741 op0780 - sigma-54 dependent transcriptional regulator 11
AFE 1750 op0787 umuD UmuD protein 42
AFE 1868 op0848 lexA LexA repressor (EC:3.4.21.88) 55 AFE 1901 op0864 - hypothetical protein 12 AFE 1990 op0900 - transcriptional regulator, AsnC family 5 AFE 2271 op1040 - transcriptional regulator, putative 9 AFE 2342 op1074 - RNA polymerase sigm-70 factor family 1 AFE 2696 op1250 - sigma-54 dependent transcriptional regulator 97 AFE 2750 op1276 rpoH RNA polymerase sigma-32 factor 3 AFE 2798 op1307 ogt-1 methylated-DNA–protein-cysteine methyltransferase (EC:2.1.1.63) 16 AFE 2934 op1383 - transcriptional regulator, putative 3 AFE 2955 op1394 - sigma-54 dependent DNA-binding response regulator, putative 8 AFE 3025 op1420 rpoN RNA polymerase sigma-54 factor 2 AFE 3060 op1427 pyrR PyrR bifunctional protein (EC:2.4.2.9) 97 AFE 3137 op1469 - DNA-binding response regulator 27 AFE 3309 op1543 dnaA chromosomal replication initiator protein DnaA 29
Table 3. Genes encoding the transcription factors used in any of the optimal solutions. These are the elements which can explain
all mutual information correlations in experimental data. A Gene putatively encoding a TF is contained in an Operon (as predicted in ProOpDB), its Name and Description are taken from NCBI’s annotation. Column Count shows the number of optimal solutions in which each transcription factor is used, the ones marked in boldface are used in all solutions. Note that several sigma-54 dependent transcriptional regulators are included, which suggest that this TF plays an important role in adaptation to different energy sources.
We applied this method to A. ferrooxidans, an industrial relevant bacteria whose characteristics difficult classical experimental methods. The proposed network drastically reduces the number of nodes necessary to explain co-expressions in differential expression results, and thus can be a significant contribution to the understanding of the biology of this microorganism.
Our perspective is to improve this network by incorporating signs to the edges, either from experimental data or by homology to other organisms, to get a model which can be used to predict behavior under new experimental conditions. Transcriptional units other than operons can also be considered in an improved version of this model. Those predictions will be eventually validated experimentally.
Acknowledgements
This work was funded by Center for Genome Regulation (Fondap 15090007), Universidad de Chile; Labo-ratory of Bioinformatics and Mathematics of Genome, Center for Mathematical Modeling, UMI 2807 CNRS-Universidad de Chile; INRIA-U. de Chile IntegrativeBioChile Associate Team; a mobility grant from the Inter-national College Doctoral (IDC) of Universit´e Europ´eenne de Bretagne (UEB), INRIA-Conicyt 2010 mobility grant 2010-55 and “Estad´ıas cortas de Investigaci´on para Estudiantes de Doctorado de la Universidad de Chile” grant.
References
[1] B. Alberts, A. Johnson, J. Lewis, M. Raff, K. Roberts, and P. Walter, Molecular Biology of the Cell, 4th edition. Garland Science, 2002.
[2] E. Davidson and M. Levin, “Gene regulatory networks,” Proceedings of the National Academy of Sciences of the
United States of America, vol. 102, p. 4935, Apr 2005.
[3] A.-L. Barab´asi and Z. N. Oltvai, “Network biology: understanding the cell’s functional organization,” Nature
Re-views Genetics, vol. 5, pp. 101–13, Feb 2004.
[4] E. Bouveret and C. Brun, “Bacterial interactomes: from interactions to networks,” Methods Mol. Biol., vol. 804, pp. 15–33, 2012.
[5] J. Baumbach, S. Rahmann, and A. Tauch, “Reliable transfer of transcriptional gene regulatory networks between taxonomically related organisms,” BMC Systems Biology, vol. 3, p. 8, Jan 2009.
[6] A. Grote, J. Klein, I. Retter, I. Haddad, S. Behling, B. Bunk, I. Biegler, S. Yarmolinetz, D. Jahn, and R. M¨unch, “PRODORIC (release 2009): a database and tool platform for the analysis of gene regulation in prokaryotes,”
Nucleic Acids Res, vol. 37, pp. D61–5, Jan 2009.
[7] T. M. Venancio and L. Aravind, “Reconstructing prokaryotic transcriptional regulatory networks: lessons from actinobacteria,” Journal of Biology, vol. 8, p. 29, Jan 2009.
[8] G. Maz´on, J. M. Lucena, S. Campoy, A. R. F. de Henestrosa, P. Candau, and J. Barb´e, “LexA-binding sequences in Gram-positive and cyanobacteria are closely related,” Mol Genet Genomics, vol. 271, pp. 40–9, Feb 2004.
[9] D. Guhathakurta, “Computational identification of transcriptional regulatory elements in DNA sequence,” Nucleic
Acids Research, vol. 34, pp. 3585–98, Jan 2006.
[10] X. Xie, J. Lu, E. J. Kulbokas, T. R. Golub, V. Mootha, K. Lindblad-Toh, E. S. Lander, and M. Kellis, “Systematic discovery of regulatory motifs in human promoters and 3’ utrs by comparison of several mammals,” Nature, vol. 434, pp. 338–45, Mar 2005.
[11] C. Lepoivre, A. Bergon, F. Lopez, N. B. Perumal, C. Nguyen, J. Imbert, and D. Puthier, “TranscriptomeBrowser 3.0 : introducing a new compendium of molecular interactions and a new visualization tool for the study of gene regulatory networks,” BMC Bioinformatics, vol. 13, p. 19, Jan 2012.
[12] C. J. Cellucci, A. M. Albano, and P. E. Rapp, “Statistical validation of mutual information calculations: comparison of alternative numerical algorithms,” Phys Rev E Stat Nonlin Soft Matter Phys, vol. 71, p. 066208, Jun 2005. [13] A. J. Hartemink, “Reverse engineering gene regulatory networks,” Nat Biotechnol, vol. 23, pp. 554–5, May 2005. [14] G. Altay and F. Emmert-Streib, “Inferring the conservative causal core of gene regulatory networks,” BMC Systems
Biology 2010 4:132, vol. 4, p. 132, Jan 2010.
[15] T. A. Brown, Genomes, 2nd edition. Wiley-Liss, 2002.
[16] J. Vald´es, I. Pedroso, R. Quatrini, R. J. Dodson, H. Tettelin, R. Blake, J. A. Eisen, and D. S. Holmes, “Acidithiobacil-lus ferrooxidans metabolism: from genome sequence to industrial applications,” BMC Genomics, vol. 9, p. 597, Jan 2008.
[17] T. L. Bailey, M. Boden, F. A. Buske, M. Frith, C. E. Grant, L. Clementi, J. Ren, W. W. Li, and W. S. Noble, “MEME suite: tools for motif discovery and searching,” Nucleic Acids Research, vol. 37, p. W202, Jul 2009.
[18] C. E. Grant, T. L. Bailey, and W. S. Noble, “FIMO: scanning for occurrences of a given motif,” Bioinformatics, vol. 27, pp. 1017–1018, Apr 2011.
[19] B. Taboada, R. Ciria, C. E. Martinez-Guerrero, and E. Merino, “ProOpDB: Prokaryotic operon database,” Nucleic
Acids Res, vol. 40, pp. D627–31, Jan 2012.
[20] G. Levic´an, J. A. Ugalde, N. Ehrenfeld, A. Maass, and P. Parada, “Comparative genomic analysis of carbon and nitrogen assimilation mechanisms in three indigenous bioleaching bacteria: predictions and validations,” BMC
Ge-nomics, vol. 9, p. 581, Jan 2008.
[21] X. Wang, S. Ghosh, and S. W. Guo, “Quantitative quality control in microarray image processing and data acquisi-tion,” Nucleic Acids Research, vol. 29, pp. E75–5, Aug 2001.
[22] G. Smyth, N. Thorne, and J. Wettenhall, “limma: Linear Models for Microarray Data User’s Guide,” Software
manual available from http://www. bioconductor. org, Jan 2003.
[23] G. K. Smyth, “Limma: linear models for microarray data,” in Bioinformatics and Computational Biology Solutions
using R and Bioconductor(R. Gentleman, V. Carey, S. Dudoit, and W. H. R. Irizarry, eds.), pp. 397–420, New York: Springer, 2005.
[24] R Development Core Team, R: A Language and Environment for Statistical Computing. R Foundation for Statistical Computing, Vienna, Austria, 2009. ISBN 3-900051-07-0.
[25] G. K. Smyth, “Linear models and empirical bayes methods for assessing differential expression in microarray ex-periments,” Statistical Applications in Genetics and Molecular Biology, vol. 3, p. Article3, Jan 2004.
[26] M. Gebser, R. Kaminski, B. Kaufmann, M. Ostrowski, T. Schaub, and M. Schneider, “Potassco: The Potsdam answer set solving collection,” AI Communications, vol. 24, no. 2, pp. 105–124, 2011.
[27] C. Baral, Knowledge Representation, Reasoning and Declarative Problem Solving. Cambridge University Press, 2003.
[28] K. Lemmens, T. De Bie, T. Dhollander, S. C. De Keersmaecker, I. M. Thijs, G. Schoofs, A. De Weerdt, B. De Moor, J. Vanderleyden, J. Collado-Vides, K. Engelen, and K. Marchal, “DISTILLER: a data integration framework to reveal condition dependency of complex regulons in Escherichia coli,” Genome Biol., vol. 10, no. 3, p. R27, 2009.