Publisher’s version / Version de l'éditeur:
Vous avez des questions? Nous pouvons vous aider. Pour communiquer directement avec un auteur, consultez la première page de la revue dans laquelle son article a été publié afin de trouver ses coordonnées. Si vous n’arrivez pas à les repérer, communiquez avec nous à PublicationsArchive-ArchivesPublications@nrc-cnrc.gc.ca.
Questions? Contact the NRC Publications Archive team at
PublicationsArchive-ArchivesPublications@nrc-cnrc.gc.ca. If you wish to email the authors directly, please see the first page of the publication for their contact information.
https://publications-cnrc.canada.ca/fra/droits
L’accès à ce site Web et l’utilisation de son contenu sont assujettis aux conditions présentées dans le site LISEZ CES CONDITIONS ATTENTIVEMENT AVANT D’UTILISER CE SITE WEB.
Research Report (National Research Council of Canada. Institute for Research in
Construction), 2004-03-17
READ THESE TERMS AND CONDITIONS CAREFULLY BEFORE USING THIS WEBSITE. https://nrc-publications.canada.ca/eng/copyright
NRC Publications Archive Record / Notice des Archives des publications du CNRC : https://nrc-publications.canada.ca/eng/view/object/?id=f483f232-c193-4487-8004-d2a9fcf10cf8 https://publications-cnrc.canada.ca/fra/voir/objet/?id=f483f232-c193-4487-8004-d2a9fcf10cf8
Archives des publications du CNRC
For the publisher’s version, please access the DOI link below./ Pour consulter la version de l’éditeur, utilisez le lien DOI ci-dessous.
https://doi.org/10.4224/20378016
Access and use of this website and the material on it are subject to the Terms and Conditions set forth at
Lighting for VDT Workstations 2: Effect of Control and Lighting Design
on Task Performance and Chosen Photometric Conditions
Lighting for VDT Workstations 2: Effect of Control and Lighting
Design on Task Performance, and Chosen Photometric Conditions
Newsham, G.; Veitch, J.; Arsenault, C.;
Duval, C.
IRC-RR-166
March 2004
Lighting for VDT workstations 2:
Effect of control and lighting design on task performance,
and chosen photometric conditions
Guy Newsham, Jennifer Veitch, Chantal Arsenault, Cara Duval
Institute for Research in Construction
National Research Council Canada, Ottawa, ONT, K1A 0R6, Canada
IRC Research Report RR-166
Lighting for VDT workstations 2: Effect of control and lighting design on task performance, and chosen photometric conditions
Guy Newsham, Jennifer Veitch, Chantal Arsenault, Cara Duval
Executive Summary
This experiment was conducted in a mock-up office space laboratory. 118 participants worked for a single day under one of four lighting designs (Figure A). They had no control over the lighting until the second half of the afternoon, when all participants were offered some form of individual dimming control. During this working day participants completed a variety of simulated office tasks and questionnaires related to mood,
satisfaction, and discomfort. An earlier report [Newsham et al., 2003] described initial data analysis of questionnaire outcomes and photometric data. In this report we supplement this information with analysis of the task performance data and more detailed photometric data. For completeness, this Executive Summary will summarize the findings of the experiment as a whole.
Introducing individual lighting control improved ratings of mood, satisfaction and discomfort, but did not improve task performance. We
recommend a longer-term study in a real office setting to examine if the mood, satisfaction and discomfort benefits persist, and if benefits to
task performance, or other outcomes important to organisations, emerge. Several other studies have demonstrated energy and satisfaction benefits associated with individual lighting controls, a new field study focussed on organisational performance measures might generate results to contribute to a more convincing economic case for adoption of such controls.
Figure A. The four lighting designs employed in this experiment. Design 1 features ceiling-recessed parabolic system only; Design 2 was the same as Design 1, with the addition of a custom partition-washer; Design 3 was the same as Design 1, with the addition of a task light; Design 4 featured a workstation-specific dimmable direct/indirect fixture and a task light.
Design 4 Design 3 Design 2 Design 1 0 10 20 30 40 |∆ Edesk| 0.5 -2 -1 0 1 2 3 4 -4 -3
Further, our results suggest that is not simply the availability of control that brings benefits to the user, but exercising control to achieve preferred conditions. The participants who made the biggest changes to luminous conditions tended to experience the biggest benefits, those who made little change to luminous conditions experienced little or no benefit (Figure B shows one example).
Figure B. The effect of the size of change in desktop illuminance (post-control – pre-control) on the change in rating of Satisfaction with Lighting (post-control – pre-control).
On average, chosen luminous conditions tended to conform to existing recommended practice for office lighting, although individual choices exhibited wide variety. We also saw that many people varied their lighting choices according to the task they were doing. For lighting practice this implies
that control systems should be easily accessible, easy to understand, and able to effect substantial changes in conditions.
One of the lighting designs we employed provided a custom partition washer designed to provide additional vertical illumination (Design 2 in Figure A). The hypothesis was that in the modern office, where most tasks are performed on a vertical computer screen, the ability to control vertical
illumination in the field of view would be of benefit. We also thought that participants would use less ambient light from ceiling-recessed fixtures if given the means to light vertical surfaces with another system. The partition-washers were used when available, to substantially elevate vertical luminance in the field of view. However, they were not associated with significant improvements in mood, satisfaction and discomfort, or improvements in task performance. Neither did their use offset the preferred output of ceiling-recessed, parabolic, ambient lighting. Therefore, we must conclude that providing additional partition lighting in this way is unlikely to be of value in practice.
Figure C. Examples of the effect of lighting design on task performance. Shown are the statistically-significant main effects of providing task lighting on typing speed (left) and alertness/vigilance (right).
Similarly, provision of supplemental task lighting (Design 3 in Figure A) did not significantly improve ratings of mood, satisfaction and discomfort, or offset the preferred output of ceiling-recessed, parabolic, ambient lighting. However, our results do suggest a benefit on the performance of some tasks (Figure C shows examples).
Recommended practice documents for office lighting commonly suggest that a
straightforward route to lighting energy savings is to lower ambient lighting levels and to compensate with task lighting. Our findings suggest that the benefits of task lighting might not lie in energy savings, but in task
performance improvements. Therefore, we recommend future research into the energy and human factors effects of task lighting to better understand the true benefits.
Finally, one of the lighting designs we studied was chosen to resemble a new, low-energy lighting design being installed in Canadian Federal Government buildings. It featured a workstation-specific dimmable direct/indirect fixture and a task light (Design 4 in Figure A), and has been proposed as a lighting design to maintain satisfaction while saving energy. Our results showed that in terms of mood, satisfaction, discomfort and task performance outcomes, this design was generally neither better nor worse than the other designs we studied. However, results from this project and earlier work indicate that some participants prefer light levels outside the range provided by this design. Modifying this design to offer a greater range of illuminances might prove beneficial.
Table of Contents
1. INTRODUCTION ...5
2. METHODS & PROCEDURES ...10
2.1 SIMULATED OFFICE TASKS...10
2.2 PHOTOMETRIC MEASUREMENTS...14
3. RESULTS & DISCUSSION ...17
3.1 WHAT ARE OCCUPANTS’ PREFERRED LUMINOUS CONDITIONS? ...17
3.2 WHAT ARE THE EFFECTS ON TASK PERFORMANCE? ...29
3.3 WHAT IS THE EFFECT OF GETTING LIGHTING CONTROL ON TASK PERFORMANCE? ...49
3.4 IS THERE AN EFFECT OF LIGHTING DESIGN? ...57
4. FURTHER DISCUSSION ...58
4.1 WHAT ARE OCCUPANTS’ PREFERRED LUMINOUS CONDITIONS? ...58
4.2 WHAT IS THE EFFECT OF LIGHTING CONTROL ON MOOD, SATISFACTION, AND TASK PERFORMANCE?...58
4.3 IS THERE AN EFFECT OF LIGHTING DESIGN, AND IS ADDITIONAL VERTICAL LUMINANCE BENEFICIAL? ...59
5. CONCLUSIONS...59
6. ACKNOWLEDGEMENTS ...60
1. INTRODUCTION
Current recommended practice for VDT office lighting suggests that the luminance of vertical surfaces in the field of view is just as important in determining lighting quality in open-plan offices as desktop illuminance [IESNA, 2000]. However, typical direct ambient lighting systems are more efficient at lighting the desktop than vertical surfaces, which is understandable given that delivering horizontal illuminance has been the focus of the office lighting industry for many decades. Another one of the main goals of office lighting design has been to reduce reflected glare in computer screens. This is commonly done using ceiling-recessed fixtures with parabolic louvers; a side-effect of this luminaire design is that light distribution to vertical surfaces is compromised. This is unfortunate given the results of an experiment by Berrutto et al. [1997]. They constructed mock-up private offices where participants had control of five lighting circuits, including wall washers. Their results stressed the importance of the wall luminance in participants’ lighting choices. One goal of the experiment
described in this report was to examine if the luminance of partial-height partitions (the most common type of office enclosure in North America) is similarly important.
Previous work in mock-up open-plan offices has generated much useful information about preferred lighting conditions [Newsham & Veitch, 2001; Veitch & Newsham, 1998; Veitch & Newsham, 2000a; Veitch & Newsham, 2000b; Newsham et al., 2002a]. An understandable shortcoming in the
experimental designs was the inability to physically separate the luminance of different surfaces. This is inevitable with typical ambient lighting systems: parameters such as desktop illuminance and partition luminance are highly intercorrelated. This causes a problem experimentally, because it is very difficult to determine which surfaces are most important for occupant satisfaction. The most energy-efficient use of light might rest on lighting the most important surfaces while not “wasting” light on unimportant surfaces. It is possible that lighting designed to illuminate open-office partitions efficiently will produce a luminous environment that is more satisfactory to the occupants than traditional designs, and at lower power draw. For the purposes of this experiment, we built a custom “partition washer” designed to preferentially light the office partitions.
It is often suggested that providing light local to the task area can compensate for substantial reductions in ambient lighting and lighting energy consumption [Tiller et al., 1995], while providing a satisfactory luminous environment [Veitch & Newsham, 1998; New Buildings Institute, 2001; Hedge, 1998]. For example, Yamakawa et al. [2000] conducted a study of task-ambient lighting use in a mock-up office space. In their study, participants were exposed to ambient lighting from ceiling-recessed parabolic fixtures at one of three fixed levels of 200, 300 or 400 lx. Participants then used a dimmer control to select a preferred level of output from a task light. On average, a 100 lx reduction in ambient lighting was compensated by only a 30 lx increase in task lighting. In our experiment we explored whether local partition or task lighting can displace ambient lighting to deliver net energy savings.
In addition, this experiment also investigated the benefits of providing individual lighting control. Surveys consistently indicate that building occupants both desire more control over their environment, including lighting, and believe that such control is linked to important health and performance
outcomes [Steelcase 1999; Bordass et al., 1993]. Several recent laboratory and field studies have demonstrated that individual lighting control is associated with satisfaction benefits and energy savings [Boyce et al., 2000; Jennings et al., 2000; Veitch & Newsham, 2000a; Moore et al., 2002; Maniccia et al., 1999; Escuyer & Fontoynont, 2001].
Further, this experiment specifically tested the hypothesis that working under lighting conditions that match the occupant’s personal preference (or close to it) will improve satisfaction and task
performance (the positive affect hypothesis). Baron has demonstrated this effect with fragrances [Baron & Thomley, 1994] and, to a lesser extent, with lighting conditions (fluorescent lamp type and horizontal illuminance) [Baron et al., 1992]. Newsham & Veitch [2001] also obtained supporting results with regard to luminous conditions. Their data came from participants who occupied a mock-up office space for a day and completed various simulated office tasks and questionnaires. They
examined data from participants who worked under a fixed, pseudo-random lighting condition during the day, and made their own preferred lighting choice at the end of the day. Participants whose daytime light levels were closest to their own preference had significantly better ratings of mood (pleasure), lighting satisfaction, and environmental satisfaction.
Newsham et al. [2002b] conducted a pilot study designed to address some of the issues outlined above. They demonstrated a significant improvement in satisfaction with lighting after dimming control over a single circuit was introduced in a mock-up office space. Further, their data indicated that participants desired an increased level of partition illuminance (delivered using a partition
washer) beyond that provided by a conventionally-designed ceiling-recessed parabolic system alone. The experiment described in this report grew out of this pilot study.
This report should is a continuation of an earlier report “Lighting for VDT workstations 1: Effect of control on energy consumption and occupant mood, satisfaction and discomfort” [Newsham et al., 2003]. The earlier report and the current report both detail the results of an experiment carried out in a mock-up office laboratory at NRC. One-hundred-and-eighteen participants, recruited from a local temporary-employment agency, worked in the laboratory for one day each. They worked on simulated office tasks, and completed a variety of questionnaires regarding their mood, satisfaction, and discomfort. Up to two participants worked on each day, housed in identical workstations. Each participant worked under one of four office lighting designs (see Figure 1a and 1b). Design 1 was a conventional, ceiling-recessed, parabolic ambient lighting system; Design 2 used the same ambient lighting system as Design 1, with the addition of a custom, partition washer; Design 3 used the same ambient lighting system as Design 1, with the addition of an angle-arm task light; Design 4 used a suspended direct/indirect fixture for ambient light, and the same angle-arm task light used in Design 3. All designs offered dimming control over the ambient lighting system; Design 2 offered additional dimming control over the partition washer. In addition, Designs 3 and 4 allowed movement of the task light’s arm. Details on the lighting designs are available in Newsham et al. [2003].
Participants worked under one of four fixed initial lighting conditions until mid-afternoon, after which participants were invited to choose their preferred light level using dimming controls on their computer desktop. The full details of the experimental design are given in Newsham et al. [2003].
The experiment was designed to address several research questions: 1. Does providing task/partition lighting reduce ambient lighting use? 2. What are occupants’ preferred luminous conditions?
3. What is the effect of getting lighting control on mood, satisfaction, and task performance? 4. What is the effect of working under non-preferred lighting conditions on mood, satisfaction,
and task performance?
5. Is there an effect of lighting design, and is additional vertical luminance beneficial? Newsham et al. [2003] analysed data relevant to questions 1, 2 (desktop illuminance and partition illuminance at a single representative point only), 3 (mood and satisfaction effects only), 4 (mood and satisfaction effects only), and 5 (mood and satisfaction effects only). Results showed that while people chose to use the task/partition lighting, such use did not reduce average preferred levels of the parabolic ambient lighting. There was strong evidence that having dimming control over lighting, and using it to create preferred conditions, led to improvements in mood, satisfaction, and physical comfort.
This report addresses questions 2 through 5 with reference to more detailed photometric data, and to task performance outcomes. The Discussion and Conclusions sections of this report will address the experimental findings as a whole, encompassing the analysis in Newsham et al. [2003], and the analysis in this report.
Design 4 Design 3
Design 2 Design 1
Figure 1a. Photograph of each lighting design in the experimental facility. Workstation A is shown, Workstation B was identical (in mirror-image), with the partition behind the computer screen shared
Letter
Code Description
P 1’ x 4’ deep-cell (2x16 cells) semi-specular parabolic louvre fixtures, recessed in the ceiling.
2 x 32W T8 lamps (3500K); Electronic dimming ballast (5-110%). I 10” x 4.5’ Direct/indirect fixtures, suspended 18” from the ceiling.
2 x 32W T8 lamps (3500K); Electronic dimming ballast (5-110%). W Partition washer: 3 x 2’, cantilevered from partition
1 x 17W T8 lamp each (3500K) + 50% neutral density filter Electronic dimming ballast (5-110%).
D Angle-arm task light; 1 x 18Wquad CFL (4100K) C Pot light for corridor area.
1 x 50W PAR 20 Halogen floodlight.
C C C C C C C C Design 4 C D D I I Design 3 C Design 2 C Design 1 C P P D P D P P P P P P P P P P P P P W W P P P P P P P P
Figure 1b. Schematic diagram (plan view) of the luminaire layout for each lighting design. Luminaire descriptions are shown in above table.
2. METHODS & PROCEDURES
A full explanation of methods and procedures was given in Newsham et al. [2003]. Descriptions of the daily schedule and the simulated office tasks, relevant to the analyses presented in this report, are repeated below.
Table 1 shows the model experimental schedule followed with each participant. Note that when participants returned from the afternoon coffee break on-screen instructions informed them that they now had control over the lighting assigned to their workstation. In Design 1 this meant dimming control over the recessed parabolics (one circuit). In Design 2 this meant dimming control over the recessed parabolics (one circuit), and the partition washer (one circuit). In Design 3 this meant dimming control over the recessed parabolics (one circuit), and the ability to move the arm of the task light. In Design 4 this meant dimming control over the suspended direct/indirect fixture (one circuit), and the ability to move the arm of the task light.
2.1 Simulated Office Tasks
The simulated office tasks completed by the participants were as follows:
Vision Test. We measured contrast sensitivity using custom software. A square target grating was
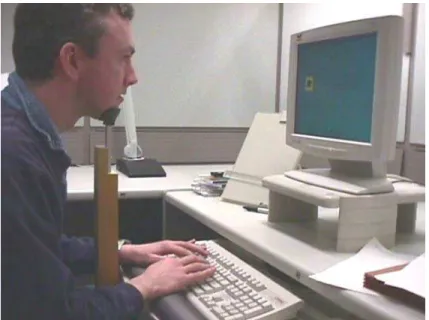
presented on the computer screen (see Figure 3), and the participant’s task was to indicate, as fast as they could, whether they saw a target or not by pressing a ‘Yes’ or ‘No’ key on the keyboard. The absolute luminances of the background and target grating depended on the prevailing illumination. The characteristics of the prevailing illumination, and the LCD backlighting, meant that there was also a luminance gradient across the screen. As an example, with lighting from ambient parabolics only at 50% output, the luminance just above the target grating was 27 cd/m2, and just below the grating was 21 cd/m2. The grating varied in luminance contrast from 0 to 16 grey levels above or below the grey level of the screen background (which was set to grey level 128 on the range 0 to 255). In the example above, a grey level difference of 16 corresponded to a luminance difference of ~ 6 cd/m2. The target was varied by foreground:background contrast, orientation (lines horizontal or vertical), and size (width of the grating lines within the fixed-size target). Thirty-six combinations of these target parameters were presented in a randomised order each time the task was completed. We recorded both accuracy and speed of detection as outcomes. This was the only task where we controlled task-eye geometry. Participants positioned their head in a chin cup, which was 40” (1.02m) from the floor, and 20” (0.51m) from the computer screen, as shown in Figure 2.
Simple Cognitive/Clerical Performance. This was assessed using a typing task scored for speed and
accuracy. In this task, participants retyped three ~300-word passages from printed originals. The three passages were presented in differing font sizes: 8, 12, and 16 point Times Roman, while the on-screen font size was always 12 point. The software required participants to type the text correctly; speed and number of errors were automatically recorded. Participants were asked to place the paper on a document holder (not adjustable), which was at a fixed location on the desk close to the
computer screen.
Complex Cognitive Performance. There were three measures of this construct. All were based on
short articles on popular topics broadcast in the popular media. The selected articles were 200-300 words long.
1. Article Categorisation. The participant saw a 40-60-word summary of a given article (the first 3 or 4 sentences), shown in 12-point type. Below the article was a list of 4 categories into which the article might be placed. In half of the summaries some words of text were highlighted; the highlighted text was designed to indicate a key phrase in the text to aid categorisation. The task was to read the summary and to place it in one of four categories, based on subject matter. Dependent measures were the time required to perform the categorisation, and accuracy of categorisation (correct responses were established by independent ratings from three researchers).
2. Summary Evaluations. Clicking 'Done' after the categorisation question caused a rating question to appear, in which the participant indicated on a 0-100 slider their interest in reading the whole article based on just the summary. Clicking "Done" after this question caused the screen to refresh. The entire article appeared in another box, along with the summary and an area in which there were three more rating questions. The participants were asked to indicate their agreement with the following statements: "The summary contains all the important facts expressed in the full article"; "The summary is grammatically correct"; "The summary is well written". Responses were on a 5-point scale from Strongly Disagree to Strongly Agree (0-4).
3. Summary Extraction. Participants read an article (~300 words) on paper. When they had finished, a list of all the sentences appearing in the article in sequential order appeared on screen.
Participants were asked to indicate the 4 most important sentences in the article in conveying the meaning of the article (by checking a box beside the sentences they chose). This task is much easier to score than summaries generated from free composition. The dependent measure was the time taken.
Conflict Resolution. Participants read scenarios describing common workplace conflicts, then
responded using multiple choice to indicate their preferred conflict resolution styles: Competition, Accommodation, Collaboration, Compromise, or Avoidance. It was based on the 2-dimensional model of conflict proposed by Thomas [Kilmann & Thomas, 1977; Thomas, 1976].
Vigilance/Alertness. There was always an envelope icon on the computer screen in a fixed location.
Participants were instructed that when the icon changed colour and they heard a 'beep', they were to click on the icon as quickly as possible. The dependent variable was the time taken to respond to the event. These events occured at pre-determined randomized intervals (but not during any other timed task, to avoid software conflicts). One outcome from the NRC conveyor belt task (described below) also provided a measure of vigilance/alertness.
Motivation/Persistence. The NRC conveyor belt task, with a simple target moving at higher and
higher speeds, was the measure of persistence. Symbols entered the screen from the left, travelling along a black line that represents a conveyor belt. Certain symbols were designated as targets. When targets crossed the screen into a box called the 'removal area', participants were instructed to remove them as quickly as possible by pressing the spacebar on the computer keyboard.
Participants were instructed to stop responding when they could no longer keep up. The dependent measure of persistence was the maximum speed at which they stopped responding. This measure is analogous to the paper-based task developed by Feather [1962], in which participants try to complete impossible puzzles. We also measured the rate of correct target removal.
Work Structure. For the typing, conveyor belt, and summary extraction tasks, we also recorded the
length of the time intervals taken by the participant between completing one part of the task and starting the next. These were analyzed to give an indication of whether or not lighting conditions altered the work strategies of participants, as had been observed in a prior experiment [Boyce & Eklund, 1996].
T .
Approx. Time Duration (min) Task
able 1. Model experimental schedule for each participant
8:45 a.m. 15 Arrival, greeting, instructions, consent,
assignment to workstations 9:00 5 Vision Test I 9:05 10 Response training Demographics Visual Comfort I Physical Comfort I Room Appraisal I
9:15 15 Training - Typing, Summarizing
Task Competence: Self-set goals
9:30 20 Training - Categorization, Conveyor Belt
9:50 10 Lighting Preferences I Mood I Environmental Competence I 10:00 15 Break 10:15 15 Typing I 10:30 15 Summarizing I 10:45 20 Categorization I 11:05 10 Conveyor Belt I 11:15 30 Conflict Resolution 11:45 60 Lunch 12:45 15 Typing I 1:00 15 Summarizing I 1:15 20 Categorization I 1:35 10 Conveyor Belt I 1:45 20 Mood II Room Appraisal II Lighting Preferences II Visual Comfort II Physical Comfort II Workplace Satisfaction I 2:05 5 Vision Test II 2:10 15 Break
2:25 10 Instructions on Using Lighting Controls
2:35 15 Typing I
2:50 15 Summarizing I
3:05 20 Categorization I
3:25 10 Conveyor Belt I
3:35 20 Mood III
Room Appraisal III Lighting Preferences III Visual Comfort III Physical Comfort III
Environmental Competence II Workplace Satisfaction II Lighting Control Evaluation
3:55 5 Vision Test III
4:00 5 Workday Experiences
2.2 Photometric Me
Durin tal session i at two fixed positions in each workstation
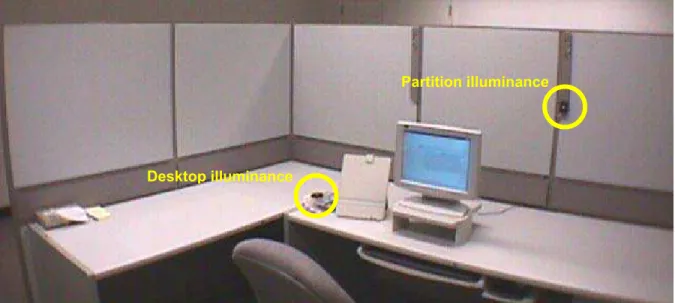
using Minolta T-10M illuminance meters. The measurement points are shown in Figure 4; these positions were chosen as typical desktop and partition illuminance spot measurements. Readings were taken automatically every time a control action was taken by a participant, and were also triggered manually by the experimenter at the start of the day, and during breaks.
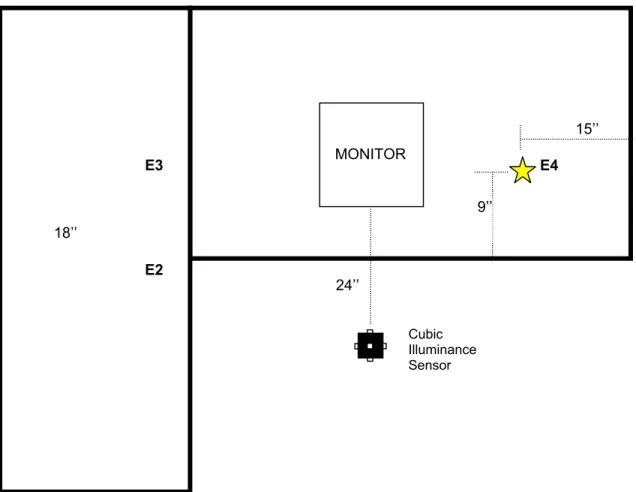
Newsham et al., [2003] provided data on the illuminance conditions chosen by the participants, for the two fixed points in each workstation. Following completion of all experimental sessions, the dimmer settings and illuminances recorded during the experimental sessions were used to recreate the lit environments experienced by the participants. The dimmers were set to the values used/chosen at a particular point during the experimental session, and the resulting illuminances at the two fixed points were checked against those recorded during the experimental session to ensure that the conditions had been faithfully reproduced. Then a larger set of luminance and illuminance measurements were taken, as shown in Figures 5 and 6. Luminance measurements were made with a tripod-mounted Topcon BM-3 luminance meter with a 2o field of view, and illuminance measurements were made with Minolta T-1 illuminance meters.
Figure 4. Fixed photometric measurement points in Workstation A; two more illuminance sensors were placed at identical points in Workstation B.
asurements
g the experimen we recorded illum nance
Partition illuminance
18’’ 18’’ E1 24’’ Cubic Illuminance Sensor
Figure 5. The locatio inance measurements made when the conditions were
recreated. Locations for Workstation A are shown, Workstation B locations mirrored these.
MONITOR 15’’ 9’’ 18’’ E2 E3 E4
MONITOR 12’’ 21.5’’ 33’’ 2’’ 15’’ 27.25’’
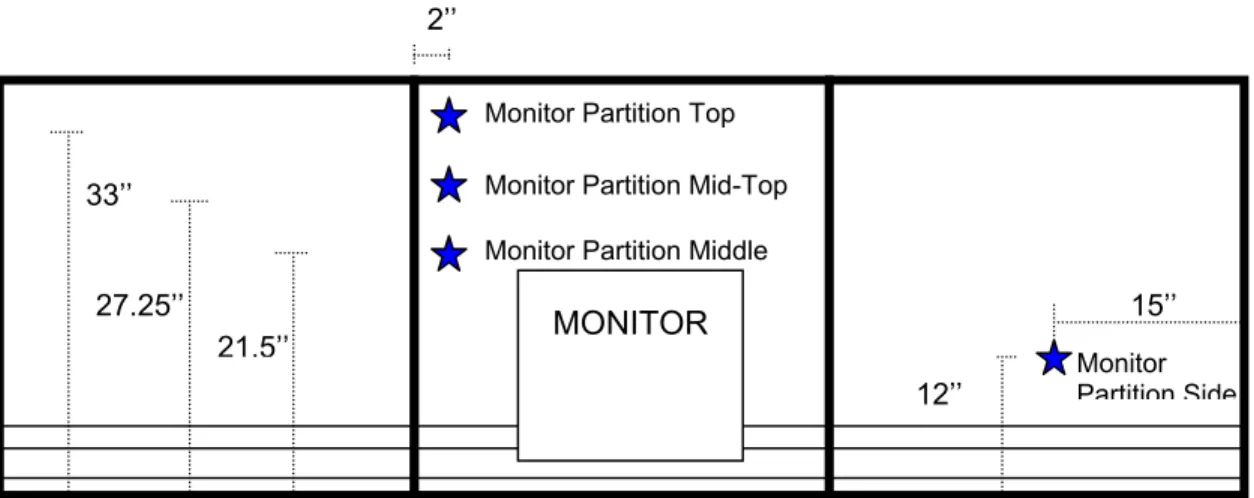
For workstation A there w additional luminance measurement point on the wall to he right of the computer screen (left in workstation B), 52” from the fl nd 55” from the partition behind the computer screen. The luminance measurement on the ceiling was made at a point directly above the seated participant.
Monitor Partition Top Monitor Partition Mid-Top Monitor Partition Middle
Mo Partition Side nitor as an oor, a
33’’ 2’’
With the workstation A participant facing their computer screen, this partition was to their left (right in workstation B), adjacent to the corridor. That part of the partition above the desktop is shown.
Corridor Partition Top
Corridor Partition Mid-Top
10’’
21.5’’
Corridor Partition Middle
Figure 6. The location of the additional luminance measurements made when the conditions were recreated. Locations for Workstation A are shown, Workstation B locations mirrored these.
3. RESULTS & DISCUSSION
As described in the Introduction, the experiment was designed to address several research questions:
1. Does providing task/partition lighting reduce ambient lighting use?
2. t are occupants’ preferre
3. What is the effect of getting li , satisfaction, and task performance?
4. What is the effect of working hting conditions on mood, satisfaction,
k performance?
5. Is there a ct of lighting design tional vertical luminance beneficial?
As stated above, this report addresses questions 2 through 5 with refe o
photometric data, and to task performance outcomes. Each of these questions is addressed with reference to the collected data in the sub-sections below.
3.
Se er
de er of different conditions created by the participants during the session. For
all participants, we made measurements at the following times:
1. The initial lighting conditions, pre-contr uring the morning coffee break
2. The lighting conditions after first use of control (experimenting with the controls was ignored, only the choice that participants settled on was measured)
After that, any change of c ed for more than a few minutes, was recorded.
We assumed that a reasonable error related to this kind of measurement, accounting for
instrumentation accuracy, lumen depreciation, and any other differences between the room between
the original experimen on which the conditions were reproduced, was 10%.
Therefore, any condition for which the difference between the original and reproduced measurements at the four fixed locations totalled more than 40% (4 x 10%) was dropped from the dataset. For Design 1, 7 out of 125 total measurements were dropped in this manner; for Design 2 none were
dropped; for Design 3, for n 4, 10 out of 109 were dropped. The
designs featuring the angle-arm task light (Design 3 and 4) tended to have a greater number of dropped cases. This is because of the ability the participants had to change the position of the task light arm. We recorded the position of the arm at the end of each experimental session, but had no
way of recording oon. Differences in
task light locatio ns.
Table 2 shows the illuminances measured at the four fixed locations for the four initial conditions for each lighting design, when the conditions were rep uced. For comparison, look at Table 2 in Newsham et al. [2003] – the values are very simila suggesting that our ability to reproduce luminous conditions was acceptable. The mean percentage difference across all designs was 3.0% for
w work
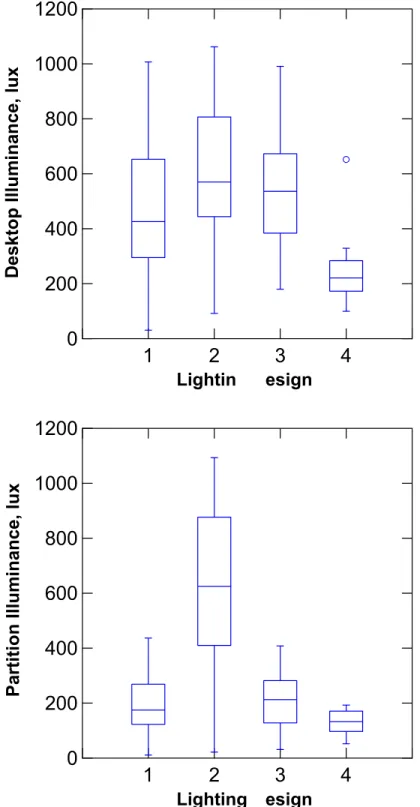
Table 3 shows the illuminances measured at the four fixed locations for the four initial conditions for each lighting design, when conditions were reproduced; data for participant choices after first control, and after the final control action made in the space are shown. These data are summarized in Figure 7. All participants used the dimmers when control was first offered. On 15 experimental days (out of 62) participants made no further adjustments in the experimental session, in these cases the final control photometric measurements are the same as the first control measurements. Table 3 shows that, on average, participant choices did not change substantially from first to final control.
Differences in means are rarely >100 lux though, interestingly, the general tendency is for mean illuminance to decline from first to final control. Final control does represent choices made after a longer exposure to the space and to the tasks, therefore, for the remainder of the descriptive
Wha d luminous conditions?
ghting control on mood under non-preferred lig and tas
n effe , and is addi
rence to m re detailed
1 What are occupants’ preferred luminous conditions?
veral sets of post-session measurements were made for each participant, the exact numb pending on the numb
ol, d
ondition that prevail
tal session and the day
16 out of 99 were dropped; Desig
if the task light was in other locations during the session aftern n could make a big difference to recorded luminous conditio
rod r,
orkstation A desktop, 3.2% for workstation A partition, 2.6% for workstation B desktop, and 2.4% for station B partition.
photometric data, we will present conditions prevailing at the time of final control only. Table 3 also after final control, there is no systematic difference in means based n the initial conditions at the start of the day. This is a welcome finding, suggesting that individual
the f the descriptive photometric data, we will present conditions by lighting design over all
initi sign because of the very
diffe Tab
action; summarized in Figure 8. For Design 1, the dimmable recessed
par l ange,
onsistent with other studies of office worker preferred luminances [Newsham et al., 2002; Veitch & gn 3 tition behind the computer screen. For that artition, chosen luminances are 3-4 times the preferred luminances observed in the other studies
e partition washer off, which would ave made Design 2 essentially the same as Design 1. This suggests that preferred luminances are
ns ns, Design 4 had the only ambient
ligh minance than that
pre n
s of e cubic illuminance sensor, placed approximately where a seated participant’s head would have
ions after
or
able 6 shows illuminance ratios, derived from the cubic illuminance measurements; these data are e :1 are faction outcomes. It is possible that the side:side and front:back ratio effects nded to cancel out leading to the almost null effect of design on satisfaction. However, a future
re, shows that, for the illuminances
o
preferences for office lighting are intrinsic, and not biased by initial conditions. Therefore, for remainder o
al conditions combined. We will maintain the presentation by lighting de rent lighting equipment used in each of the designs.
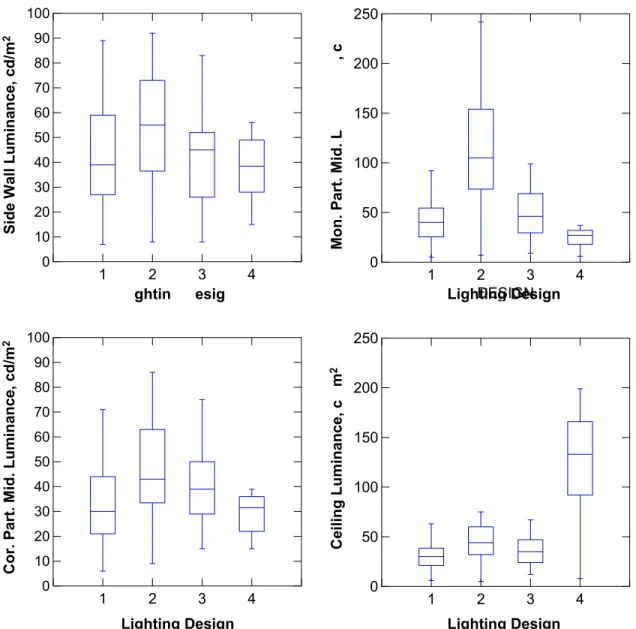
le 4 shows the luminances measured at various points in the workstations, after the final control data for select points are
abo ics, the average chosen luminances on the vertical surfaces are in the 30-40 cd/m2 r c
Newsham, 2000a; Loe et al., 1994; Berrutto et al., 1997]. The addition of the task light in Desi increases luminances on the partitions by ~ 5 cd/m2. The partition washer in Design 2 increases measured luminances considerably, particularly on the par
p
referenced above, remember, participants could have turned th h
somewhat dependent on the lighting equipment available. In Design 4, the total number of lume available was considerably lower than in the other designs, and the chosen luminances on the partitions are consequently lower. However, unlike the other desig
ting fixture with an uplight component, leading to a considerably higher ceiling lu vaili g in the other designs.
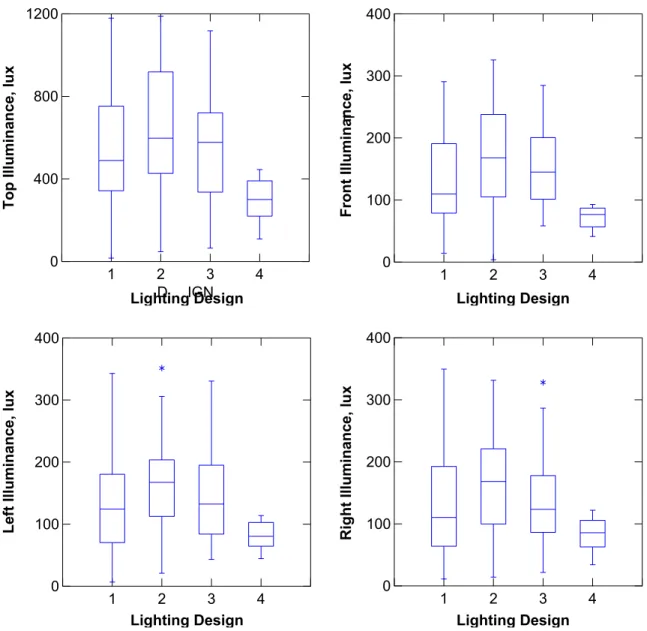
Table 5 shows the illuminances measured at various locations on the desktop, and on the six face th
been; data for select illuminances are summarized in Figure 9. Again, data refer to condit the final control action. For Design 1, with recessed parabolic fixtures, the average chosen illuminances are in the 350-500 lux range, consistent with other studies of office worker preferred illuminances [Veitch & Newsham, 2000a; Newsham & Veitch, 2001]. Also consistent with previous work was the wide range of individual preferences, from virtually zero illuminance, up to 1000 lux more. The addition of the task light in Design 3 increases illuminances compared to Design 1, particularly at the E1 location, close to the default position of the task light. The partition washer in Design 2 increases illuminances compared to Design 1, the biggest increases occurring at the locations closest to the partition where the washer was mounted. Design 4 generally had lower chosen illuminances than the other Designs. However, it did allow for a relatively high illuminance at the E1 location, below where the fixture was mounted.
T
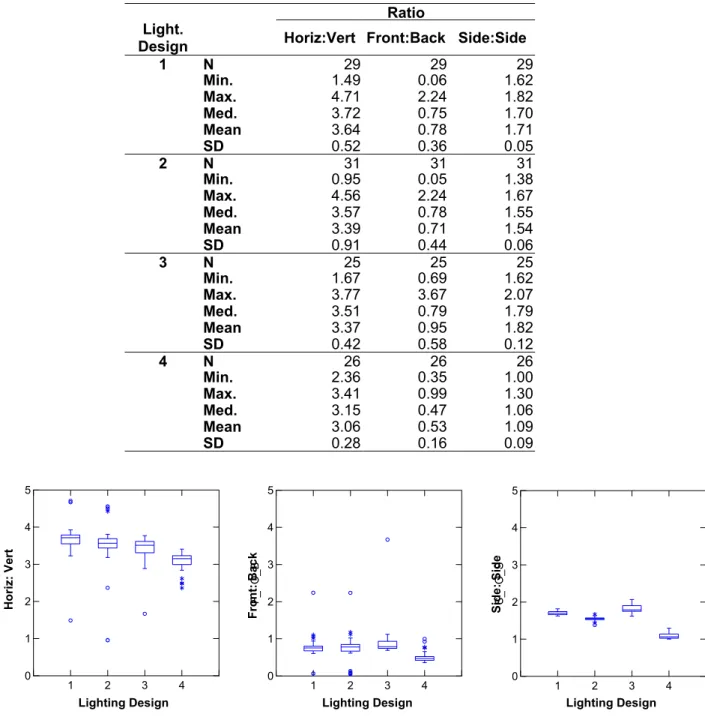
summarized in Figure 10. As expected, Designs 1, 2 and 3, with the parabolic ambient lighting, have a higher horizontal:vertical ratio than Design 4, with the direct/indirect fixture. Previous work in th same laboratory, indicated that designs with front:back and side:side ratios further from 1:1 would be less favoured1. However, Table 6 shows that those designs with the side:side ratio closest to 1 also the designs with the front:back ratio furthest from 1:1. Newsham et al. [2003] showed almost no effect of design on satis
te
study deliberately manipulating these ratios in a consistent manner is necessary to study these effects.
Table 7 shows the number of control actions taken by lighting design. A control action was defined as use of the dimmers to create a condition that then remained in use for several minutes. Therefo
1
This was suggested in the presentation of: Newsham, G.R.; Marchand, R.G.; Svec, J.M.; V J.A. "The Effect of power constraints on occupant lighting choices and satisfaction: a pilot study," the IESNA Annual Conference, Salt Lake City, 2002, but was not part of paper which was publishe in the conference proceedings (pp. 115-131).
eitch, at
a single control action could encompass several dimmer adjustments by one or both occupants with minute, prior to settling on a condition. Previous work2 suggested that a successful control system would be one requiring the fewest adjustments. Design 3 exhibited the lowest number of control actions per day, on average. However, we did not record the number of adjustments to the locatio of the task light during the experimental session. We did note whether at the end of the day the task light arm was in a substantially different position compared to the start of the day, and this is also shown in Table 7. Adding these changes to the control ac
a
n
tions made with dimmer system brings esign 3 more in line with Designs 1 and 2 in terms of total lighting adjustments.
8 ’
r
t
inance measured at the 4 fixed points on the day conditions were recreated. For initial
D
Table 8 shows how those control actions were distributed by task, over all lighting designs. Table also shows whether that action took dimmers up, down, or a mixture of up and down. The ‘mixture condition could occur in two different ways. It could occur when there were two participants, and one increased their dimmer setting while the other decreased it. Or it could occur in Design 2 where a single participant increased the ceiling-recessed parabolics and decreased the partition washer, o vice versa. It is interesting to note that for the most visually demanding on-screen tasks (Vision, Persistence) there was a tendency to lower light levels, whereas for the other tasks the direction of change was more balanced across participants. We cannot be sure why people doing visually demanding on-screen tasks tended to lower light levels, perhaps it was to focus attention on the self-luminous task, or to reduce an ambient light veil and thus increase task contrast. However, the important message from the data in Table 8 is that people did sometimes choose to change ligh levels between tasks. Individuals differ in what those preferred changes are, and only individual dimming control can provide people with the ability to make such independent choices.
Table 2. Illum
dimmer settings (pre-control). Data are presented by lighting design, and initial condition, for both workstations combined.
Lighting Design
Initial
Condition desktop partition
1 A 194 80 B 412 178 C 589 254 D 827 354 2 A 203 297 B 428 384 C 598 467 D 804 550 3 A 196 63 B 395 149 C 560 220 D 776 313 4 A 127 60 B 180 102 C 241 148 D 302 200
2
Table 3. Illuminance measured at the 4 fixed points on the day conditions were recreated. Data for
participant choices after first control, and after the final control action made in the space are shown Results are presented by lighting design, and initial condition.
After First Control After Final Control . Light. Design Initial Cndtn.
desk partition desk partition
1 A N 7 7 7 7 Min. 266 108 266 108 Max. 739 316 739 309 Med. 544 233 544 233 Mean 508 217 483 205 SD 186 80 193 82 B N 7 7 7 7 Min. 293 120 31 11 Max. 688 306 688 306 Med. 614 255 614 255 Mean 541 226 446 190 SD 154 71 269 114 C N 8 8 8 8 Min. 316 121 224 93 Max. 963 436 1007 414 SD 282 120 D N 8 8 7 7 Med. 487 204 416 177 Mean 574 246 520 221 239 111 in. 359 154 122 51 a 4 437 Med. 49 5 152 Mean 53 9 189 SD 20 3 161 2 A N 8 8 M M x. 9 1 394 948 4 20 7 22 348 436 3 8 352 8 8 Min. 22 4 22 Max. 93 1 875 Med. 66 6 544 Mean 62 0 501 SD 26 6 283 B N 7 7 3 18 6 94 92 891 2 55 482 7 59 471 2 24 243 7 7 Min. 44 3 216 Max. 87 5 907 Med. 79 7 680 Mean 69 8 588 SD 17 5 265 C N 8 8 4 20 357 4 91 850 4 86 598 9 69 615 2 30 8 208 8 Min. 36 4 284 Max. 106 3 1093 Med. 72 1 788 Mean 70 4 723 SD 25 4 300 D N 8 8 8 8 6 36 233 2 109 1062 5 86 6 76 666 648 4 27 297 Min. 570 501 233 141 Max. 943 971 887 991 Med. 819 658 759 635 Mean 804 726 664 621 SD 127 185 236 320
Table 3. continued.
After First After Final
Control Control
Light. Design
Initial Cndtn.
desk partition desk partition
3 A N 7 7 7 7 Min. x. 107 44 99 40 354 132 267 85 Ma 0 4 1 8 Med. 725 288 641 253 Mean 740 300 615 244 SD 291 129 252 110 B N 6 6 5 5 Min. 1 1 x. 62 25 55 21 5 2 392 46 392 46 Ma 4 5 9 8 Med. 512 200 12 09 Mean 509 200 499 195 SD 82 37 64 30 C N 4 4 6 6 Min. 1 x. 73 29 73 29 1 298 05 206 63 Ma 7 5 7 5 Med. 378 131 362 29 Mean 448 165 390 144 SD 198 87 187 81 D N 7 7 7 7 Min. x. 99 42 94 40 2 180 31 180 31 Ma 9 7 9 3 Med. 787 306 667 72 Mean 654 257 633 248 SD 297 145 266 128 4 A N 6 6 6 6 Min. x. 32 17 32 17 1 1 150 76 150 76 Ma 9 1 9 1 Med. 234 146 98 16 Mean 232 134 219 123 SD 64 38 68 38 B N 7 7 7 7 Min. x. 28 18 65 18 117 51 157 82 Ma 4 5 2 5 Med. 239 143 267 143 Mean 220 133 299 142 SD 66 52 161 39 C N 5 5 6 6 Min. x. 29 19 29 19 138 69 164 90 Ma 2 1 6 3 Med. 270 171 242 150 Mean 249 157 242 151 SD 64 51 50 39 D N 8 8 7 7 Min. x. 29 19 29 18 149 78 100 52 Ma 4 2 1 9 Med. 259 165 211 122 Mean 237 147 191 115 SD 53 43 81 59
Figure 7. Summary chart of illumi measu the onditions were
recreated. Participant choice aft final control action are sho Resu e presented by
lighting design, and include both wo ns. T iddle of the box is the median value;
the box shows the interquar ra . The ‘whi rs’ sho he ran f valu lling within ±2
interquartile ranges of the mean, and circles indicate individual extreme values.
nance red at the fixed points on day c
s er the wn. lts ar
rkstatio he line in the m
tile nge ske w t ge o es fa
1
1000
1
g D
D
2
3
4
DESIGN
0
200
400
600
800
F
IX
_
D
E
S
K
1200
D
e
s
k
top Illum
ina
nce
, lux
2
3
4
DESIGN
0
200
400
600
800
1000
1200
F
IX
_
P
A
R
T
Lighting
esign
Pa
rt
ition Illum
ina
nce
, lux
Lightin
esign
Table 4. Luminance measured at various points in the workstations on the day conditions were
recreated. Data for participant choices after the final control action made in the space are shown. Results are presented by lighting design, over all initial conditions and both workstations.
Luminance (cd/m2) Light. Design Side Wall Monitor Partition Side Ceiling Monitor Partition Top Monitor Partition Mid-Top Monitor Partition Middle Corridor Partition Top Corridor Partition Middle Corridor Partition Bottom 1 N 29 29 29 29 29 29 29 29 29 Min. 7 7 6 3 7 5 5 6 8 Max. 89 59 63 99 101 92 72 71 85 Med. 39 25 29 42 41 36 31 30 35 Mean 43 29 30 46 46 42 33 34 38 SD 23 15 14 27 27 24 17 18 21 2 N 31 31 31 31 31 31 31 31 31 Min. 8 6 12 10 8 7 8 9 11 Max. 92 76 75 322 293 210 82 86 88 Med. 55 46 43 175 185 121 45 43 46 Mean 54 44 44 171 166 116 44 47 50 SD 24 19 16 84 82 55 18 19 21 3 N 25 25 25 25 25 25 25 25 25 Min. 8 4 14 17 11 9 12 15 24 Max. 83 57 63 103 99 93 73 75 81 Med. 45 29 35 52 52 48 36 39 47 Mean 43 29 35 54 51 48 38 40 46 SD 20 14 13 24 23 22 17 17 17 4 N 26 26 26 26 26 26 26 26 25 Min. 15 7 41 10 14 6 17 15 18 Max. 56 28 190 43 36 36 44 39 48 Med. 39 19 128 28 27 25 31 32 32 Mean 38 19 128 27 26 25 30 29 31 SD 13 7 47 9 7 7 8 8 8
2 3 4 DESIGN 0 10 20 30 40 50 80 L U M _ S W
Figure 8. Summary chart of luminance m recreated. Participant choices after the final c lighting design, and include both workstations. The li
the box shows the interquartile range. The ‘w
1 2 3 4 DESIGN 0 10 20 30 40 50 60 70 80 L U M _ C P M Lighting Design
easured at select points on the day conditions were ontrol action are shown. Results are presented by
ne in the middle of the box is the median valu
hiskers’ show the range of values falling within ±2
1 2 3 4 DESIGN 0 50 100 150 200 e; interquartile ranges of the mean.
1 60 70 1 150 200 P M Li g D n Li g D n umi n a n c e d / 90 100 250 d /m 2 250 2 3 4 DESIGN 0 50 100 L U M _ M Mon. P a rt. M id. L , c L U M _ CE IL Ce iling L u mi na nc Lighting Design e , c m 2 esig ghtin esig ghtin S ide Wa ll Lumi n a n c e , c d /m 2 90 100 Co r. P a rt . M id. L u m ina nc e , c d /m 2
Table 5. Illuminance measured at various points in the workstations on the day conditions were recreated. Data for participant choices after the final control action made in the space are shown.
Results are presented by lighting design, over all initial conditions and both workstations.
Illuminance (lux)
Desktop Cubic
Light.
Design E1 E2 E3 E4 Front Back Top Bottom Left Right
1 N 29 29 29 29 29 29 29 29 29 29 Min. 10 7 34 16 14 8 17 -3 7 11 Max. 1090 1142 988 1174 291 418 1179 76 343 349 Med. 375 452 341 352 110 170 490 29 124 110 Mean 408 476 429 419 130 188 546 33 134 129 SD 266 282 259 289 80 111 322 22 82 86 2 N 31 31 31 31 31 31 31 31 31 31 Min. 32 106 24 28 4 14 48 -1 21 14 Max. 1069 1174 1001 1093 326 2389 332 Med. 512 563 568 561 168 299 597 36 167 168 Mean 488 600 552 538 161 389 658 41 164 167 SD 254 265 249 276 88 528 303 21 81 84 3 N 25 25 25 25 25 25 25 25 25 25 1188 76 351 Min. 116 185 63 41 58 19 65 7 43 22 Max. 1907 1283 1148 2134 285 387 1118 86 331 328 Med. 1141 686 514 486 145 202 578 40 132 124 Mean 968 658 541 828 156 192 553 41 147 137 SD 619 289 276 677 66 97 280 21 77 77 4 N 26 26 26 26 26 26 26 26 26 26 Min. 86 83 78 69 41 52 109 8 44 34 Max. 1447 635 468 1804 93 221 445 32 114 122 Med. 805 333 215 250 77 147 301 22 81 86 Mean 719 327 255 674 72 148 301 22 81 84 SD 538 153 140 620 16 53 108 8 22 26
1 ES 0 T O P 1 2 DESIGN 300 F R O N 1 2 3 4 DESIGN 0 100 300 400 L E F T 1 2 3 4 DESIGN 0 R IG H T
Lighting Design Lighting Design
in ig ting g Top I llumina e , l u x Front Illuminanc e, lu Le ft I lluminanc e, lux Right Illuminanc e, lu x 1200 400 2 3 4 D IGN 400 800 3 4 0 100 200 T 200 100 200 300 400
Light g Des n Ligh Desi n
nc
x
Figure 9. Summary chart of select cubic illuminances measured on the day conditions were recreated. Participant choices after the final control action are shown. Results are presented by lighting design, and include both workstations. The line in the middle of the box is the median value;
the box shows the interquartile range. The ‘whiskers’ show the range of values falling within ±2
Table 6. Illuminance ratios derived from cubic illuminance measurements. Data for participant choices after the final control action made in the space are shown. Results are presented by lighting
design, over all initial conditions and both workstations.
Ratio
Light. Design
Horiz:Vert Front:Back Side:Side
1 N 29 29 29 Min. 1.49 0.06 1.62 Max. 4.71 2.24 1.82 Med. 3.72 0.75 1.70 Mean 3.64 0.78 1.71 SD 0.52 0.36 0.05 2 N 31 31 31 Min. 0.95 0.05 1.38 Max. 4.56 2.24 1.67 Med. 3.57 0.78 1.55 Mean 3.39 0.71 1.54 0.91 0.44 25 25 0.06 25 SD 3 N Min. 1.67 0.69 1.62 Max. 3.77 3.67 2.07 Med. 3.51 0.79 1.79 Mean 3.37 0.95 1.82 SD 0.42 0.58 0.12 4 N 26 26 26 Min. 2.36 0.35 1.00 Max. 3.41 0.99 1.30 Med. 3.15 0.47 1.06 Mean 3.06 0.53 1.09 SD 0.28 0.16 0.09
Figure 10. Summary chart of cubic illuminance ratios measured on the day conditions were recreated. Participant choices after the final control action are shown. Results are presented by lighting design, and include both workstations. The line in the middle of the box is the median value;
the box shows the interquartile range. The ‘whiskers’ show the range of values falling within ±2
interquartile ranges of the mean, and stars and circles indicate individual extreme values. 1 DESIGN 0 3 4 5 H _ T O _ V DESIGN 3 4 5 T 3 4 DESIGN 4 5 T
Lighting Design Lighting Design Lighting Design
Ho ri z : V e rt Front: Ba c k de 3 O _ S : S i O _ B 2 3 4 1 2 1 2 3 4 0 1 2 F _ 1 2 0 1 2 S _ Si de
Table 7. Number of dimming control actions made over all experimental days, for each lighting er of participants who changed their task light position is
design. Numb also shown.
Lighting Design Control Actio Expmn ctions D Task Light ments ns Da t. A ys per ay adjust 1 46 15 3.1 2 49 1 3 38 4 4 41 7 16 3. 16 2. 8 15 2. 10
Table 8. Number of dimm ng control actions over rimen ys and designs for each
task or task category.
Task Number ntrol
Ac
ection trol
Act
i all expe tal da lighting
of Co tions Dir of Con ion Up Down Mix Vision 13 4 9 0 Typing 7 3 Co 17 7 gnitive 18 5 Persis ence 20 2 Questionnair 7 2 Gettin 34 11 t 26 4 es 16 7 g Printed Materials 2 2 0 0
3.2
o answer this question we began by conducting a series of analyses of variance using the data from
the various task on co rti c
were univaria (ANOVAs). When the re th outc p ct of
performance the tests were multivariate (MANOVAs). For the MANOVAs, outcomes were grouped
according to the aspect of performance being investigated; though y were ba d on multiple
outcomes from a single me did involve outcomes from e than one task. Following
our common practice (a r to avoid Type I stat al errors) we examine ivariate effects
some cases simple transformations were applied to described below.
Each analysis looked a en-subject ffe ble,
within-subject (WS) time-of-day and task characteristi and their intera he initial condition
for each lighting design w s also varied, but we did not include it as a separate indep nt variable in these analyses. Th y reason to vary initial condition was for the analysis of the effect of
non-preferred conditio ection 3.3). As sh above, final preference did not vary
systematically with initial condition, and so we coll ed over initi nditio d analysed 4 (lighting
design) x 3 (time-o s and MANOVAs
For lighting four singl -of-freedom contrasts:
1. Design 1 vs. Design 2 (effect of adding the partition washer to ambient parabolics) 2. Design 1 vs. Design 3 (effect of adding the desk lamp to ambient parabolics)
3. Design 1 vs. Design 4 (comparison of typical office lighting to new PWGSC concept) 4. Design 3 vs. Design 4 (effect of ambient lighting design when both designs have a desk
lamp)
Note that we are testing more contrasts (4) than we have degrees of freedom (4 different designs means 4-1 d.f.); the fourth contrast above is not independent of the other three. This does increase the risk of familywise statistical error. Nevertheless, we felt the theoretical interest in the question justified this increased error risk.
With reference to Table 1, most performance outcomes were measured at three general times of day (am (T1), pm-before control was introduced (T2), and pm-after control was introduced (T3)). In such cases, for time-of-day effects, we conducted tests on two single degree-of-freedom contrasts: T1 vs. T2 and T2 vs. T3. T2 vs. T3 was also a pre-control vs. post-control contrast.
The results of the individual tests are detailed below. Tables 9 to 23 summarize the results of the analyses where significant effects were found (details of non-significant tests are not shown), and these effects are shown graphically in Figures 11 to 24.
Vision Test (Contrast Sensitivity)
We first assumed that sensitivity to contrast differences would be the same whether the contrast was positive or negative. Therefore performance at contrast +16 was combined with performance at contrast -16, and so on3. Thus, we had six contrast levels (0, 1, 2, 4, 8, 16), forming a within-subject variable in the analysis, in addition to time-of-day. We chose to collapse over grating size and orientation for this analysis. Response times and accuracy scores were combined to form a composite visual performance score: total correct/total time (correct responses per second).
Therefore the ANOVA was a 4 Lighting Design (BS) x 3 Time (WS) x 6 Contrast (WS). Note that the effect of contrast was analyzed as a linear effect across all six contrast levels, assuming the contrast
What are the effects on task performance?
T
s. When there was ly one out
re was mo
me for a pa an one
cular aspe ome for a
t of performance the tests articular aspe
te
man se
task type, so mor
nd in orde istic d un
only if the overall MANOVA was significant. In
outcome variables to improve the normality of data distribution, any such transformations are
t betwe (BS) lighting design e
cs effects,
cts, and, where applica ctions. T a ende e primar ns (see S own aps al co n an f-day) ANOVA .
design effects we conducted e degree
3
This simplified the analysis considerably, though it did introduce some error. For example, whereas the measured luminance difference between target and background for +16 was ~6.5 cd/m2, it was only 5 cd/m2 for –16. But both were easily distinguishable from +/-8.
levels are equally spaced. Although the differences in absolute contrasts associated with each t response of the human visual system is non-near with respect to luminance. Our assumption of equal spacing may be valid in regard to visual
t, , s no od. Observing this expected trend gives us confidence in the validity of the task.
m both r T3, the slope is higher than at T2, suggesting ster improvement with contrast, though the intercept is lower, suggesting poorer performance at low
The icant interaction
on L t h
ligh
significantly lower for Design 3.
contrast level were not equally spaced, we know tha li
response and, indeed, Figure 11 demonstrates a very linear response, at least between contrasts 1 and 8, when the contrasts are represented as being equally spaced. Although, when all contrasts are included, the shape of the mean performance curve does not appear very linear (Figure 11), the analysis shows a very high η2 partial (0.920) for the linear effect.
4
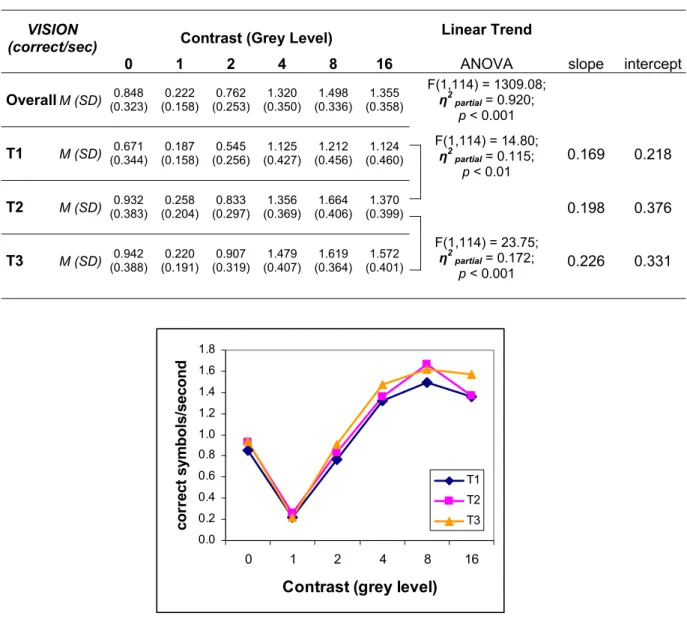
The effect of target contrast was strong, and as expected (Figure 11). Where there was any contras performance in identifying that there was a target was very poor for the lowest contrast (1 grey level) increasing rapidly with increasing contrast. There appears to be no further improvement beyond contrast level 8. When there was no contrast, performance in correctly responding that there wa target was very go
As shown in Figure 12, there were significant effects on the Time-of-day contrasts, with performance on the vision test over all contrasts and lighting designs increasing significantly from T1 to T2, and from T2 to T3.
There was a significant interaction between target contrast (linear trend) and time-of-day, fro
T1 to T2 and T2 to T3, which modifies the simple time-of-day effect. Both the slope and intercept of the linear trend are higher at T2 compared to T1. Fo
fa
contrasts.
re were no main effects on the Lighting Design contrasts, but there was one signif
igh ing Designs 1 vs. 3 from T1 to T2 (Figure 13). Although performance improves for bot ting designs from T1 to T2, the improvement (the gradient of the line in Figure 13) was
4
We did repeat the analyses for the very linear part of the curve (contrasts 1-8) only, but this did not improve interpretation of the outcomes.
Table 9. Tests of the effect (linear trend) of Contrast (grey level) on performance on the Vision Task, by Time-of-Day. M = mean, SD = standard deviation.
VISION
(correct/sec) Contrast (Grey Level)
Linear Trend
0 1 2 4 8 16 ANOVA slope intercept
0.848 0.222 0.762 1.320 1.498 1.355 F(1,114) = 1309.08; Overall M (SD) (0.323) (0.158) (0.253) (0.350) (0.336) (0.358) η2 partial = 0.920; p < 0.001 0.169 0.218 T1 M (SD) (0.344) 0.671 (0.158) 0.187 (0.256)0.545 (0.427)1.125 (0.456)1.212 (0.460)1.124 F(1,114) = 14.80; η2 partial = 0.115; p < 0.01 0.198 0.376 T2 M (SD) (0.383) 0.932 (0.204) 0.258 (0.297)0.833 (0.369)1.356 (0.406)1.664 (0.399)1.370 0.226 0.331 3 M (SD) 0.942 0.220 0.907 1.479 1.619 1.572 F(1,114) = 23.75; η2 partial = 0.172; T (0.388) (0.191) (0.319) (0.407) (0.364) (0.401) p < 0.001 0.0 0.2 0.4 0.6 0.8 1.6 1.8 0 1 2 4 8 16
Contrast (grey level)
co rr e c t symb d T1 T2 T3 1.0 1.2 1.4 o ls /seco n
Table 10. Tests of the effect of Time-of-Day on performance on the Vision Task. M = mean, SD = standard deviation.
VISION
(correct/sec) Time of Day
T1 T2 T3 M (SD) 0.810 (0.292) 1.069 (0.268) 1.123 (0.253) ANOVA η2 F(1,114) = 189.01; partial = 0.623; p < 0.001 F(1,114) = 18.57; η2 partial = 0.140; p < 0.001
Figure 12. The effect of Time-of-Day on performance on the Vision Task.
0.0 0.2 0.4 0.6 0.8 1.0 1.2 1.4 1.6 1.8 T1 T2 T3 Session co rr e ct symb o ls/ seco n d
Table 11 on the
Vision ation.
. Tests of the interaction between Time-of-Day and Lighting Design on performance Task. M = mean, SD = standard devi
VISIO (correct/se N c) Lighting Desi ANOVA 2 3 gn 1 4 (0.34 M (S ) 1.014 (0.290) F(1,114) = 5.45; .046; η2 partial = 0 p < 0.05 T1 M (SD) 0.783 (0.267) 0.820 0) T2 D) 1.101 (0.258
Figure 13. T the Vision
Task. 0.0 0.2 0.4 0.6 0.8 1.0 1.2 1.4 1.6 1.8 T1 T2 T3 Session co rr ect symb o ls /seco n d Design1 Design3
S
The single dependent variable for this task was co cters typed per second, which was
recorded for each font size and each time of day. Therefore the ANOVA was a 4 Li
(B e (WS) x 3 Font Size (WS).
As ffects on the Time-of-Day contrasts, with average
performance the typing tas ver d lighting designs in asing significantly from T1 to
T2, and from T2 to
There was also a he Ligh sign contrasts, the contr en
Design 1 and Design 3 (Fig The typing spe sign 3 was significantly higher than
under Design 1. The difference in means is large, at 24%.
There was a significant linear trend in the main effect of Font Size (Figure 16) in the expected direction: typing speed increases with Font Size. It is clear from Figure 16 that the average trend shows little improvement beyond 12-point font. Nevertheless, the quadratic trend was a slightly less successful fit to the data5. There were no significant interactions between Font Size (linear) and Lighting Design or Time, or both. A post-hoc test confirmed that the difference in typing speed between Font 8 and Font 12 was significant (F(1,101) = 84.26; η2 partial = 0.455; p < 0.001), whereas
the difference in typing speed between Font 12 and Font 16 was not significant. The lack of improvement at the largest font size was unexpected. One explanation might be that although the text to be typed was presented on paper in different font sizes, the text as typed on screen was always in 12-point font. As a result, it might have been easier to scan the printed and on-screen text to find errors (for example) when the two texts were in the same font size.
imple Cognitive/Clerical Performance (Typing)
rrect chara
ghting Design S) x 3 Tim
shown in Figure 14, there were significant e
on k o all fonts an cre
T3.
significant effect on one of t ting De
d under De
ast betwe
ure 15). e
5
Table 12. Tests of the effect of Time-of-Day on performance on the Typing Task. M = mean, SD = standard deviation.
TYPING (char/sec) Time of Day
T1 T2 T3 .01) M (SD) 2.66 (0.97) 2.86 (0.99) 2.92 (1 ANOVA F(1,101) = 36.79; η2 = 0.349; p < 0.001 F(1,101) = 4.23; η2 = 0.040; p < 0.05 partial partial T1 T2 T3 Session 2.0 2.5 3.0 3.5 co rr ect ch ar s/ s eco n d
Table 13. Tests of the effect of Lighting Design on performance on the Typing Task. M = mean, SD = standard deviation.
TYPING (char/sec) Ligh 2 M (SD) (0.88) (1.38) 19 ting Design 1 2.57 3 3. 4 F(1,101) = 5.30; ANOVA η2 partial = 0.050; p < 0.05 F 2.0 2.5 3.0 3.5 All Sessions co rr ect ch ar s/ seco n d Design1 Design3
Table 14. Tests of the effect of Font Size on performance on the Typing Task. M = mean, SD = standard deviation.
TYPING (char/sec)
8 12 16
Font Size (Po Linear Trend
ANOVA 2.66 (0.99) 1 (1.00) 2.8 (0. F(1,101) = 56.48; η2 partial = 0.359; p < 0.001 ints) M (SD) 2.9 7 98)
Figure 16. The main effect of Font Size on performance on the Typing Task.
2.0 2.5 3.0
8 12 16
Font Size (points)
co rr ect ch ar s/ seco n d 3.5