2011/0005
Natural and artificial ageing of spruce wood as observed by
FTIR-ATR and UVRR spectroscopy
Christelle Ganne-Che´deville1,*, Anna-Stiina
Ja¨a¨skela¨inen2,3, Julien Froidevaux1, Mark Hughes2
and Parviz Navi1
1Bern University of Applied Sciences, Architecture, Wood,
and Civil Engineering, Solothurnstrasse 102, 2500 Biel, Switzerland
2Aalto University, Department of Forest Products
Technology, Vuorimiehentie 1, Espoo, Finland
3VTT Technical Research Centre of Finland, Tietotie 2,
Espoo, Finland *Corresponding author.
Bern University of Applied Sciences, Architecture, Wood and Civil Engineering, Solothurnstrasse 102 CH-2500 Biel, Switzerland
E-mail: [email protected]
Abstract
Spruce samples, naturally aged for 200, 400 and 500 years, artificially aged by a hydrothermal treatment (at 180, 160 or 1308C, relative air humidities of 14%, 40%, or 60% and for treatment times between 1 to 50 h), as well as reference samples, were analysed by Fourier transform infrared spec-troscopy (FTIR) attenuated total reflection (FTIR-ATR) and ultraviolet resonance Raman (UVRR) spectroscopy. Natural ageing mostly affected the hemicelluloses and lignin, as observed from the FTIR-ATR and UVRR spectra, respec-tively. The UVRR spectra of the same samples after acetone extraction indicated that lignin was partially degraded and quinone structures were possibly formed. Artificial ageing at 1608C showed a significant change in the lignin structure, a well-known effect in the thermal treatment of wood, whereas treatment at 1308C did not alter the wood structure to any significant extent. Principal component analysis of the UVRR spectra confirmed that the spectra of artificially aged wood up to 1608C are dissimilar to naturally aged wood and which are also dissimilar to unaged wood.
Keywords: FTIR; heat-treated wood; PCA; UV resonance
Raman spectroscopy (UVRRS); wood ageing.
Introduction
The slow deterioration of objects of cultural heritage is often called ageing; however, with appropriate storage and protec-tion, ageing can be slowed down. Understanding how the mechanical and chemical properties of a material degrade over time can contribute to the knowledge of the most appro-priate protection conditions. Ageing indoors must be
differ-entiated from weathering outdoors, but even the former is a complex process, including physical and chemical changes on the surface, which is exposed to photo-modification and intensive oxidation, and in the bulk wood, i.e., below the surface. The interrelating factors triggering and influencing ageing are: the long-term exposure to fluctuating relative humidity; changes in ambient temperature; oxygen penetra-tion into the bulk material; mechanical loading; and, in the worst case, fungi and bacteria. Deceleration and prevention of wood ageing is a topic of great interest to historians and conservationists.
Ageing and thermal treatment have similar effects (colour change, decrease of physical properties) as highlighted in a recent paper by Matsuo et al. (2011). Matsuo et al. compared the colour change of wood in historical buildings and heat-treated wood and found that the colour change (DE*ab) after 921 years at ambient temperature was almost equivalent to that of heating, which can be considered as artificial ageing, approximately for 6.7 h at 1808C. Thus, the vast recent lit-erature about thermal treating of wood gives a good oppor-tunity to also gain insight into the slow processes of ageing (Gonza´lez-Pen˜a and Hale 2009a,b; Bryne and Wa˚linder 2010; Bryne et al. 2010; Tuong and Li 2011). The relation-ship between chemical changes and mechanical properties of thermally treated wood is summarised by Windeisen et al. (2009). Also in the present study, artificial ageing by means of hydrothermal treatment was the preferred method.
Fourier transform infrared spectroscopy (FTIR) spectros-copy is an analytical technique well suited for studying the changes that take place in wood during ageing or weathering (Borgin et al. 1975; Fengel 1991; Horn et al. 1994; Mu¨ller et al. 2003; Pandey and Pitman 2003; Popescu et al. 2005; Ucar et al. 2005; Dobrica et al. 2008). It is recognised that¸ a decrease in polyose content occurs during natural ageing as a result of a slow hydrolysis initiated by acetic acid which originates from cleaved O-acetyl groups of hemicelluloses.
Similar observations were seen on thermal treated wood with infrared (IR) spectroscopy techniques (Pandey and Pitman 2003; Windeisen et al. 2003; Nuopponen et al. 2004; Tjeerdsma and Militz 2005; Windeisen and Wegener 2008). Thermal treatment also leads to the removal of extractives. During ageing, extractives move by evaporation, transpor-tation by water movement, and diffusion towards the surface, and they are partly oxidised (Lavoie and Stevanovic 2006). The crystalline structure of cellulose in 300–400-year-old wood does not differ from fresh, unaged, wood. However, the degree of condensation of lignin and the number of poly-conjugated systems increases as a result of oxidation and the amount of acid soluble lignin decreases (Borgin et al. 1975). In thermal treatment, a decrease in the amorphous polysac-charide content is observed, as well as condensation and
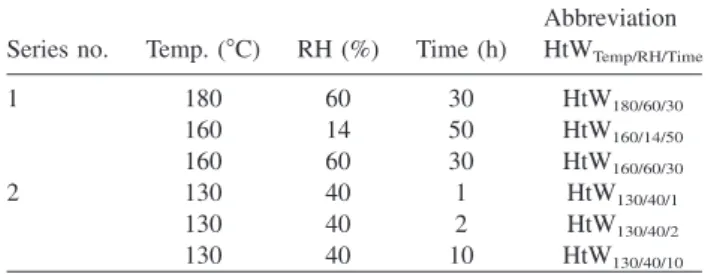
Table 1 Description of the artificial ageing processes by hydro-treatment (HtW) performed at 1 bar.
Abbreviation Series no. Temp. (8C) RH (%) Time (h) HtWTemp/RH/Time
1 180 60 30 HtW180/60/30 160 14 50 HtW160/14/50 160 60 30 HtW160/60/30 2 130 40 1 HtW130/40/1 130 40 2 HtW130/40/2 130 40 10 HtW130/40/10
demethoxylation of lignin (Tjeerdsma et al. 1998; Nuoppo-nen et al. 2004).
The usefulness of FTIR combined to ultraviolet resonance Raman spectroscopy (UVRRS) was demonstrated by Nuop-ponen et al. (2004, 2005, 2006). UVRRS is based on the sensitive interaction of lignin with UV light (Halttunen et al. 2001; Saariaho et al. 2003; Mononen et al. 2005; Nuopponen et al. 2006; Pandey and Vuorinen 2008), whereas the UV absorption by the hemicelluloses and cellulose is negligible. Today, methods of chemometrics are an integral part of the utilization of modern hyphenated techniques. They make visible, even small changes, not otherwise visible at the first glance (Nuopponen et al. 2004, 2005; Martin et al. 2005). Chemometrics are frequently combined with FTIR and UVRRS; one speaks of multivariate data analysis with the approach partial least quares (PLS) or principal component analysis (PCA). PCA is suited for grouping of spectra, as well as for defining bands responsible for their similarities and dissimilarities (Ferraz et al. 2000; Saariaho et al. 2005; Esbensen 2009).
The aim of this study was to compare, both visually and with PCA, FTIR and UVRR spectra from un-aged wood, naturally aged wood and wood artificially aged by means of hydrothermal treatment. Qualitative and semi-quantitative analyses were performed. This approach should help draw conclusions as to the suitability of the different artificial age-ing processes to reproduce the chemical changes occurrage-ing during natural ageing.
Materials and methods
Wood samples
Heartwood samples of spruce(Picea abies) wood were the focus of the study, namely: naturally aged old wood (OldW), wood artifi-cially aged by hydrothermal treatment (HtW) and recent (reference) wood (RefW). The 400-year-old sample (400yW) was taken from a floorboard showing some radial cracks and visible insect attack, but no visible fungal attack. The 200- and 500-year-old samples (200yW and 500yW) were taken from beams used as structural elements in roofs. The age of the OldW samples was determined by dendrochronology. The parameters of artificial ageing of HtW samples are summarised in Table 1. The samples were stabilised to their equilibrium moisture contents (EMC) at 208C and 50% relative humidity (RH).
All specimens were taken not less than 7 mm away from the wood surface to avoid any influence of photo degradation or surface weathering. The specimens for FTIR spectroscopy were cut with a
blade in the radial direction to obtain thin samples with dimensions of 0.05–0.1=5=20 mm3
(t=l=r). Five pieces were prepared for each sample type. For the UVRRS measurements, eight wood spec-imens with dspec-imensions of 0.7=5=25 mm3(t=l=r) were prepared from each sample type. They were cut with a chisel following the radial direction and the freshly cut surfaces were reserved for the measurement.
Extractions
Samples were extracted for 6 h with acetone in a Soxhlet apparatus. After evaporation of the acetone, the extracted specimens were dried at room temperature before further analyses.
FTIR measurements
Instrument: Spectrum 100 (Perkin Elmer, Waltham, MA, USA) spectrometer equipped with an attenuated total reflection (ATR) unit. Scanning range: 4000 and 650 cm-1
; 32 scans; resolution 4 cm-1 . Baseline correction on four points (3960, 1784, 1545 and 782 cm-1); normalization to the highest absorption band between 1550 and 1500 cm-1
. The spectral range 1800–600 cm-1
was evaluated. Each specimen was measured at five different positions on the freshly cut radial face.
UVRR spectroscopy
The specimens were attached to a microscope slide with double-sided tape with the freshly cut radial face on top and gently pressed with another slide to ensure good adhesion. Instrument: Renishaw 1000 UV Raman Spectrometer (Renishaw, Goucestershire, UK) equipped with a Leica DMLM microscope (Leica Microsystems, Wetzlar, Germany). Light source: Innova 908C FreDTM frequency-double Arqion laser (Coherent Inc., Santa Clara, CA, USA) tuned to an excitation wavelength of 244 nm. Focus on the specimen was initially achieved with white light and a 40=objective lens. Then, the focus was adjusted to 30mm deeper, so as to get the UV laser beam to focus on the specimen surface. The laser power was kept at 1 mW and the specimens were moved slowly along a line per-pendicular to the annual rings with a motorised sample stage. The acquisition time was 30 s (line distance 6 mm), consisting of 2 CCD readouts of 15 s. The spectral data were analyzed by GRAMS/32 software (Thermo Galactic, Woburn, MA, USA). The spectra were normalised on the most intense band at 1602 cm-1 for easier comparison.
PCA analysis of UVRR spectra
PCA of normalised UVRR spectra was carried out by the Unscram-bler X (CAMO Software AS., Oslo, Norway) software. Algorithm: NIPALS with systematic cross-validation and ascertainment test. A correlation optimised warping (COW) was performed to reduce the differences between the explained variance calibration and valida-tion curves. Loadings and score were then plotted.
Results and discussion
Qualitative analysis of FTIR ATR spectra
Five FTIR-ATR spectra were collected from the recent ref-erence sample (RefW) to check the spectral variation within the sample (Figure 1). Intensity differences were observed but, of course, no shifts of the principal bands were seen
Figure 1 Five FTIR ATR spectra of the reference sample RefW in the fingerprint region. Numbers correspond to band assignment as described in Table 2.
Table 2 FTIR band assignment in the 1800–600 cm-1 region for different wood species (Faix 1992; Pandey and Pitman 2003; Mu¨ller et al. 2008).
Band Observed (cm-1) Lit. (cm-1) Compound or chemical group 1 1735 1732 CsO Stretch in xylan (hemicelluloses) 2 1700 Shift of 1735 after Py, wood welding, and TM* 3 1641 1649 Absorbed O-H and conj. C-O; in Py: loss of water 4 1617 1593 Arom. skeletal vibr. in L
5 1508 1505 Arom. skeletal vibr. in L
6 1463 1460 C-H def. in L and CH
7 1452 C-H def. in L and CHe
8 1423 1424 Arom. skeletal vibr. in L with C-H def. 9 1368 1367 C-H def. in cellulose and hemicell. 10 1335 1328 S ring and G ring condensed 11 1317 1318 C-H vibration in cellulose 12 1265 1267 C-O stretch lignin ring in G units
13 1231 1235 C-O stretch in G units
14 1204 1245–1220 Higher condensate structure in TM wood 15 1157 1157 C-O-C vibration in cellulose and hemicell. 16 1104 1122 Arom. skeletal vibr. and C-O stretch 17 1051 C-O vibr. in cellulose and hemicell. 18 1027 1031 C-O vibr. in cellulose and hemicell.
19 897 897 C-H def. in cellulose
20 877 859 C-H out-of-plane arom. in L
21 808 818 C-H out-of-plane arom. in L
22 664 Unknown
G, guaiacyl; S, syringyl; *TM, thermal modification, Windeisen and Wegener (2008); L, lignin. CH, carbohydrates. Py, pyrolysis.
(Figure 1). The differences in the band intensities are partly as a result of the heterogeneity of the measured material and differences in the surface quality, which also influence the quantification. To reduce errors from artefacts, the most rep-resentative spectra were selected from among the five spectra collected from each sample. The assignment of the 22 char-acteristic bands between 1800 cm-1and 600 cm-1are listed
in Table 2 based on the literature (Faix 1992; Pandey and
Pitman 2003; Mu¨ller et al. 2008). A low frequency band at 664 cm-1 could not be assigned but it was considered in
further analysis.
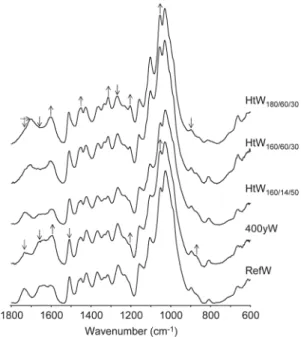
Figure 2 shows the characteristic FTIR ATR spectra of five different wood samples. The main changes in the spectra as a result of natural ageing (differences between the spectra of RefW and 400yW) were observed in the range 1800–1500 cm-1 concerning the bands 1 (1735 cm-1), 3
(1641 cm-1) and 4 (1617 cm-1). Natural ageing resulted in a
decreasing intensity of bands 1 and 3, whereas band 4 increased. These spectral changes were interpreted as mod-ification of hemicelluloses. The 400yW sample is the only one in which the intensity of band 5 (1508 cm-1) was lower
than that of band 4 (1617 cm-1). Bands 4 and 5 are
attrib-utable to the aromatic skeletal vibration of lignin. The arti-ficially aged (HtW) samples did not show remarkable changes in this regard. A similar effect in the intensity of bands 4 (1617 cm-1) and 5 (1508 cm-1) was also observed
after UV treatment of wood (Mu¨ller et al. 2003; Pandey and Vuorinen 2008) and was interpreted as lignin decay com-bined with the formation of new carbonyl groups evidencing photo-induced oxidation of the wood surface.
Artificial ageing by hydrotreatments HtW180/60/30, HtW160/ 14/50 and HtW160/60/30 (the indices are for temperature/RH/
time, respectively) also modified the band intensities in the 1800–1500 cm-1 range. A significant decrease in band 1
(1735 cm-1) and simultaneous increase in band 2 (1700 cm-1)
was visible. Accordingly, esterified carbonyl structures in xylan decreased and free acid groups increased. The small shift of band 5 (1508 cm-1) to a lower wavenumber has been
Figure 2 Qualitative analysis of the FTIR-ATR spectra of un-aged samples (RefW), 400-year-old sample (400yW) and hydrothermally treated samples of series 1 (HtW180/60/30, HtW160/14/50, HtW160/60/30). The arrows show the relative changes of intensity or the position of the several absorption bands.
Figure 3 Corrected intensity ratio of the absorption bands which are characteristic for carbonyl, carbohydrate and lignin for un-aged samples (RefW), 400-year-old samples (400yW) and hydro-thermally treated samples of series 1 (HtW180/60/30, HtW160/14/50, HtW160/60/30).
Table 3 Relevant FTIR ATR absorption bands average corrected intensity of the studied samples and the reference (RefW).
Base-line corrected band intensities Wood aged by hydrothermal
Band treatment (HtWTemp/RH/Time)
(cm-1 ) RefW 400yWold 160/14/50 160/60/30 180/60/30 1735 0.451 0.344 0.310 0.003 0.017 1700 0.000 0.000 0.020 0.375 0.506 1640 0.212 0.163 0.013 0.010 0.011 1616 0.306 0.500 0.295 0.466 0.661 1508 0.800 0.860 0.789 0.805 0.860 1462 0.089 0.080 0.085 0.088 0.074 1452 0.097 0.109 0.106 0.107 0.118 1423 0.421 0.469 0.407 0.356 0.342 1368 0.438 0.442 0.426 0.316 0.319 1334 0.052 0.075 0.055 0.084 0.089 1316 0.215 0.291 0.213 0.306 0.302 1264 0.527 0.633 0.477 0.442 0.444 1230 0.069 0.062 0.052 0.045 0.050 1204 0.091 0.145 0.110 0.177 0.260 1157 0.592 0.790 0.781 0.799 0.776 1103 0.366 0.563 0.613 0.657 1.033 1051 0.528 0.775 0.728 0.841 0.958 1026 0.977 1.044 1.037 0.853 0.900 897 0.166 0.175 0.163 0.122 0.108 876 0.011 0.012 0.000 0.040 0.040 808 0.155 0.283 0.176 0.158 0.112 664 0.196 0.238 0.189 0.229 0.277 attributed to the splitting of the aliphatic chains of lignin
(Faix 1992; Ucar et al. 2005). An increase in the intensity¸ of band 11 (1317 cm-1) as well as the shift of band 14
(1204 cm-1) has been attributed to the formation of
con-densed structures (Faix 1992). Artificial ageing by
hydro-treatment leads to the same types of chemical changes that were observed following the thermal treatment of wood. The mildest treatment in the case of HtW160/14/50(i.e., treatment
at 1608C, 14% RH for 50 h) resulted in spectral changes most similar to that of natural ageing.
Semi-quantitative analysis of FTIR ATR spectra
Semi-quantitative analysis was performed on the five spectra described above concerning the ratios of the 22 typical band intensities listed in Table 3. The intensity of the peak (height from the baseline) was corrected by calculating the height of the peak from the base of the peak. Ratios between the cor-rected intensity of band 1 (1735 cm-1, acetyl groups in xylan
and other non-conjugated carbonyls), band 5 (1508 cm-1, the
aromatic skeletal vibration of lignin), band 9 and 19 (1368 and 897 cm-1, carbohydrates) were calculated (Figure 3). All
aged samples had lower carbonyl/carbohydrate ratios (A1735/
A1368and A1735/A897) than the reference samples. The lignin/
carbohydrate ratios (A1508/A1368and A1508/A897) were
signif-icantly higher for hydrothermal treatments up to 1608C. The higher intensity of the aromatic skeletal vibration was prob-ably the result of carbohydrate decomposition or the splitting of aliphatic chains in lignin and/or condensation reactions increasing the aromatic band intensity (Faix 1992; Ucar¸ et al. 2005; Windeisen and Wegener 2008). The ratio of A1508/A1368 was slightly higher for sample 400yW, which
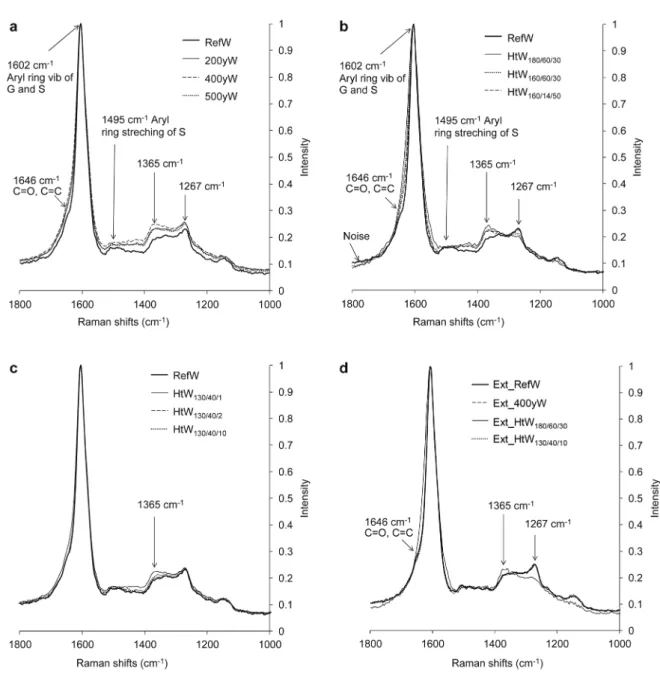
Figure 4 UVRR average spectra. (a) 200, 400, and 500-year-old spruce wood (200yW, 400yW, and 500yW) compared to recent sample (RefW). (b) Spruce wood hydrothermally treated samples of series 1 (HtW180/60/30, HtW160/14/50, HtW160/60/30) up to 1608C compared to recent sample (RefW). (c) Spruce wood hydrothermally treated samples of series 2 (HtW130/40/1, HtW130/40/2, HtW130/40/10) at 1308C compared with unaged sample (RefW). (d) Acetone-extracted naturally aged (ext_400yW), hydrothermally treated (ext_HtW180/60/30and ext_HtW130/ 40/10) spruce wood samples compared to acetone-extracted recent sample (ext_RefW). The main absorption bands showing differences are indicated with arrows.
Table 4 UVRR band assignment in the 1700–1100 cm-1
region for different wood species (Agarwal 1999; Saariho et al. 2003; Pandey and Vuorinen 2008). Band Found (cm-1) Lit. (cm-1) Compound or chemical group 1 1646 1645 Unsaturated structures of resin acids 2 1602 1605 Sym. aryl ring stretch. of G and S 3 1495 1502 Asym. aryl ring stretch. vibr. of S 4 1365 1368 Phenolic and/or cond. structure of L
5 1267 1270 Arom. ether in G
6 1150 1152 Delta phenol mode of G
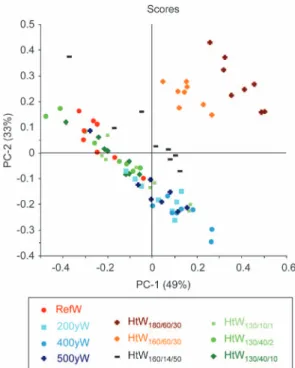
Figure 5 Principal component analysis from UVRR spectra collected for all sample sets.
of condensed structures in the lignin of naturally aged (old) samples.
UVRRS of non-extracted samples
For each sample, an average spectrum was calculated from eight UVRRS. The band assignment based on the literature in presented in Table 4. In all cases, the absorption band at 1605 cm-1was the most prominent (aromatic ring vibrations).
The intensities of the bands within 1300–1500 cm-1,
attrib-uted to the guaiacyl groups of the lignin, were higher in OldW than in RefW (Figure 4a). The small increase of the relative intensities in this region compared to the reference peak at 1602 cm-1may be as a result of a slight increase in
unsaturated structures resulting from lignin degradation. In the case of UV irradiated wood, the intensity changes were similar, but more intense (Pandey and Vuorinen 2008). The 400yW sample showed a band at 1365 cm-1 with slightly
higher intensity in comparison with the spectra of 500yW and 200yW. Consequently, differences observed between the OldW spectra are not related to the age of the sample. Other ageing factors (such as changes in moisture content or mechanical loading), independent of time, may be respon-sible for the small differences observed. As the 400yW spec-imen was taken from a floorboard, it could well have been more mechanically stressed than the 200yW or 500yW sam-ples, which were taken from roof beams. Repeated adsorp-tion and desorpadsorp-tion resulting from washing and drying of the floor might be also be a reason for such differences (Froidevaux et al. 2011).
Changes in the spectra of HtW samples treated up to 1608C (Figure 4b) were similar to the changes observed in thermally treated wood, but were less pronounced (Nuopponen et al. 2005). There was a significant increase in the absorption band at 1365 cm-1and a significant decrease
in the band at 1262 cm-1for treatment types HtW
180/60/30and
HtW160/60/30. This indicates that guaiacyl structures were
modified at high temperatures. Moreover, the band at 1646 cm-1was decreased and the bands at 1602 cm-1and in
the region 1700–1550 cm-1were broadening for the samples
HtW180/60/30 and HtW160/60/30. Pandey and Vuorinen (2008)
observed the same intensity changes in UV irradiated spruce and explained it by the formation ofo- and p-quinone type
structures. The same was true for thermomechanical pulps (Agarwal 1998; Ja¨a¨skela¨inen et al. 2006). Treatment type HtW160/14/50exhibited the same characteristics but were less
pronounced than the treatments HtW180/60/30and HtW160/60/30.
The UVRR spectra of the HtW samples of series 2 at 1308C (HtW130/40/1, HtW130/40/2, and HtW130/40/10) were
sim-ilar to RefW (Figure 4c). Only a slight increase in the band at 1365 cm-1was visible. The lignin structures did not change
following this treatment compared to RefW.
UVRRS of acetone extracted samples
Soxhlet extraction should help defining which lignin band is overlapping with acetone extractable substances. The UVRR spectra of the acetone extracted samples, RefW, 400yW, HtW180/60/30, and HtW130/40/10 are presented in Figure 4d.
With the exception of the HtW180/60/30spectra, all spectra are
nearly identical and the slight differences observed on non-extracted samples are not perceptible. Consequently, the slight UVRR spectral differences described above (between OldW, RefW, and HtW) were caused by acetone-extractable compounds. These are probably lignans or lignin degradation products (Rogers et al. 1967; Kawamura et al. 1998). Such compounds are also generated during the photo-discoloration of wood under UV-light. As the specimens were taken from layers not penetrated by UV-light, the amount of aceton-extractables could increase as a result of a sub-surface deg-radation caused by longer wavelength light that still has sufficient energy to degrade wood (Hon et al. 1980; Kataoka et al. 2007).
PCA of UVRR spectra
The UVRR spectra of all non-extracted samples were eval-uated by PCA. The first principal component (PC1) explained 49% and the second principal component (PC2) explained 33% of the differences between the spectra. Other successive PC explained no more than 5% of the dissimilar-ities and, consequently, the analysis was limited to PC1 and PC2. The plotted scores of PC1 vs. PC2 (Figure 5) shows the two largest variations in magnitude within the data and the spectra are separated on the plot. Spectra of the sample HtW180/60/30 and HtW160/60/30 form individual groups which
were well separated from the other samples. They both had positive values of PC1 and PC2, which was not the case for other groups of compounds. The other groups were overlap-ping with each other, which means that they were more sim-ilar. The position of OldW (PC1)0 and PC2-0) is opposite
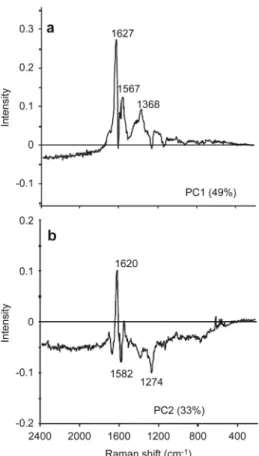
Figure 6 (a) Loading of the first principal component (PC1) of the UVRR spectra for all sets. (b) Loading of the second principal component (PC2) of the UVRR spectra for all sets.
to that of RefW (PC1-0 and PC2)0). Nevertheless, careful interpretation is needed, as the groups are partly overlapping. The loadings plot of PC1 and PC2 provides information on the bands which are responsible for grouping of the sam-ples. The loading for PC1 (Figure 6a) shows that bands at 1627 cm-1, 1567 cm-1(o- and p-quinone type structures) and
1368 cm-1 (phenolic and/or condensed structures of lignin)
are mainly responsible for the grouping of sample types HtW180/60/30and HtW160/60/30. The loading of PC2 (Figure 6b)
reveals that the band at 1620 cm-1 (o- and p-quinone type
structures) gives a positive loading and is also responsible for the grouping of samples in discussion. Grouping of the OldW samples (PC2-0) seems to be caused by the bands at 1582 cm-1(broadening of the absorption band at 1602 cm-1)
and at 1274 cm-1(aromatic ether units in guaiacyl structures).
Conclusions
Spectroscopic data of naturally aged wood samples are not changed to a great extent. According to FTIR spectra, hemi-celluloses are deteriorated in naturally aged spruce samples. The UVRR spectra of naturally aged wood show that the small differences compared with a recent reference wood are caused by acetone-extractable compounds. These compounds could include degradation products of lignin or unsaturated wood extractives. No specific correlation could be found
between the age from 200 to 500 years and spectral changes, confirming that time alone is not the only factor affecting the chemistry of wood during ageing. Additional factors, such as humidity, insects, fungi and the origin of the wood influence the changes. For artificial ageing by hydrotreat-ment up to 1608C, the changes in lignin were significant, as is the case for thermally treated wood. Samples from hydro-treatment at 1308C do not differ from the reference sample. Probably, the analytical power of FTIR and UVRRS is lim-ited, and thus additional methods, such as13C NMR or wet
chemical analyses, are needed to gain more insight into ageing.
Acknowledgments
Financial support from the Swiss National Foundation Project nr K21K-122336/1, from the Bern University of Applied Sciences and from the Regional Council of Lorraine in France is gratefully acknowledged. Dr C. Ganne-Che´deville expresses her sincere thanks to Professor Tapani Vuorinen, Head of the Department of Forest Products Technology and Lauri Rautkari for support during her visit to Aalto University. Rita Hatakka from the Department of Forest Products Technology at Aalto University is thanked for advice in UVRR spectroscopy. Dr A-S Ja¨a¨skela¨inen acknowledges the Academy of Finland for financial support.
References
Agarwal, U. (1998) Assignment of the photoyellowing-related 1675 cm-1Raman/IR band top-quinones and its implications to the mechanism of color reversion in mechanical pulp. J. Wood Chem. Technol. 18:381–402.
Borgin, K., Faix, O., Schweers, W. (1975) The effect of aging in lignins of wood. Wood Sci. Technol. 9:207–211.
Bryne, L.E., Wa˚linder, M.E.P. (2010) Ageing of modified wood. Part 1: Wetting properties of acetylated, furfurylated, and ther-mally modified wood. Holzforschung 64:295–304.
Bryne, L.E., Lausmaa, J., Ernstsson, M., Englund, F., Wa˚linder, M.E.P. (2010) Ageing of modified wood. Part 2: Determination of surface composition of acetylated, furfurylated, and thermally modified wood by XPS and ToF-SIMS. Holzforschung 64:305– 313.
Dobrica, I., Bugheanu, P., Stanculescu, I., Ponta, C. (2008) FTIR spectral data of wood used in Romanian traditional village con-structions. Analele Universitatii din Bucuresti XVII:33–37. Esbensen, K.H. (2009) Multivariate Data Analysis–In Practice, 5th
Edition. Camo Software AS., Oslo, Norway.
Faix, O. (1992) Fourier transform infrared spectroscopy. In: Methods in Lignin Chemistry. Eds Lin, S.Y., Dence, C.W. Springer-Verlag, Berlin, Heidelberg, New York, pp. 83–109. Fengel, D. (1991) Ageing and fossilization of wood and its
com-ponents. Wood Sci. Technol. 25:153–177.
Ferraz, A., Baeza, J., Rodriguez, J., Freer, J. (2000) Estimating the chemical composition of biodegraded pine and eucalyptus wood by DRIFT spectroscopy and multivariate analysis. Bioresour. Technol. 74:201–212.
Froidevaux, J., Volkmer, T., Ganne-Che´deville, C., Gril, J., Navi, P. (2011) Viscoelasticity behavior of aged and non-aged spruce wood in radial direction. Wood Mater. Sci. Eng. (in press).
Gonza´lez-Pen˜a, M.M., Hale, M.D.C. (2009a) Colour in thermally modified wood of beech, Norway spruce and Scots pine. Part 1: Colour evolution and colour changes. Holzforschung 63:385– 393.
Gonza´lez-Pen˜a, M.M., Hale, M.D.C. (2009b) Colour in thermally modified wood of beech, Norway spruce and Scots pine. Part 2: Property predictions from colour changes. Holzforschung 63:394–401.
Halttunen, M., Vyo¨rykka¨, J., Hortling, B., Tamminen, T., Batchelder, D., Zimmermann, A., Vuorinen, T. (2001) Study of residual lig-nin in pulp by UV resonance Raman spectroscopy. Holzfor-schung 55:631–638.
Hon, D.N.-S., Ifju, G., Feist, W.C. (1980) Characteristics of free radicals in wood. Wood Fiber Sci. 12:121–130.
Horn, B.A., Qiu, J., Owen, N.L., Feist, W.C. (1994) FT-IR studies of weathering effects in Western Redcedar and Southern Pine. Appl. Spectrosc. 48:662–668.
Ja¨a¨skela¨inen, A.-S., Saariaho, A.-M., Vyo¨rykka¨, J., Vuorinen, T., Mtousek, P., Parker, A.W. (2006) Application of UV-Vis and resonance Raman spectroscopy to study bleaching and photoyel-lowing of thermomechanical pulps. Holzforschung 60:231–238. Kataoka, Y., Kiguchi, M., Williams, R.S., Evans, P.D. (2007) Violet light causes photodegradation of wood beyond the zone affected by ultraviolet radiation. Holzforschung 61:23–27.
Kawamura, F., Miyachi, M., Kawai, S., Ohashi, H. (1998) Photo-discoloration of western hemlock (Tsuga Heterophylla) sapwood III*. Early stage of photodiscoloration reaction with lignans. J. Wood Sci. 44:47–55.
Lavoie, J.-M., Stevanovic, T. (2006) Yield and composition of lipo-phylic extracts of yellow birch (Betula alleghaniensis Britton) as a function of wood age and aging under industrial conditions. Holzforschung 60:184–189.
Martin, Z.M., Labbe´, N., Rials, T.G., Wullschleger, S.D. (2005) Analysis of preservative-treated wood by multivariate analysis of laser-induced breakdown spectroscopy sprectra. Spectrochim. Acta, Part B 60:1179–1185.
Matsuo, M., Yokoyama, M., Umemura, K., Sugiyama, J., Kawai, S., Gril, J., Kubodera, S., Mitsutani, T., Ozaki, H., Sakamoto, M., Imamura, M. (2011) Aging of wood: analysis of color changes during natural aging and heat treatment. Holzforschung 65:361–368.
Mononen, K., Ja¨a¨skela¨inen, A.-S., Alvila, L., Pakkanen, T.T., Vuorinen, T. (2005) Chemical changes in silver birch (Betula pendula Roth) wood caused by hydrogen peroxide bleaching and monitored by color measurement (CIELab) and UV-Vis, FTIR and UVRR spectroscopy. Holzforschung 59:381–388.
Mu¨ller, G.S. FTIR-ATR spectroscopic and FTIR-FPA microscopic investigations on panel board production processes using Grand fir (Abies grandis (Douglas ex D. Don) Lindl. and European beech (Fagus sylvatica L.). PhD thesis of the University of Go¨ttingen, Go¨ttingen, Germany, 2008.
Mu¨ller, U., Ra¨tzsch, M., Schwanninger, M., Steiner, M., Zo¨bl, H. (2003) Yellowing and IR-changes of spruce wood as result of UV-irradiation. J. Photochem. Photobiol. B. Biology 69:97–105. Nuopponen, M., Wikberg, A., Vuorinen, T., Maunu, S.L., Ja¨msa¨, S., Viitaniemi, P. (2004) Heat-treated softwood exposed to weath-ering. J. Appl. Polym. Sci. 91:2128–2134.
Nuopponen, M., Vuorinen, T., Ja¨msa¨, S., Viitaniemi, P. (2005) Ther-mal modifications in softwood studied by FT-IR and UV reso-nance Raman spectroscopies. J. Wood Chem. Technol. 24: 13–26.
Nuopponen, M., Wikberg, H.I., Birch, G.M., Ja¨a¨skela¨inen, A.-S., Maunu, S.L., Vuorinen, T., Stewart, D. (2006) Characterization of 25 tropical hardwoods with Fourier transform infrared, ultra-violet resonance Raman and13C-NMR cross-polarization/magic-angle spinning spectroscopy. J. Appl. Polym. Sci. 102:810–819. Pandey, K.K., Pitman, A.J. (2003) FTIR studies of the changes in wood chemistry following decay by brown-rot and white-rot fungi. Int. Biodeterior. Biodegrad. 52:151–160.
Pandey, K.K., Vuorinen, T. (2008) UV resonance Raman spectro-scopic study of photodegradation of hardwood and softwood lig-nins by UV laser. Holzforschung 62:183–188.
Popescu, C.-M., Sakata, Y., Popescu, M.-C., Osaka, A., Vasile, C. (2005) Degradation of lime wood painting supports. E-Preser-vation Science 2:19–29.
Rogers, I.H. A review of the wood and bark extractives of spruces. Department of Forestry and Rural Development, Otawa, Canada, 1967.
Saariaho, A.-M., Ja¨a¨skela¨inen, A.-S., Nuopponen, M., Vuorinen, T. (2003) Ultra violet resonance Raman spectroscopy in lignin analysis: determination of characteristic vibrations of p-hydroxylphenyl, guaiacyl, and syringyl lignin structures. Appl. Spectrosc. 57:58–66.
Saariaho, A.-M., Argyropoulos, D.S., Ja¨a¨skela¨inen, A.-S., Vuorinen, T. (2005) Development of the partial least squares models for the interpretation of the UV resonance Raman spectra of lignin model compounds. Vib. Spectrosc. 37:111–121.
Tjeerdsma, B.F., Militz, H. (2005) Chemical changes in hydrother-mal treated wood: FTIR analysis of combined hydrotherhydrother-mal and dry heat-treated wood. Holz Roh Werkst. 63:102–111. Tjeerdsma, B.F., Boonstra, M., Pizzi, A., Tekely, P., Militz, H.
(1998) Characterisation of thermally modified wood: molecular reasons for wood performance improvement. Holz Roh Werkst. 56:149–153.
Tuong, V.M., Li, J. (2011) Changes caused by heat treatment in chemical composition and some physical properties of acacia hybrid sapwood. Holzforschung 65:67–72.
Ucar, G., Meier, D., Faix, O., Wegener, G. (2005) Analytical pyrol-¸ ysis and FTIR spectroscopy of fossilSequoiadendron giganteum (Lindl.) wood and MWLs isolated hereof. Holz Roh Werkst. 63:57–63.
Windeisen, E., Wegener, G. (2008) Behaviour of lignin during ther-mal treatments of wood. Ind. Crops Prod. 27:157–162. Windeisen, E., Strobel, C., Wegener, G. (2003) Chemische
Charak-terisierung von thermisch belastetem Holz: Bestimmung des Acetylgruppengehalts und FTIR-Spektroskopie. Holz Roh Werkst. 61:471–472.
Windeisen, E., Ba¨chle, H., Zimmer, B., Wegener, G. (2009) Rela-tions between chemical changes and mechanical properties of thermally treated wood 10thEWLP, Stockholm, Sweden, August 25–28, 2008. Holzforschung 63:773–778.
Received January 17, 2011. Accepted August 8, 2011. Previously published online September 9, 2011.