HAL Id: inserm-01820311
https://www.hal.inserm.fr/inserm-01820311
Submitted on 21 Jun 2018
HAL is a multi-disciplinary open access
archive for the deposit and dissemination of
sci-entific research documents, whether they are
pub-lished or not. The documents may come from
teaching and research institutions in France or
abroad, or from public or private research centers.
L’archive ouverte pluridisciplinaire HAL, est
destinée au dépôt et à la diffusion de documents
scientifiques de niveau recherche, publiés ou non,
émanant des établissements d’enseignement et de
recherche français ou étrangers, des laboratoires
publics ou privés.
Pascal Jézéquel, Delphine Loussouarn, Catherine Guérin-Charbonnel, Loïc
Campion, Antoine Vanier, Wilfried Gouraud, Hamza Lasla, Catherine Guette,
Isabelle Valo, Veronique Verrièle, et al.
To cite this version:
Pascal Jézéquel, Delphine Loussouarn, Catherine Guérin-Charbonnel, Loïc Campion, Antoine Vanier,
et al.. Gene-expression molecular subtyping of triple-negative breast cancer tumours: importance of
immune response. Breast Cancer Research, BioMed Central, 2015, 17, pp.43.
�10.1186/s13058-015-0550-y�. �inserm-01820311�
R E S E A R C H A R T I C L E
Open Access
Gene-expression molecular subtyping of
triple-negative breast cancer tumours: importance
of immune response
Pascal Jézéquel
1,2,3,4*, Delphine Loussouarn
4,5, Catherine Guérin-Charbonnel
1,2,4, Loïc Campion
4,6, Antoine Vanier
7,8,
Wilfried Gouraud
1,2,4, Hamza Lasla
2, Catherine Guette
9, Isabelle Valo
10, Véronique Verrièle
10and Mario Campone
2,4,11Abstract
Introduction: Triple-negative breast cancers need to be refined in order to identify therapeutic subgroups of patients.
Methods: We conducted an unsupervised analysis of microarray gene-expression profiles of 107 triple-negative breast cancer patients and undertook robust functional annotation of the molecular entities found by means of numerous approaches including immunohistochemistry and gene-expression signatures. A triple-negative external cohort (n = 87) was used for validation.
Results: Fuzzy clustering separated triple-negative tumours into three clusters: C1 (22.4%), C2 (44.9%) and C3 (32.7%). C1 patients were older (mean = 64.6 years) than C2 (mean = 56.8 years;P = 0.03) and C3 patients (mean = 51.9 years; P = 0.0004). Histological grade and Nottingham prognostic index were higher in C2 and C3 than in C1 (P < 0.0001 for both comparisons). Significant event-free survival (P = 0.03) was found according to cluster membership: patients belonging to C3 had a better outcome than patients in C1 (P = 0.01) and C2 (P = 0.02). Event-free survival analysis results were confirmed when our cohort was pooled with the external cohort (n = 194; P = 0.01). Functional annotation showed that 22% of triple-negative patients were not basal-like (C1). C1 was enriched in luminal subtypes and positive androgen receptor (luminal androgen receptor). C2 could be considered as an almost pure basal-like cluster. C3, enriched in basal-like subtypes but to a lesser extent, included 26% of claudin-low subtypes. Dissection of immune response showed that high immune response and low M2-like macrophages were a hallmark of C3, and that these patients had a better event-free survival than C2 patients, characterized by low immune response and high M2-like macrophages:P = 0.02 for our cohort, and P = 0.03 for pooled cohorts.
Conclusions: We identified three subtypes of triple-negative patients: luminal androgen receptor (22%), basal-like with low immune response and high M2-like macrophages (45%), and basal-enriched with high immune response and low M2-like macrophages (33%). We noted out that macrophages and other immune effectors offer a variety of therapeutic targets in breast cancer, and particularly in triple-negative basal-like tumours. Furthermore, we showed that CK5 antibody was better suited than CK5/6 antibody to subtype triple-negative patients.
* Correspondence:Pascal.jezequel@ico.unicancer.fr
1
Unité Mixte de Génomique du Cancer, Institut de Cancérologie de l’Ouest -site René Gauducheau, Bd J. Monod, 44805 Saint Herblain Cedex, France
2
Unité de Bioinfomique, Institut de Cancérologie de l’Ouest - site René Gauducheau, Bd J. Monod, 44805 Saint Herblain Cedex, France Full list of author information is available at the end of the article
© 2015 Jézéquel et al.; licensee BioMed Central. This is an Open Access article distributed under the terms of the Creative Commons Attribution License (http://creativecommons.org/licenses/by/4.0), which permits unrestricted use, distribution, and reproduction in any medium, provided the original work is properly credited. The Creative Commons Public Domain Dedication waiver (http://creativecommons.org/publicdomain/zero/1.0/) applies to the data made available in this article, unless otherwise stated.
Introduction
Breast cancer heterogeneity makes it difficult to bring personalized medicine into the clinic. For many years, research has been aimed at deciphering molecular pres-entation of this disease to identify subgroups of patients with clinical significance, such as prognosis or response to therapy, in order to optimize patient management. Immunohistochemistry (IHC)-typed triple-negative (TN) tumours, which represent 12 to 17% of primary breast cancer, are among the most aggressive and deadly breast cancer subtypes [1]. The lack of oestrogen, progesterone and HER2 receptors makes its therapeutic management optimisation difficult. Furthermore, TN breast cancer tu-mours are also known to be heterogeneous. The era of large-scale science, which is linked both to recent technological advances and to the availability of full gen-etic information, has boosted the research for new bio-markers and molecular subtyping. In 2000 and 2001, breast tumour gene-expression profiling (GEP) revealed five intrinsic subtypes: luminal A, luminal B, HER2-enriched (HER2-E), basal-like and normal breast-like [2,3]. Luminal A tumours were associated with a better prognosis in comparison with other subtypes, which dis-played similar bad prognoses. Luminal and HER2-E sub-types defined subgroups of patients who could receive targeted therapies (hormonotherapy and trastuzumab, respectively). Basal-like tumours are often mixed up with TN tumours; the main difference comes from the typing method (GEP for basal-like and IHC for TN). Compara-tive studies showed that not all TN tumours are identified as basal-like (approximately 80%), and not all basal-like tumours are TN [1,4]. Both types affect younger patients, and are linked to a bad prognosis and no possibility of tar-geted therapy. Other works refined TN subtyping and identified a new molecular entity, named claudin-low, characterized by low expression of cell-cell adhesion clus-ter containing claudin 3, 4, 7 and E-cadherin, luminal and proliferation-associated genes, enrichment in epithelial-to-mesenchymal transition (EMT) features, immune system responses, and stem cell-associated biological processes [5,6]. No prognostic difference was noted between basal-like and claudin-low patients [6]. An interferon-rich subgroup, characterized by high expression of interferon-regulated genes, was further discovered [7]. Gene Ontology (GO) categories of these genes underlined “immune re-sponse” and “defense rere-sponse”. Later, six molecular subtypes were also identified in TN: like 1, basal-like 2, immunomodulatory, mesenchymal-basal-like, mesen-chymal stem-like, and luminal androgen receptor (LAR) [8]. Today, heterogeneity within basal-like and TN is still controversial and requires further research, including new cohorts, to understand the complexity of the dis-ease, and to identify molecular drivers that could be therapeutically targeted [1,6].
In this study, we conducted an unsupervised analysis of a new cohort of 107 TN breast cancer patients and undertook robust functional annotation of the main mo-lecular entities found by means of numerous comple-mentary approaches.
Methods
Patients
The bi-centric studied cohort retrospectively included 107 randomly selected women whose primary breast tumours lacked immunohistochemical expression of oestrogen re-ceptor (ER), progesterone rere-ceptor (PR) and HER2; hence subtyped as TN tumours. Patients were diagnosed and treated primarily between 1998 and 2007 at the Institut de Cancérologie de l'Ouest – René Gauducheau (n = 65) and the Institut de Cancérologie de l'Ouest– Paul Papin (n = 42). Of the 107 patients, 44 relapsed and 63 were disease-free after the up period (median follow-up = 7 years). All patients showed no evidence of relapse at the time of diagnosis. None had received chemother-apy, endocrine therapy or radiation therapy prior to sur-gery. Treatment decisions and follow-up processes were based solely on international recommendations. The follow-up data of patients included clinical examination and mammography every 6 months for 2 years and an-nually thereafter. Informed consent was obtained from patients to use their surgical specimens and clinicopatho-logical data for research purposes, as required by the French Committee for the Protection of Human Subjects (CCPPRB). Ouest IV– Nantes CCPPRB approved use of tumour tissues for this study (6 May 2013: n°. 357/2013). Collection of tumours was approved by French Minister of higher education and research (n°. AC-2008-141). This study did not need additional ethical approval.
Tumour tissues
All tumour tissue samples were surgically collected and processed in two parts by a pathologist. The first part was fixed in 10% neutral buffered formalin for standard histological analysis and IHC. The second part was im-mediately macrodissected, snap-frozen in liquid nitrogen and stored until RNA extraction.
RNA extraction
Total RNA was prepared following standard protocols then treated with Dnase I using the RNeasy column purification system (Qiagen, Courtaboeuf, France). Assessment of RNA quality, integrity and purity was done through a Bionalyser 2100 (Agilent Technologies, Palo Alto, CA, USA). RNA samples were considered for further analysis only if they had distinct 28 S and 18 S ribosomal peaks.
Gene expression profiling
Gene expression analysis was performed using Affyme-trix® Human Genome U133 Plus 2.0 Arrays (AffymeAffyme-trix®, Santa Clara, CA, USA) measuring over 43,000 tran-scripts representing over 20,000 human genes. cRNA synthesis and labelling, as well as chip hybridisation, washing and image scanning were performed according to the manufacturer’s protocol. All microarrays complied with quality criteria. Microarray and patient clinical data have been deposited in the Gene Expression Omnibus (GEO) under the GSE58812 accession number.
Bioinformatics
Internal and external data pre-processing
Bioclinical and expression data of the external cohort used for validation were available from the GEO, acces-sion number GSE21653 [9,10]. For both our cohort and the external cohort, the Affymetrix® CEL files (raw data) were MAS5-normalized in the Affymetrix Expression Console (v1.3.1) and then log2-transformed.
Unsupervised analysis
To organise data into groups with the same underlying molecular characteristics, we performed clustering ana-lysis based on the 5% most variable probe sets (n = 2,734) by means of the fuzzy clustering method. Fuzzy clustering permits each patient to have a probability of membership to each cluster along with the cluster number, with the sum of all cluster membership probabilities being 1 for any patient. Briefly, the method is based on the minimiza-tion of Xn k¼1 X i;j u i; kð Þ r u j; kð Þrd i; jð Þ 2X j u j; kð Þ r , where n is the
number of clusters, i and j represent the patients, u(i,k) is the membership of patient i for cluster k, r is the fuzziness index and d(i,j) is the dissimilarity between patients i and j (centred Pearson distance in our study). To decide how many clusters were present in our data we calculated two indices, the Dunn index and the Calinski and Harabasz index, considering two to 10 clusters, but we also per-formed a hierarchical clustering to visualise the partition and study the concordance of both clustering methods. All computations showed either two or three clusters (similar results for both numbers). It was decided to create three clusters and study the membership probabilities.
Cluster functional annotation
To annotate the clusters found, we used clinicopathologic characteristics, 10 IHC markers, 17 gene-expression signa-tures (GES), GO biological process terms enrichment, and intuitive single gene-expression approach. Differences among the three clusters for the different characteristics were assessed by analysis of variance (along with Tukey’s
HSD (honest significant differences) test in case of signifi-cance) for continuous variables, Fisher’s exact test for cat-egorical variables, and Cox regression model or Kaplan-Meier survival curves (along with logrank test) for survival data. Correlations between GES were measured by Pear-son’s correlation coefficient.
Tissue microarrays and imunohistochemistry Tissue microarray construction
Hemalun-eosin-safran (HES)-stained sections were re-viewed and the area of interest was marked out on the slide. For each case, three representative tumour areas were selected from the HES-stained slide of the paraffin-embedded donor block. Using a tissue arrayer (Beecher Instruments, Sun Prairie, WI, USA), 1-mm diameter cores of breast cancer tissue were punched out from the paraffin-embedded tissue block and placed into recipient paraffin blocks. A control tissue sample (normal breast) was included in each recipient paraffin block. Before im-munostaining, HES-stained slides of the final array blocks were examined to confirm the representative areas of the tumours in comparison to the original HES-stained section.
Immunohistochemistry and scoring
Sections of paraffin-embedded tissue microarray blocks (4 μm thick) were deparaffinized in xylene and rehy-drated through a graded series of alcohol. IHC was per-formed using the EnVision Detection Systems (Dako, Les Ulis, France) according to the manufacturer’s in-structions; 3,3′-diaminobenzidine was used as a chromo-gen. The sections were counterstained with haematoxylin. Details of the antigen retrieval technique and dilution of the primary antibodies (CK5/6, CK5, HER1, androgen re-ceptor (AR) Ki-67, FOXA1, E-cadherin, claudin 3, claudin 4 and claudin 7) are described in Additional file 1. Immu-nostaining results were assessed by a pathologist in a blinded manner. Immunoreactivity of each target in the tis-sue microarray cores was scored as a percentage of cells stained and/or staining intensity. Immunohistochemical staining interpretation is displayed in Additional file 2.
Gene-expression signatures
Seventeen GES were used to annotate the three clusters: three single sample predictors (SSPs) (Sorlie’s SSP, Hu’s SSP and Parker’s SSP (PAM50)), proliferation score, a subtyp-ing tool for TN breast cancer (TNBCtype), Teschendorff’s GES, vascular endothelial growth factor (VEGF) profile, glycolysis profile, claudin-low signature and seven im-mune metagenes [6-8,11-16]. Furthermore, in order to discriminate macrophages into M1-like or M2-like sub-populations, which could not be identified by Rody’s HCK metagene, we established an M2/M1 GES based on Beyer’s microarray data (GSE35449) [17]. The significance
analysis of microarrays (SAM) method was applied to find the probes differentially expressed between M1 and M2 populations, and genes for which all corresponding probes exhibited a Q-value of 0% were retained. The GES was then computed in our cohort as the weighted mean of the genes retained, weights being +1 or−1, depending on the expression of each gene in M2 relative to M1. When a gene was represented by multiple probe sets, the median of the different probe sets was taken as the unique value for the gene. Methods are summarized in Additional file 3.
Single gene-expression intuitive approach
An intuitive approach was also used to annotate patient clusters. Based on breast cancer transcriptomic studies, we selected representative genes (n = 49) of molecular subtypes (luminal, HER2-E, basal-like, claudin-low) and biological processes (proliferation, breast stem cells, EMT, cell migra-tion, immune system response and angiogenesis) [6,18]. Their expressions were compared in function of clusters.
Gene ontology biological process terms enrichment
Functional annotation of each cluster through biological process analysis was performed using DAVID bioinfor-matics resources 6.7 (the Database for Annotation, Visualization, and Integrated Discovery), Gorilla and ToppGene web tools to discover the GO categories with significantly enriched gene numbers [19-22]. Two methods were used to select genes differentially expressed across the clusters. The SAM method was performed to obtain lists of genes with significantly different expression be-tween clusters (one versus the others and two-by-two); genes for which all corresponding probe sets had a Q-value of 0% were retained. In addition to the SAM method, expression of the 2,734 most variable probe sets was represented on a heatmap, with patients ordered ac-cording to the fuzzy clusters. Ward hierarchical clustering was performed on the probe sets, and clusters of corre-sponding genes with visually differential expression among the clusters of patients were retained.
Unsupervised external validation process
The same global process as the one applied to our co-hort was also applied to the TN patients of the external cohort (GSE21653) to validate unsupervised analysis re-sults. Moreover, the prediction analysis for microarrays (PAM) method was used to predict clusters obtained with our cohort - the predictor was trained on our co-hort and then applied to GSE21653 TN patients; the predict clusters were then compared to the ones ob-tained by fuzzy clustering.
Statistical analysis
All statistical analyses were performed with R [23] and the packages amap, cluster, ggplots, grid, pamr, samr,
survival. All P-values are two-sided; P-values less than 5% are considered significant.
Results
External data selection and pre-processing
We selected the GSE21653 cohort for external validation because the status of ER, PR and HER2 were available and gene expressions were measured with the same DNAchip as for our cohort. Of the 266 patients that composed the GSE21653 cohort, 87 patients were TN.
Unsupervised analysis
We chose a fuzzy clustering method to investigate mo-lecular differences among our TN cohort because it keeps the possibility for each patient to belong to mul-tiple clusters at the same time but with different “de-grees of membership”. Fuzzy clustering separated TN tumours into three clusters, named C1 (n = 24; 22.4%), C2 (n = 48; 44.9%) and C3 (n = 35; 32.7%) (Figure 1). Distribution of samples in all three clusters was inde-pendent of a patient’s origin (n = 2) (P = 0.25). Fuzzy clustering probabilities demonstrated that C1 was more robust than C2 and C3 (C1: minimum of probabilities = 73%, median = 98%, 20 C1 patients (83%) with probabil-ity >90%; C2: minimum of probabilities = 49%, median = 79%, 36 C2 patients (75%) with probability <90%; C3: minimum of probabilities = 42%, median = 85%, 19 C3 patients (54%) with probability <90%) and that C2 and C3 were very close. If we consider only the C2 and C3 patients, the smallest difference between the probability
Figure 1 Fuzzy clustering of 107 triple-negative breast cancer patients. Distribution of patients based on probability of belonging to cluster C1 (blue), C2 (red) and C3 (green). Each vertex of the triangle represents a cluster and each point represents a patient, placed as the barycentre of the triangle, weights being the probabilities of belonging to each of the clusters. Hence, the closer a point is to one of the vertices, the greater is the probability of the patient belonging to the corresponding cluster.
of belonging to C2 and the one of belonging to C3 was only 1%; for 11 patients (13%), this difference was below 20%.
Cluster functional annotation
Cluster functional annotation results are detailed in the five following sections: clinicopathologic characteristics, IHC, GES, single gene-expression intuitive approach and GO biological process terms enrichment.
Clinicopathologic characteristics
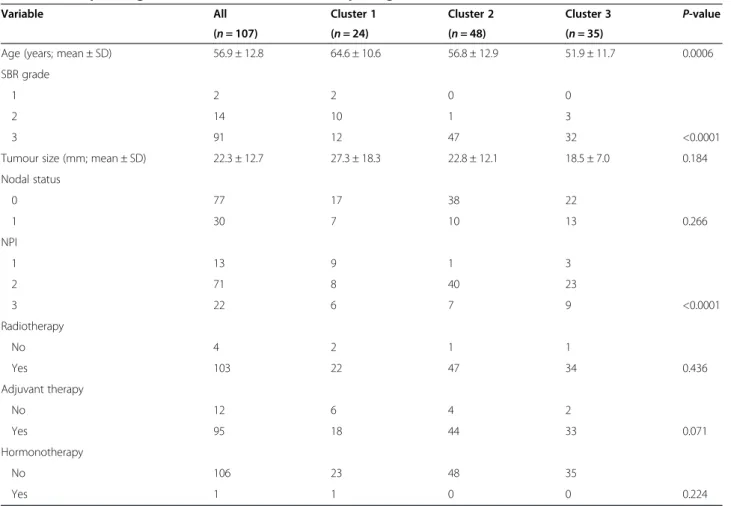
We have selected 107 breast carcinomas that were shown to lack IHC expression of ER, PR and HER2. The clinicopathologic characteristics of these 107 tumours are displayed in Table 1. Patients belonging to C1 were older (mean = 64.6 years) than patients included in C2 (mean = 56.8 years; P = 0.03) and in C3 (mean = 51.9 years; P = 0.0004). No significant age difference was observed between C2 and C3 (P = 0.17). Histological grade and Nottingham prognostic index (NPI) were higher in C2 and C3 than in C1. These results showed that C1 was dif-ferent from C2 and C3, and that C1 seemed to be charac-terized by a less aggressive illness according to age, histological grade and NPI. A significant event-free survival
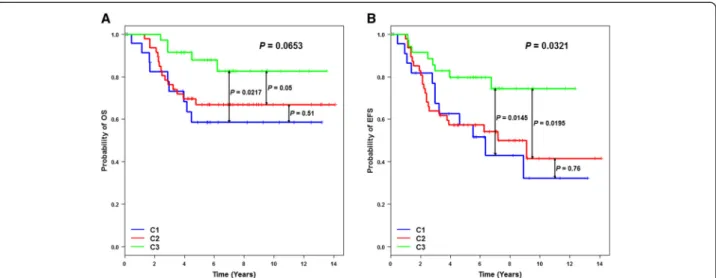
(EFS) (P = 0.0321) and a trend for overall survival (OS) (P = 0.0653) were found according to cluster membership (Figure 2). Patients belonging to C3 had a better EFS than patients in C1 (P = 0.0145) and C2 (P = 0.0195). No out-come difference existed between C1 and C2 (P = 0.76). EFS results were confirmed when our cohort was pooled with the GSE21653 TN patients (P = 0.01) (Additional file 4). Patients belonging to C3 had a better EFS than patients in C1 (P = 0.03) and C2 (P = 0.002), and no out-come difference was observed between C1 and C2 (P = 0.45). One main reason might explain why patients be-longing to C1 had a poor prognosis; C1 included numer-ous PAM50 luminal subtypes (10 out of 24; mainly luminal B (A, n = 1; B, n = 9)), which are characterized by a poor outcome. Furthermore, these luminal patients did not receive hormonotherapy. The same observation was made for GSE21653 and the equivalent cluster C1’, which included several luminal patients (7/27 (A, n = 1; B, n = 6)).
Immunohistochemistry
Basal-like phenotype, as defined by Nielsen and col-leagues [24] (ER negative and HER2 negative, and CK5/
Table 1 Clinicopathologic characteristics of the studies triple-negative tumours
Variable All Cluster 1 Cluster 2 Cluster 3 P-value (n = 107) (n = 24) (n = 48) (n = 35)
Age (years; mean ± SD) 56.9 ± 12.8 64.6 ± 10.6 56.8 ± 12.9 51.9 ± 11.7 0.0006 SBR grade
1 2 2 0 0
2 14 10 1 3
3 91 12 47 32 <0.0001
Tumour size (mm; mean ± SD) 22.3 ± 12.7 27.3 ± 18.3 22.8 ± 12.1 18.5 ± 7.0 0.184 Nodal status 0 77 17 38 22 1 30 7 10 13 0.266 NPI 1 13 9 1 3 2 71 8 40 23 3 22 6 7 9 <0.0001 Radiotherapy No 4 2 1 1 Yes 103 22 47 34 0.436 Adjuvant therapy No 12 6 4 2 Yes 95 18 44 33 0.071 Hormonotherapy No 106 23 48 35 Yes 1 1 0 0 0.224
6 and/or HER1 positive) was found in 50% of C1 pa-tients (the same result was found with CK5), and 71% or 92% in C2 + C3 patients by means of CK5/6 or CK5, re-spectively. Our results showed that CK5 IHC expression was more concordant with gene expression profiling re-sults than CK5/6: 92% of C2 + C3 patients were typed as basal-like by means of CK5 and/or HER1 positivity and 71% by means of CK5/6 and/or HER1 positivity. Further-more, considering CK5 and CK5/6 alone, 83% of C2 + C3 patients showed positivity for CK5 but only 34% had posi-tivity for CK5/6 (P = 0.0019). Hence, CK5 should be used to demonstrate basal-like characteristics, as underlined by a few studies [25,26]. Briefly, functional annotation of fuzzy cluster results by means of IHC markers showed that C1 was not a basal-like cluster (AR and FOXA1 posi-tive, low Ki-67 expression) and, on the contrary, that C2 and C3 were basal-like (CK5 and/or HER1 positive, high Ki-67 expression) (Table 2). C2 and C3 could not be dis-tinguished based on IHC claudin-low markers (claudin 3, 4, 7 and E-cadherin). No statistical link was found be-tween low claudin 3, 4 or 7 and claudin-low subtype as defined by Prat (P = 0.99, P = 0.56, P = 0.35, respectively) or between IHC claudin-low (claudin 3, 4, 7 negative and/ or E-cadherin negative) and claudin-low (P = 0.52) [6].
Gene-expression signatures
GES subtyping results are discussed below and detailed in Table 3 and Figure 3.
Single sample predictor annotation Assignment of pa-tients to a particular molecular subtype by means of SSP is dependent on the SSP used; for this reason, we used three available SSPs [27]. These signatures showed that C1 essentially contained non-basal-like subtypes (Table 3,
Additional file 5). This cluster was mostly composed of luminal A and B subtypes, and unclassified tumours. In C1, PAM50 subtyping identified 79.1% of luminal sub-types (luminal A (20.8%) and B (58.3%)) and only one basal-like tumour. According to luminal enrichment of C1 and IHC results for AR, C1 should be named LAR. C2 was an almost pure basal-like cluster whatever the SSP used. In C2, one patient, who was subtyped as nor-mal breast-like by means of PAM50, unclassified by Hu’s SSP and basal-like by Sorlie’s SSP, presented an adenoid cystic carcinoma, which is considered as a TN phenotype
Figure 2 Kaplan-Meier analyses of 107 triple-negative breast cancer patients based on fuzzy-clustering partition. (A) Overall survival (OS) analysis shows that C3 patients have a better outcome than C1 (P = 0.0217) and C2 patients (P = 0.05). (B) Event-free survival (EFS) analysis shows the same result: C3/C1,P = 0.0145; C3/C2, P = 0.0195.
Table 2 Functional annotation of fuzzy clusters by means of immunohistochemistry
Marker interpretation C1 C2 C3 P-value (n = 24) (n = 48) (n = 35)
CK5/6 and/or HER1 positive 50% 71% 0.077 CK5 and/or HER1 positive 50% 92% <10−5 Ki-67 positive 29% 87% 2.10−7 AR positive 73% 5% <10−9 FOXA1 positive 73% 5% 7.10−13 E-cadherin positive 64% 48% 0.197 - 42% 56% 0.236 Claudin 3 positive 38% 59% 0.085 - 58% 60% 0.879 Claudin 4 positive 91% 93% 0.672 - 92% 94% 0.990 Claudin 7 positive 18% 12% 0.485 - 12% 11% 0.990 Claudin 3, 4, 7 negative and/or
E-cadherin negative
38% 52% 0.261 - 58% 43% 0.163
with an excellent prognosis [28]. This could explain why this tumour had a different molecular assignment com-pared to other C2 tumours. C3 included mostly basal-like subtypes, but to a lesser extent than C2 (91.4% by PAM50 SSP, 85.7% by Hu’s SSP and 65.7% by Sorlie’s SSP).
Proliferation score Proliferation score significantly de-creased from C2 to C3 (P < 0.0074), then from C3 to C1 (P < 0.0001). It is important to notice that the two
basal-like-enriched clusters (C2 and C3) presented a signifi-cantly different proliferation score.
TNBCtype TNBCtype classification assigned a TNBC subtype to 78.5% of our tumours (Table 3, Additional file 6). Most of the unstable (that is, unclassified) tumours belonged to C1 (48%). C1 was LAR-enriched (61.5% of classified patients), and LAR subtypes were exclusively assigned to this cluster. This result confirmed that C1 was
Table 3 Gene-expression profiling of the three clusters
GES name Cluster 1 Cluster 2 Cluster 3 P-value
(n = 24) (n = 48) (n = 35) Sorlie’s SSP Basal-like 0 48 23 <0.0001 HER2-E 1 0 0 Luminal A 1 0 0 Luminal B 9 0 8 Unclassified 13 0 4 Hu’s SSP Basal-like 0 47 30 <0.0001 HER2-E 0 0 0 Luminal A 8 0 0 Luminal B 0 0 0 Unclassified 16 1 5
Parker’s SSP = PAM50 Basal-like 1 47 32 <0.0001
HER2-E 0 0 0
Luminal A 5 0 0
Luminal B 14 0 2
NBL 3 1 1
Unclassified 1 0 0
Proliferation score (mean ± sd) 8.64 ± 0.97 10.22 ± 0.63 9.74 ± 0.57 <0.0001
TNBCtype BL1 0 20 5 <0.0001 BL2 2 3 1 IM 0 0 19 LAR 8 0 0 M 0 18 0 MSL 3 1 4 Unclassified 11 6 6 Teschendorff’s GES CC+ 0 7 0 CC+/IR+ 0 41 33 IR+ 1 0 1 SR+ 13 0 0 Unclassified 10 0 1
VEGF profile (mean ± SD) 9.20 ± 0.49 9.85 ± 0.51 9.53 ± 0.42 <0.0001 Glycolysis profile (mean ± SD) 10.48 ± 0.55 10.84 ± 0.46 10.63 ± 0.43 0.0073
Claudin-low Claudin-low 0 1 9 0.0002
Other 24 47 26
BL, basal-like; CC, cell cycle; GES, gene-expression signatures; IM, immunomodulatory; IR, immune response; LAR, luminal androgen receptor; M, mesenchymal; MSL, mesenchymal stem-like; NBL, normal breast-like; SR, steroid hormone receptor; SSP, single sample predictor; VEGF, vascular endothelial growth factor.
not a basal-like cluster as shown with the SSPs. C2 was basal-like 1 enriched and mesenchymal enriched (47.6% and 42.8%, respectively). Basal-like 1 and basal-like 2 rep-resented 55% of C2. C3 was immunomodulatory enriched and mesenchymal stem-like enriched (65.5% and 13.8%, respectively). Mesenchymal stem-like, characterized by
low expression of proliferation genes compared to mesenchymal-like, was mostly found in C1 and C3. All im-munomodulatory subtypes were included in C3. Immune response distinguished C3 from C2. Distribution of TNBCtype subtypes as a function of PAM50 basal-like or non-basal-like led to the same conclusion as Masuda and
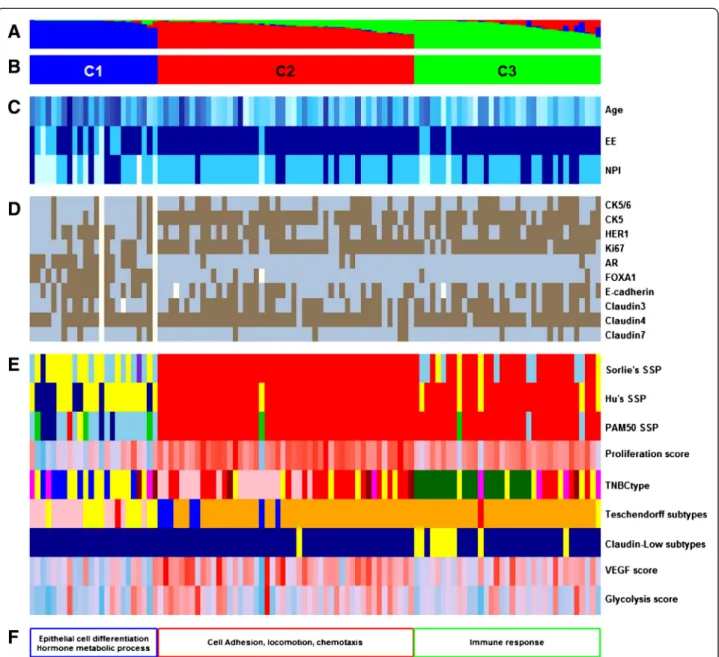
Figure 3 Functional annotations of the clustering results of our cohort. (A) Fuzzy-clustering probability of belonging to clusters, from 0 to 1. (B) Cluster numbering scheme. (C) Clinicopathologic characteristics with significant differences between clusters. Age as a continuous colour scale, from 28 years old (pale turquoise) to 85 years old (dark blue); Elston-Ellis (EE) histological grades 1 (pale turquoise), 2 (deep sky blue), and 3 (dark blue); Nottingham prognostic index (NPI) 1 (pale turquoise), 2 (deep sky blue), and 3 (darkblue). (D) Immunohistochemistry results for ten markers: positive (brown) and negative (blue). (E) Molecular subtyping by means of nine gene expression signatures (GES): three single sample predictors (SSPs) - luminal A (dark blue), luminal B (sky blue), HER2-E (purple), basal-like (red), normal breast-like (green) or unclassified (yellow); proliferation (continuous colour scale from minimum (6.59; deep sky blue) to maximum (11.05; red)); TNBCtype (basal-like 1 (red), basal-like 2 (dark red), immunomodulatory (dark green), mesenchymal-like (pink), mesenchymal stem-like (magenta), luminal androgen receptor (blue) and unclassified tumours (yellow)); Teschendorff’s GES (cell cycle (blue), cell cycle and immune response (orange), extracellular matrix (green), immune response (red), steroid hormone response (pink) and unclassified (yellow)); claudin-low (claudin-low (yellow), other (darkblue)); vascular endothelial growth factor (VEGF; continuous colour scale, from minimum (8.13; deep sky blue) to maximum (10.67; red)); and glycolysis (continuous colour scale, from minimum (9.63; deepskyblue) to maximum (11.88; red)). (F) Gene ontology biological process terms enrichment. Missing values are in white.
colleagues [29] - non-PAM50 basal-like subtypes (C1 in our study) were mostly composed of LAR and mesenchy-mal stem-like subtypes (unclassified excluded).
Teschendorff’s gene-expression signature Teschendorff’s GES has been designed for ER-negative tumour subtyp-ing. Steroid hormone receptor, cell cycle (CC+) and cell cycle and immune response (CC+/IR+) subtypes were ex-clusively observed in C1, C2 and C2 + C3, respectively (Figure 3). Of note, most frequently immune response was mixed with cell cycle (CC+/IR+) (n = 74). Only two “pure” IR+ subtypes were found (one in C1 and one in C3). This GES confirmed TNBCtype subtyping of C1 as steroid hormone receptor and LAR. Immune response was almost exclusively assigned to C2 and C3 but did not separate these two clusters.
Vascular endothelial growth factor profile This 13-GES showed that angiogenesis varied according to the three clusters (P < 0.0001). Angiogenesis increased from C1 to C3 (P = 0.0274), and then from C3 to C2 (P = 0.0114).
Glycolysis profile Glycolysis score was significantly dif-ferent according to cluster (P = 0.0073). The score of C1 was inferior to that of C2 (P = 0.0073) but no different from that of C3 (P = 0.44). A slight trend was found be-tween C2 and C3 (P = 0.12).
Signature correlation analyses VEGF/glycolysis, prolif-eration/VEGF and proliferation/glycolysis profiles were positively correlated for patients included in our TN co-hort (r = 0.62, P < 0.0001; r = 0.41, P < 0.0001; r = 0.48, P < 0.0001, respectively). Furthermore, correlation between VEGF and glycolysis profiles was found in each cluster (C1: r = 0.63, P = 0.0009; C2: r = 0.57, P < 0.0001; C3: r = 0.52, P = 0.0015). It is important to note that the gene lists for VEGF score, glycolysis score and proliferation score have no gene in common and, thus, correlations can be at-tributed to tumour biology.
Claudin-low Ten patients were subtyped as “claudin-low” (9.3%). The distribution was: 0% in C1, 2% (1/48) in C2 and 26% (9/35) in C3. Thus, C3 was claudin-low enriched but this subtype only represented a quarter of its number. Claudin-low compared to PAM50 basal-like tumours (n = 70) showed significant lower proliferation (P = 0.0076, Wilcoxon’s test). This result is in concord-ance with current knowledge. Prat and colleagues con-cluded that these tumours were likely slower-cycling tumours [6].
Rody’s gene expression signature In order to dissect immune response, we applied Rody’s immune metagenes
to patients belonging to C2 and C3. In doing so, seven immune modules representing immune cells or immune processes were distinguished: B lymphocytes (IgG); mac-rophages and monocyte/myeloid lineage cells (HCK); professional antigen-presenting cells (MHC-II); T cells (LCK); cell types for presentation of intracellular anti-gens (MHC-I); interferon signal transduction (STAT1); and interferon response (interferon)) [15]. For each im-mune module, metagene expressions were always signifi-cantly higher in C3 compared to C2 (Additional file 7). Based on a variety of immune cells and immune pro-cesses, these results demonstrated that high immune re-sponse (HIR) could be considered as a hallmark of C3. Considering C2 and C3 patients, the impact of Rody’s metagenes on EFS and OS analyses was assessed. High expression of the majority of these metagenes was sig-nificantly associated with a better outcome: MHC-II (EFS: P = 0.0045, hazard ratio (HR) = 0.61; OS: P = 0.0117, HR = 0.57), interferon (EFS: P = 0.007, HR = 0.66; OS: P = 0.0138, HR = 0.63), STAT1 (EFS: P = 0.004, HR = 0.68; OS: P = 0.0069, HR = 0.64), LCK (EFS: 0.0065, HR = 0.66; OS: P = 0.0086, HR = 0.60) and HCK (EFS: P = 0.0276, HR = 0.62; OS: P = 0.06). A trend was found for MHC-I (EFS: P = 0.08; OS: P = 0.14). IgG module was not associated with disease evolution (EFS: P = 0.69; OS: P = 0.43).
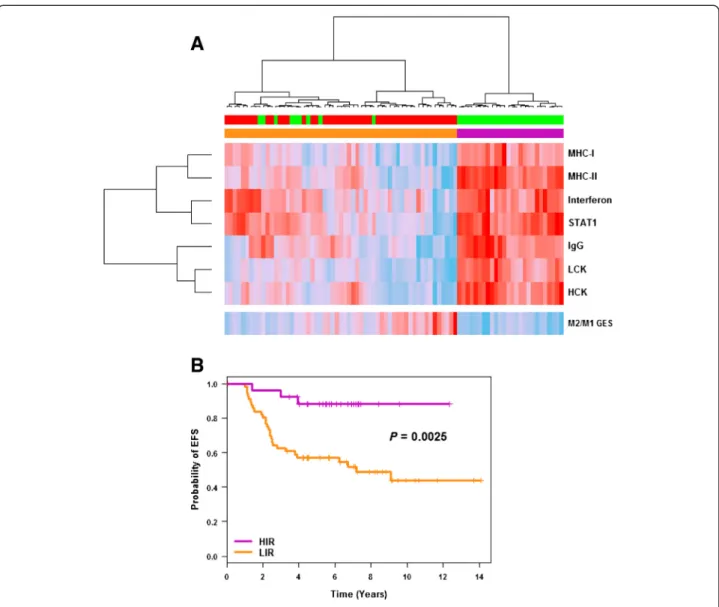
Ward’s hierarchical clustering applied to these im-mune modules separated C2 and C3 patients into two clusters: one exclusively composed of C3 patients with HIR (n = 26) and the other composed of a majority (84%) of C2 patients with low immune response (LIR) (Figure 4A). All TNBCtype immunomodulatory (n = 19) were included in the HIR group. EFS analysis showed that HIR patients had a significantly better outcome than LIR patients (P = 0.0025; Figure 4B). Hence, im-mune response subtyping separated TN basal-like pa-tients into two groups with different outcomes. A pooled cohort composed of C2, C3 and their equivalent in the external cohort, C2’ and C3’, (n = 141) confirmed this finding (P = 0.0212; n = 70 and 71, respectively for LIR and HIR) (Additional file 8). In our study, Rody’s metagenes were more powerful than Teschendordff’s GES to separate C2 and C3 as a function of immune response.
M2/M1 GES Of the 649 genes found differentially ex-pressed by the SAM method, 611 were measured in Affymetrix® Human Genome U133 Plus 2.0 Arrays and used for macrophage subtyping (Additional file 9). Seventy-nine genes were in common between M2/M1 GES and the C2 versus C3 genes list, which included most differentially expressed genes between C2 and C3. Considering only C2 and C3 clusters, M2/M1 GES was significantly associated with a bad outcome (P = 0.02 and 0.04, respectively, for EFS and OS). M2
pro-tumourigenic macrophage genes were more expressed in C2 (P < 0.0001), which was characterized by LIR and bad outcome, and M1 tumour suppressor macrophage genes were more expressed in C3, which was characterized by HIR and better outcome. Of note, we did not find any correlation between VEGF score and M2 macrophage signature (r = 0.08; P = 0.45).
Single gene-expression intuitive approach
C1 was characterized by overexpression of luminal markers (AR, ESR1, GATA3, KRT18, KRT19 and MUC1) and low expression of basal-like markers (CDH3, KIT, KRT5, KRT6B, KRT14, KRT17) compared to C2 and C3,
leading us to name it LAR (Additional file 10). ESR1 dis-tribution according to the three clusters showed a significantly higher expression in C1 compared to C2 (P = 0.0022) and a trend with C3 (P = 0.07). ERBB2 was only found overexpressed between C1 and C3. Higher expression of “epithelial cell-cell adhesion” (CDH1 and EPCAM) and proliferation markers (MKI67, UBE2C, RACGAP1) was observed between C2 and C3. Low ex-pression of EMT (CDH2, TGFB1), “immune system re-sponse” (CD4, CD79A, CXCL2, IL6, VAV1), breast stem cells (ABCA8, ALDH1A1) and angiogenesis markers (TEK, TIE1, VEGFC) in C2 differentiated this cluster from C3. In regard of these results, we may conclude
Figure 4 C2/C3 immune response dissection. (A) Ward’s hierarchical clustering and heatmap showing the segregation of C2 (red) and C3 (green) patients as a function of the seven Rody’s metagenes (B lymphocytes (IgG); macrophages and monocyte/myeloid lineage cells (HCK); professional antigen-presenting cells (MHC-II); T-cell (LCK); cell types for presentation of intracellular antigens (MHC-I); interferon signal transduction (STAT1); interferon response (interferon)) and M2/M1 gene-expression signature (GES) (continuous colour scale, from minimum (8.05, 6.90, 5.06, 7.84, 7.43, 9.68, 11.19 and−1.36 for HCK, LCK, IgG, STAT1, Interferon, MHC-II, MHC-I and M2/M1 GES, respectively; deep sky blue) to maximum (11.46, 12.24, 12.93, 13.21, 12.55, 13.75, 14.69 and−0.68 for HCK, LCK, IgG, STAT1, Interferon, MHC-II, MHC-I and M2/M1 GES, respectively; red). (B) Kaplan-Meier curves for event-free survival (EFS) analysis of breast cancer patients with high immune response (HIR) and low immune response (LIR).
that C2 is a true “basal-like” cluster. As detailed above, biological behaviour of C3 was different from C2. Most of the underlined differences, except the three claudin genes (CDLN3, CDLN 4 and CDLN7), characterized a “claudin-low” cluster that expressed low luminal differ-entiation markers, high EMT markers, immune response genes, cancer stem like features and a stem cell-associated biological process. In regard to a preponder-ance of immune response genes in C3, we thought that “immune-related” was more suited to this last cluster.
Gene ontology biological process terms enrichment
One overexpressed gene probe cluster was identified for each cluster of patients by means of the 5% most variant gene probes (n = 2,734) heatmap. Those clusters were named H1 for C1, H2 for C2 and H3 for C3. H1, H2 and H3 were composed of 481, 442 and 222 gene probes, respectively (Additional file 11). Lists of discrim-inating gene probes (C1 versus C2, C1 versus C3, C2 versus C3 and C1 versus C2 and C3) were composed of 682, 575, 565 and 565 gene probes, respectively. Twenty-one GO biological process terms enrichment analyses demonstrated that C1 was characterized by epithelial cell differentiation and a hormone metabolic process, C2 by cell adhesion, locomotion and chemotaxis, and C3 by im-mune response (Additional file 12).
External validation
Eighty-seven TN patients from GSE21653 were used for external validation. The same global process, as de-scribed for our cohort, was used. Results are summa-rized in Figure 5 and detailed in Additional file 13. In accordance with the clustering results of our cohort, GSE21653 TN patients were divided up into one non-basal-like cluster (C1’) and two non-basal-like clusters (one named true basal-like or basal-like (C2’) and the other, which included claudin-low subtypes (28%), character-ized by immune response (C3’)). One difference was that the GSE21653 cohort included PAM50 HER2-E subtypes in C1’. Moreover, only five patients (5.74%) were differ-ently classified with PAM.
Discussion
Our work has once again raised the question of finding a gold standard method for breast cancer molecular sub-typing; personalized medicine cannot do without effective identification of patients. We conducted an unsupervised analysis of microarray gene-expression profiles of a TN cohort composed of 107 patients. The robustness of our results was based on concordance of numerous and com-plementary functional annotation means: bio-clinical data (age, histological grade, NPI score), immunohistochemis-try markers (CK5, HER1, Ki67, AR and FOXA1), 17 GES, intuitive single gene-expression approach and GO
enrichment. Furthermore, our analysis was reinforced by external validation which confirmed our results. Func-tional annotation of clusters obtained by means of fuzzy clustering showed that 22% of these patients were not basal-like (C1 = LAR), which is in concordance with other works [30]. Of note, in GSE21653, 20 to 30% of SSP classi-fied C1’ patients were subtyped as HER2-E; ERBB2 ex-pression was in concordance with this result (Additional file 13). As a consequence of this, the TN C1 cluster should be named “non-basal-like”, because it might be composed of non-basal-like patients with LAR and/or HER2-E characteristics. The two other clusters were enriched in basal-like subtype: C2, which could be consid-ered as an almost pure basal-like cluster, included patients with bad outcome, and C3, enriched in basal-like subtypes but to a lesser extent, included patients with better out-come. C3 was composed of 26% claudin-low subtypes. Of note, claudin-low patients were subtyped by means of GES. Our cohort was probably too small to individualize a well-separated claudin-low subtype; Prat and colleagues initially characterized claudin-low subtype in a cohort of 337 patients [6]. Dissection of immune response, which was high in these two last clusters compared to C1, was first performed by means of seven metagenes. Results showed that HIR was a hallmark of C3, and that HIR was associated with a better outcome than LIR (C2). This was true for our cohort (P = 0.0195) alone and pooled with GSE21653 TN patients (P = 0.002) (Figure 2, Additional file 4). We proposed that C3 should be called “HIR”, be-cause HIR had the clinical advantage of individualizing a cluster of patients with good outcome. C2 seemed to cor-respond to “basal-like immune-suppressed”, and C3 to “basal-like immune-activated”, recently described by Burstein and colleagues [31].
In addition to other studies, our work demonstrated that CK5 should be used rather than CK5/6 to identify basal-like subtype. Indeed, in our cohort, sensitivity (based on C2 and C3 results) was 83% for CK5 and only 34% for CK5/6; both markers had similar specificity (based on C1 results): 77% for CK5 and 82% for CK5/6. In C1, 5 cases out of 22 were positive for CK5 (23%), 4/ 22 were positive for CK5/6 (18%) and 11/22 were posi-tive for HER1 (50%). In 2004, Abd El-Rehim and col-leagues showed that 27.4% of breast tumours displayed a combined luminal and basal phenotype (positivity for one or more of the luminal markers together with one or more of the basal markers) [32]. This could explain why CK5- or CK5/6-positive tumours were found in C1.
We focused on immune response, which is known to play a major role in tumour progression, because it was the main characteristic allowing us to distinguish between the two basal-like-enriched clusters: C2 (LIR) and C3 (HIR). Furthermore, actors or mechanisms of immune networks constitute potential drug targets suggesting that
some TN patients might benefit from immune-based ther-apies. In cancer, some immune cells are known to induce anti-tumoural effects (natural killer cells, CD8+ T cells, Th1 cells, dendritic cells 1, M1 macrophages, and so forth), and others induce pro-tumoural effects (myeloid-derived suppressor cells, CD4+ T cells, Th2 cells, dendritic cells 2, M2 macrophages, and so forth) [33,34]. These ef-fects result from complex cross talk between immune cells, tumour cells and other cell populations of the micro-environment by means of extracellular signals, including many cytokines and their soluble receptors [35,36]. In breast cancer, recent works confirmed that tumour infil-trating lymphocytes (TILs) were most frequently found in highly proliferative tumours, including TN, and were
associated with a favourable outcome [37,38]. Today, TILs are becoming a new breast cancer marker, particularly in TN and HER2-positive breast cancer [33]. As recom-mended by an international working group of experts in 2014, TIL score must take into account all mononuclear cells including lymphocytes and plasma cells, and excludes granulocytes, other polymorphonuclear leukocytes, den-dritic cells and macrophages [33]. Nevertheless, macro-phages are key modulator and effector cells in immune response and tumour progression [35]. An old, but still used, classification of macrophages roughly separates them into two “extreme” polarized subpopulations: the classic-ally activated type 1 macrophages (M1) and the alternative activated type 2 macrophages (M2). In 2010, Qian and
Figure 5 Functional annotations of the clustering results for triple-negative patients from GSE21653 (n = 87). (A) Fuzzy-clustering probability of belonging to clusters, from 0 to 1. (B) Cluster numbering scheme. (C) Clinicopathologic characteristics with significant differences between clusters: age as a continuous colour scale, from 28 years old (pale turquoise) to 85 years old (dark blue); Elston-Ellis (EE) histological grades 1 (pale turquoise), 2 (deep sky blue), and 3 (dark blue); Nottingham prognostic index (NPI) 1 (pale turquoise), 2 (deep sky blue), and 3 (dark blue). (D) Immunohistochemistry results for Ki67: positive (brown) and negative (blue). (E) Molecular subtyping by means of nine gene expression signatures (GES): three single sample predictors (SSPs) - luminal A (dark blue), luminal B (sky blue), HER2-E (purple), basal-like (red), normal breast-like (green) or unclassified (yellow); proliferation (continuous colour scale from minimum (6.01; deep sky blue) to maximum (10.92; red)); TNBCtype (basal-like 1 (red), basal-like 2 (dark red), immunomodulatory (dark green), mesenchymal-like (pink), mesenchymal stem-like (magenta), luminal androgen receptor (blue) and unclassified tumours (yellow)); Teschendorff’s GES (cell cycle (blue), cell cycle and immune response (orange), extracellular matrix (green), immune response (red), steroid hormone response (pink) and unclassified (yellow)); claudin-low (claudin-low (yellow), other (dark blue)); vascular endothelial growth factor (VEGF; continuous colour scale, from minimum (8.12; deep sky blue) to maximum (10.82; red)); and glycolysis (continuous colour scale, from minimum (9.42; deep sky blue) to maximum (13.00; red)). (F) Gene ontology biological process terms enrichment. Missing values are in white.
Pollard described six macrophage functions (activated, im-munosuppressive, angiogenic, metastasis-associated, peri-vascular and invasive) ascribed to a unique macrophage subpopulation [39]. Recently, a working group of macro-phage biologists defined a nomenclature and experimental guidelines to take into account the heterogeneity of macrophage activation and polarization [40]. They recom-mended a nomenclature linked to the activation standards and counted seven human macrophage subpopulations, three M1 types and four M2 types [40]. Beside the ex-treme phenotypes, intermediate phenotypes of macro-phages should also be evaluated when dissecting immune response in cancer [41,42]. Within this cell group, tumour-associated macrophages (TAMs), which are con-sidered as M2-like, represent a major source of proteases involved in tumour progression [43]. Very synthetically, polarized macrophages, together with fibroblasts and vas-cular endothelial cells from the tumour microenviron-ment, in conjunction with tumour cells, intervene at different stages of the cancer process. They have been im-plicated in the angiogenic switch (high production of VEGF), local invasion, and metastasis. Thus it is important to take into account these cells when dissecting immune response, and to identify their subpopulations because they have negative and positive effects on cancer evolution.
In this work, HIR, objectivised by means of Rody’s and TNBCtype GES, was exclusively related to “anti-tumoural” response; none of these GES were related to “pro-tumourigenic” response. Furthermore, Teschnedorff’s GES was unable to dissect immune response; immune re-sponse was high in C2 and C3 (Figure 3E). Almost all Rody’s immune modules showed that high expression was linked to good outcome (Figure 4). Expression of LCK and IgG Rody’s metagenes, as markers for T and B cells, were in concordance with current knowledge. On the con-trary, high expression of HCK, which take into account macrophages and monocyte/myeloid lineage cells, was as-sociated with favourable outcome. This result was a bit surprising because, in breast cancer, TAMs are known to be associated with bad prognosis [34]. Our hypothesis was that HCK was unable to distinguish between the two ex-treme macrophage phenotypes. For this reason, we estab-lished a M2/M1 GES to subtype TAMs into M1-like or M2-like groups. According to new nomenclature, M2/M1 GES, which should be named M(IL-4)/M(IFN-γ) GES, showed that M(IL-4) (M2 pro-tumourigenic macro-phages) were more frequent in LIR (C2), which was char-acterized by a bad outcome, and that M(IFN-γ) (M1 tumour suppressor macrophages) were more frequent in HIR (C3), which was characterized by a favourable out-come. In other words, C2 was characterized by high pro-tumourigenic and low anti-tumoural immune response and C3 by low pro-tumourigenic and high anti-tumoural
immune response. Finally, these results are in concord-ance with current knowledge, and are of particular im-portance because M2 inhibition, which may play a major pro-tumourigenic role in C2, represents a potential thera-peutic strategy. Repolarization of M2 into M1 macro-phages and inhibition of M2 macromacro-phages both represent promising ways to treat cancer [44,45]. Cancer treatment may take advantage of therapies that interfere with M2 macrophages. Although the following model was not based on breast cancer, but on nude mice xenografted with colon cancer cells, GTP cyclohydrolase (CGH1) inhibition by 2,4-diamino-6-hydroxypyrimidine reduced tumour growth and angiogenesis by shifting the pheno-type of tumour-associated macrophages from pro-angiogenic M2 towards M1 [46].
However, some caution must be taken with our results. First, our main hypothesis was that immune cells and particularly macrophage subpopulations represented main key effectors of TN breast cancer. Today, numer-ous concordant studies support this hypothesis [47-51]. Second, we showed that the M2 macrophage gene-expression profile was associated with bad outcome, and the reverse for M1. At this step, we did not demonstrate a causal link between M2 macrophage cells and out-come. Further analyses are required to dissect M2-dependent causal chains or systems that might explain breast cancer progression and evolution. Phenotypic markers should also be tested to validate macrophage distribution. Third, new TN patients are needed to test the strength of this partition.
Conclusions
We identified three subtypes of TN patients: 1) non-basal-like (22%); 2) non-basal-like with LIR and high M2-like macrophages (45%); and 3) basal-enriched, including claudin-low subtypes, with HIR and low M2-like macro-phages (33%). Our study added another well-defined TN cohort to the scientific community. We showed that our gene-expression data could be pooled with others to strengthen unsupervised analyses and to feed databases [52]. As others have done, we concluded that around 25% of TN patients, including non-basal-like cluster (LAR in our study), could receive hormonotherapy or anti-HER2 therapy. Furthermore, based on concordance between robust molecular results and IHC, we showed that the CK5 antibody was better suited than the CK5/6 antibody to subtype basal-like patients. This result is of importance within the framework of the search for a TN subtyping gold standard method. In this work, we pointed out that macrophages, particularly M2-like, of-fered a variety of therapeutic targets in TN patients. In breast cancer, and particularly in cases of TN basal-like tumours, future clinical trials evaluating novel immune therapies will have to be set up with patients stratified
by means of the composition of their leukocyte infil-trate, which should include macrophage subpopulation identification [53]. A lot of work needs to be done in order to define this new multiparametric biomarker panel. To this end, cytology together with expression microarray data deconvolution seem more likely to suc-ceed [54,55]. To conclude, we hypothesize that TN basal-like treatment, among other things, will have to restore the normal balance of immune cells, by means of targeted immune cell inhibition and/or augmentation, and that immune therapy will become an important component of TN basal-like combined therapies.
Additional files
Additional file 1: Details of antibodies used for immunohistochemistry. Additional file 2: Interpretation of immunohistochemical staining. Additional file 3: Gene-expression signatures (GES) used for fuzzy cluster functional annotation.
Additional file 4: Kaplan-Meier curves for event-free survival analysis based on fuzzy-clustering partition. (A) GSE21653 triple negative (TN) breast cancer patients (n = 87). (B) Kaplan-Meier analysis of pooled cohorts (ours and GSE21653;n = 194) shows significantly increased event-free survival in C3 patients compared to C1 (P = 0.03) and C2 patients (P = 0.002). Additional file 5: Distribution of single sample predictor (SSP) subtypes according to the three clusters of our cohort. (A) Sorlie’s SSP. (B) Hu’s SSP. (C) Parker’s SSP (PAM50). Bar graph plots shows the distribution of intrinsic subtypes: luminal A (dark blue) and B (light blue), HER2-E (purple), basal-like (red), normal breast-like (green) or unclassified (yellow) tumours within each cluster. Whatever the SSP, subtype distributions show that C1 is a luminal-enriched cluster and not a basal-like cluster, C2 is an almost pure basal-like cluster, and C3 is a basal-like-enriched cluster. Additional file 6: Distribution of TNBCtype subtypes according to the three clusters of our cohort. Bar graph plots show the distribution of the six TNBCtype subtypes: basal-like 1 (red), basal-like 2 (dark red), immunomodulatory (dark green), mesenchymal-like (pink), mesenchymal stem-like (magenta), luminal androgen receptor (blue) and unclassified tumours (yellow), within each cluster.
Additional file 7: Rody’s metagene expression levels according to our cohort’s clusters. For each immune module, P value of Tukey's test for the comparison between C2 and C3 is indicated. Metagene expressions are always significantly higher in C3 compared to C2. Additional file 8: Kaplan-Meier curves for event-free survival analysis based on Rody’s metagenes clustering. Rody’s metagenes clustering was based on patients included in C2 and C3 (our cohort; see Figure 4A), and in C2’ and C3’ (GSE21653) (low immune response (LIR), n = 70; high immune response (HIR),n = 71).
Additional file 9: M2/M1 gene expression signature (GES) genes list. List of the 611 genes used to compute the M2/M1 GES and their relative expression in M2 versus M1 population.
Additional file 10: Expression level of chosen genes between the three fuzzy clusters of our cohort.
Additional file 11: Fuzzy clustering heatmap of the 5% most variant gene probes. Each column represents a patient (n = 107) and each row an Affymetrix gene probe (n = 2,734). Green indicates low expression, red indicates high expression. Clusters of overexpressed genes used for gene ontology (GO) biological process terms enrichment are indicated by a bracket: H1 for C1 (blue), H2 for C2 (red) and H3 for C3 (green). H1, H2 and H3 were composed of 481, 442 and 222 gene probes, respectively.
Additional file 12: Biological process gene ontology (GO) terms enrichment for our cohort.
Additional file 13: External validation process results. Eighty-seven triple negative (TN) patients of GSE21653 cohort were used for external validation. The same global process, as described for our cohort, was used and is described thereafter.
Abbreviations
AR:androgen receptor; EFS: event-free survival; EMT: epithelial-to-mesenchymal transition; ER: oestrogen receptor; GEO: Gene Expression Omnibus;
GEP: gene-expression profiling; GES: gene-expression signatures; GO: gene ontology; IHC: immunohistochemistry; HER2-E: HER2-enriched; HES: hemalun-eosin-safran; HIR: high immune response; HR: hazard ratio; LAR: luminal androgen receptor; LIR: low immune response; NPI: Nottingham prognostic index; OS: overall survival; PAM: prediction analysis for microarrays;
PR: progesterone receptor; SAM: significance analysis of microarrays; SBR: Scarff Bloom Richardson; SSP: single sample predictor; TAM: tumour-associated macrophage; TIL: tumour infiltrating lymphocyte; TN: triple-negative; TNBCtype: a subtyping tool for triple-negative breast cancer; VEGF: vascular endothelial growth factor.
Competing interests
The authors declare that they have no competing interests. Authors’ contributions
PJ and MC conceived and designed the study. CGC, LC, AV and HL carried out statistical analyses. WG performed bioinformatics. DL, IV and VV carried out immunohistochemistry. PJ, LC, WG and CG provided patients and obtained bio-clinical data. All authors have been involved in drafting the manuscript. All authors read and approved the final manuscript. Acknowledgements
We wish to thank Pr Charles Perou and Dr Aleix Prat for their valuable help. Tissues used in this work were provided by: Institut Régional du Cancer Nantes-Atlantique tumour bank, funded by the Institut National du Cancer (INCa) and the Cancéropôle Grand Ouest, and Anjou Maine ICO Paul Papin tumour bank funded by the INCa. We thank the transcriptomic team (Elise Douillard, Magali Devic, Emilie Moranton and Nathalie Roi), the
immunohistochemistry team (Nadège Friquet), the IRCNA tumour bank team (Estelle Biraud and Vanessa Veron,) and the Anjou Maine ICO Paul Papin tumour bank team (Dr Agnès Chassevent) for technical assistance.
Author details
1Unité Mixte de Génomique du Cancer, Institut de Cancérologie de l’Ouest
-site René Gauducheau, Bd J. Monod, 44805 Saint Herblain Cedex, France.
2Unité de Bioinfomique, Institut de Cancérologie de l’Ouest - site René
Gauducheau, Bd J. Monod, 44805 Saint Herblain Cedex, France.
3Département de Biopathologie, Institut de Cancérologie de l’Ouest - site
René Gauducheau, Bd J. Monod, 44805 Saint Herblain Cedex, France.
4INSERM U892, IRT-UN, 8 quai Moncousu, 44007 Nantes Cedex, France. 5
Service d’Anatomie Pathologique B, Hôpital G&R Laënnec, Bd J. Monod, 44805 Saint Herblain, France.6Unité de Biostatistique, Institut de
Cancérologie de l’Ouest - site René Gauducheau, Bd J. Monod, 44805 Saint Herblain Cedex, France.7Sorbonne Universités, UPMC University,
Département de Biostatistique, 4 place Jussieu, 75005 Paris, France.8AP-HP, University Hospitals Pitié-Salpêtrière Charles-Foix, Département de
Biostatistique, Santé Publique et Informatique Médicale, 47-83 Bd de l’Hôpital, 75013 Paris, France.9Institut de Cancérologie de l’Ouest - site Paul Papin, 2
rue Moll, 49933 Angers Cedex 9, France.10Laboratoire d’Anatomie
Pathologique, Institut de Cancérologie de l’Ouest - site Paul Papin, 2 rue Moll, 49933 Angers Cedex 9, France.11Service d’Oncologie Médicale, Institut de Cancérologie de l’Ouest - site René Gauducheau, Bd J. Monod, 44805 Saint Herblain Cedex, France.
Received: 4 November 2014 Accepted: 10 March 2015
References
1. Foulkes WD, Smith IE, Reis-Filho JS. Triple-negative breast cancer. N Engl J Med. 2010;363:1938–48.
2. Perou CM, Sorlie T, Eisen MB, van de Rijn M, Jeffrey SS, Rees CA, et al. Molecular portraits of human breast tumours. Nature. 2000;406:747–52.
3. Sorlie T, Perou CM, Tibshirani R, Aas T, Geisler S, Johnsen H, et al. Gene expression patterns of breast carcinomas distinguish tumor subclasses with clinical implications. Proc Natl Acad Sci U S A. 2001;98:10869–74. 4. Prat A, Perou CM. Deconstructing the molecular portraits of breast cancer.
Mol Oncol. 2011;5:5–23.
5. Herschkowitz JI, Simin K, Weigman VJ, Mikaelian I, Usary J, Hu Z, et al. Identification of conserved gene expression features between murine mammary carcinoma models and human breast tumors. Genome Biol. 2007;8:R76.
6. Prat A, Parker JS, Karginova O, Fan C, Livasy C, Herschkowitz JI, et al. Phenotypic and molecular characterization of the claudin-low intrinsic subtype of breast cancer. Breast Cancer Res. 2010;12:R68.
7. Hu Z, Fan C, Oh DS, Marron JS, He X, Qaqish BF, et al. The molecular portraits of breast tumors are conserved across microarray platform. BMC Genomics. 2006;7:96.
8. Chen X, Li J, Gray WH, Lehmann BD, Bauer JA, Shyr Y, et al. TNBCtype: a subtyping tool for triple-negative breast cancer. Cancer Inform. 2012;11:147–56. 9. Sabatier R, Finetti P, Cervera N, Lambaudie E, Esterni B, Mamessier E, et al. A
gene expression signature identifies two prognostic subgroups of basal breast cancer. Breast Cancer Res Treat. 2011;126:407–20.
10. Sabatier R, Finetti P, Adelaide J, Guille A, Borg JP, Chaffanet M, et al. Down-regulation of ECRG4, a candidate tumor suppressor gene, in human breast cancer. PLoS One. 2011;6:e27656.
11. Sorlie T, Tibshirani R, Parker J, Hasties T, Marron JS, Nobel A, et al. Repeated observation of breast tumor subtypes in independent gene expression data sets. Proc Natl Acad Sci U S A. 2003;100:8418–23.
12. Teschendorff AE, Miremadi A, Pinder SE, Ellis IO, Caldas C. An immune response module identifies a good prognosis subtype in estrogen negative breast cancer. Genome Biol. 2007;8:R157.
13. Hu Z, Fan C, Livasy C, He X, Oh DS, Ewend MG, et al. A compact VEGF signature associated with distant metastases and poor outcomes. BMC Med. 2009;7:9.
14. Parker JS, Mullins M, Cheang MC, Leung S, Voduc D, Vickery T, et al. Supervised risk predictor of breast cancer based on intrinsic subtypes. J Clin Oncol. 2009;27:1160–7.
15. Rody A, Holtrich U, Pusztai L, Liedtke C, Gaetje R, Ruckhaeberle E, et al. T-cell metagene predicts a favorable prognosis in estrogen receptor-negative and HER2-positive breast cancers. Breast Cancer Res. 2009;11:R15.
16. Dexter TJ, Sims D, Mitsopoulos C, Mackay A, Grigoriadis A, Ahmad AS, et al. Genomic distance entrained clustering and regression modelling highlights interacting genomic regions contributing to proliferation in breast cancer. BMC Syst Biol. 2010;4:127.
17. Beyer M, Mallmann MR, Xue J, Staratschek-Jox A, Vorholt D, Krebs W, et al. High-resolution transcriptome of human macrophages. PLoS One. 2012;7:e45466. 18. Lehmann BD, Bauer JA, Chen X, Sanders ME, Chakravarthy AB, Shyr Y, et al.
Identification of human triple-negative breast cancer subtypes and preclinical models for selection of targeted therapies. J Clin Invest. 2011;121:2750–60. 19. Huang DW, Sherman BT, Lempicki RA. Systematic and integrative analysis of
large gene lists using DAVID bioinformatics resources. Nat Protoc. 2009;4:44–57.
20. Huang DW, Sherman BT, Lempicki RA. Bioinformatics enrichment tools: paths toward the comprehensive functional analysis of large gene lists. Nucleic Acids Res. 2009;37:1–13.
21. Eden E, Navon R, Steinfeld I, Lipson D, Yakhini Z. Gorilla: a tool for discovery and visualization of enriched GO terms in ranked gene lists. BMC Bioinformatics. 2009;10:48.
22. Chen J, Bardes EE, Aronow BJ, Jegga AG. ToppGene Suite for gene list enrichment analysis and candidate gene prioritization. Nucleic Acids Res. 2009;37:W305–11.
23. R Core Team. R: a language and environment for statistical computing. R Foundation for Statistical Computing, Vienna, Austria; 2014. http://www.R-project.org/.
24. Nielsen TO, Hsu FD, Jensen K, Cheang M, Karaca G, Hu Z, et al.
Immunohistochemical and clinical characterization of the basal-like subtype of invasive breast carcinoma. Clin Cancer Res. 2004;10:5367–74.
25. Bhargava R, Beriwal S, McManus K, Dabbs DJ. CK5 is more sensitive than CK5/6 in identifying the“basal-like” phenotype of breast carcinoma. Am J Clin Pathol. 2008;130:724–30.
26. Alshareeda AT, Soria D, Garibaldi JM, Rakha E, Nolan C, Ellis IO, et al. Characteristics of basal cytokeratin expression in breast cancer. Breast Cancer Res Treat. 2013;139:23–37.
27. Weigelt B, Mackay A, A’hern R, Natrajan R, Tan DS, Dowsett M, et al. Breast cancer molecular profiling with single sample predictors: a retrospective analysis. Lancet Oncol. 2010;11:339–49.
28. Ghabach B, Anderson WF, Curtis RE, Huycke MH, Lavigne JA, Dores GM. Adenoid cystic carcinoma of the breast in the United States (1977 to 2006): a population-based cohort study. Breast Cancer Res. 2010;12:R54. 29. Masuda H, Baggerly KA, Wang Y, Zhang Y, Gonzalez-Angulo AM, Meric-Bernstam
F, et al. Differential response to neoadjuvant chemotherapy among 7 triple-negative breast cancer molecular subtypes. Clin Cancer Res. 2013;19:5533–40. 30. Prat A, Adamo B, Cheang MC, Anders CK, Carey LA, Perou CM. Molecular
characterization of basal-like and non-basal-like triple-negative breast cancer. Oncologist. 2013;18:123–33.
31. Burstein MD, Tsimelzon A, Poage GM, Covington KR, Contreras A, Fuqua S, et al. Comprehensive genomic analysis identifies novel subtypes and targets of triple-negative breast cancer. Clin Cancer Res. 2015 21:OF1-OF11. 32. Abd El-Rehim DM, Pinder SE, Paish CE, Bell J, Blamey RW, Robertson JF, et al.
Expression of luminal and basal cytokeratins in human breast carcinoma. J Pathol. 2004;203:661–71.
33. Salgado R, Denkert C, Demaria S, Sirtaine N, Klauschen F, Pruneri G, et al. Harmonization of the evaluation of tumor infiltrating (TILs) in breast cancer: recommendations by an international TILs-working group 2014. Ann Oncol. 2014;26:259–71.
34. Finak G, Bertos N, Pepin F, Sadekova S, Souleimanova M, Zhao H, et al. Stromal gene expression predicts clinical outcome in breast cancer. Nat Med. 2008;14:518–27.
35. Quail DF, Joyce JA. Microenvironmental regulation of tumor progression and metastasis. Nat Med. 2013;19:1423–37.
36. Obeid E, Nanda R, Fu YX, Olopade OI. The role of tumor-associated macrophages in breast cancer progression (review). Int J Oncol. 2013;43:5–12.
37. Loi S, Michiels S, Salgado R, Sirtaine N, Jose V, Fumagalli D, et al. Tumor infiltrating lymphocytes are prognostic in triple negative breast cancer and predictive for trastuzumab benefit in early breast cancer: results from the FinHER trial. Ann Oncol. 2014;8:1544–50.
38. Adams S, Gray RJ, Demaria S, Goldstein L, Perez EA, Shulman LN, et al. Prognostic value of tumor-infiltrating lymphocytes in triple-negative breast cancers from two phase III randomized adjuvant breast cancer trials: ECOG 2197 and ECOG 1199. J Clin Oncol. 2014;55:0491.
39. Qian BZ, Pollard JW. Macrophage diversity enhances tumor progression and metastasis. Cell. 2010;141:39–51.
40. Murray PJ, Allen JE, Biswas SK, Fisher EA, Gilroy DW, Goerdt S, et al. Macrophage activation and polarization: nomenclature and experimental guidelines. Immunity. 2014;41:14–20.
41. Gordon S, Martinez F. Alternative activation of macrophages: mechanism and functions. Immunity. 2010;32:593–604.
42. Lawrence T, Natoli G. Transcriptional regulation of macrophage polarization: enabling diversity with identity. Nat Rev Immunol. 2011;11:750–61. 43. Gocheva V, Wang HW, Gadea BB, Shree T, Hunter KE, Garfall AL, et al. IL-4
induces cathepsin protease activity in tumor-associated macrophages to promote cancer growth and invasion. Genes Dev. 2010;24:241–55. 44. Heusinkveld M, van der Burg SH. Identification and manipulation of tumor
associated macrophages in human cancers. J Transl Med. 2011;9:216. 45. Luo Y, Zhou H, Krueger J, Kaplan C, Lee SH, Dolman C, et al. Targeting
tumor-associated macrophages as a novel strategy against breast cancer. J Clin Invest. 2006;116:2132–41.
46. Pickert G, Lim HY, Weigert A, Häussler A, Myrczek T, Waldner M, et al. Inhibition of GTP cyclohydrolase attenuates tumor growth by reducing angiogenesis of tumor associated macrophages. Int J Cancer. 2013;132:591–604. 47. Beck AH, Espinosa I, Edris B, Li R, Montgomery K, Zhu S, et al. The
macrophage colony-stimulating factor 1 response signature in breast carcinoma. Clin Cancer Res. 2009;15:778–87.
48. Campbell MJ, Tonlaar NY, Garwood ER, Huo D, Moore DH, Khramtsov AI, et al. Proliferating macrophages associated with high grade, hormone receptor negative breast cancer and poor clinical outcome. Breast Cancer Res Treat. 2011;128:703–11.
49. Medrek C, Ponten F, Jirström K, Leandersson K. The presence of tumor associated macrophages in tumor stroma as a prognostic marker for breast cancer patients. BMC Cancer. 2012;12:306.
50. Chaturvedi P, Gilkes DM, Takano N, Semenza GL. Hypoxia-inducible factor-dependent signaling between triple-negative breast cancer cells and mesenchymal stem cells promotes macrophages recruitment. Proc Natl Acad Sci U S A. 2014;11:E2120–9.
51. Karn T, Pusztai L, Holtrich U, Iwamoto T, Shiang CY, Schmidt M, et al. Homogeneous datasets of triple-negative breast cancers enable the identification of novel prognostic and predictive signatures. PLoS One. 2011;6:e28403.
52. Jézéquel P, Campone M, Gouraud W, Guérin-Charbonnel C, Leux C, Ricolleau G, et al. bc-GenExMiner: an easy-to-use online platform for gene prognostic analyses in breast cancer. Breast Cancer Res Treat.
2012;131:765–75.
53. André F, Dieci MV, Dubsky P, Sotiriou C, Curigliano G, Denkert C, et al. Molecular pathways: involvement of immune pathways in the therapeutic response and outcome in breast cancer. Clin Cancer Res. 2013;19:28–33. 54. Abbas AR, Wolslegel K, Seshasayee D, Modrusan Z, Clark HF. Deconvolution
of blood microarray data identifies cellular activation patterns in systemic lupus erythematosus. PLoS One. 2009;4:e6098.
55. Shannon CP, Balshaw R, Ng RT, Wilson-McManus JE, Keown P, McMaster R, et al. Two-stage, in silico deconvolution of the lymphocyte compartment of the peripheral whole blood transcriptome in the context of acute kidney allograft rejection. PLoS One. 2014;9:e95224.
Submit your next manuscript to BioMed Central and take full advantage of:
• Convenient online submission
• Thorough peer review
• No space constraints or color figure charges
• Immediate publication on acceptance
• Inclusion in PubMed, CAS, Scopus and Google Scholar
• Research which is freely available for redistribution
Submit your manuscript at www.biomedcentral.com/submit