Influence of Pretreatment Polarographically
Measured Oxygenation Levels in Spontaneous
Canine Tumors Treated with Radiation Therapy
Carla Rohrer Bley
1, Stefanie Ohlerth
1, Malgorzata Roos
2, Melanie Wergin
1, Roger Achermann
1,
Barbara Kaser-Hotz
1Background and Purpose: The level of hypoxia in primary tumors has been described to influence response to treatment. The
aim of the present study was to investigate the impact of pretreatment oxygen level measurements in spontaneous canine tumors on treatment outcome.
Material and Methods: Data of pretreatment tumor oxygenation status and local tumor response after primary radiation
thera-py in a group of spontaneously occurring tumors in dogs (n = 52) was collected. Radiation therathera-py was given with curative (14–17 × 3–3.5 Gy) or palliative intent (3 × 8 Gy or 4–5 × 6 Gy). Progression-free interval and overall survival were correlated to polarographically measured tumor oxygenation status.
Results: In the curatively irradiated group, tumors with median pO2 values ≤ 10 mmHg tended to have shorter median progres-sion-free interval compared to better oxygenated tumors (246 vs. 739 days). The same trend could be shown for overall survival (330 vs. 745 days), indicating a cutoff value in this region. In the group treated with lower doses of radiation, the level of oxygen was no longer found to be of prognostic value; however, in this group hemoglobin had a significant impact on outcome.
Conclusion: In curatively irradiated spontaneous canine tumors, tumor hypoxia was found to be a prognostic indicator,
indepen-dent of tumor histologies and volume.
Key Words: Hypoxia · Tumor oxygenation · Canine tumors · Radiation therapy · Polarographic needle electrode Strahlenther Onkol 2006;182:518–24
DOI 10.1007/s00066-006-1519-7
Einfluss des prätherapeutischen Oxygenierungsstatus bei bestrahlten spontan auftretenden Tumoren des Hundes Hintergrund und Ziel: Das Ausmaß der Hypoxie in Primärtumoren beeinflusst das Ansprechen auf eine Therapie. Das Ziel der
vorliegenden Studie war, den Zusammenhang zwischen dem prätherapeutischen Sauerstoffstatus und Ansprechen auf die Strah-lentherapie bei Hunden zu untersuchen.
Material und Methodik: Bei Hunden (n = 52) mit spontan auftretenden Tumoren, die entweder einer kurativen (14–17 × 3–3,5 Gy)
oder einer palliativen Strahlentherapie (3 × 8 Gy oder 4–5 × 6 Gy) unterzogen wurden, wurde der prätherapeutische Sauerstoffpar-tialdruck gemessen. Die progressionsfreie Zeit sowie die Gesamtüberlebenszeit nach Therapie wurden mit den polarographisch gemessenen Sauerstoffdaten korreliert (Tabelle 1; Abbildung 1).
Ergebnisse: In der kurativ bestrahlten Gruppe konnte gezeigt werden, dass Tumoren mit einem Median der pO2-Messwerte von
≤ 10 mmHg eine kürzere progressionsfreie Zeit (246 vs. 739 Tage) und Gesamtüberlebenszeit hatten als besser oxygenierte Tumo-ren (330 vs. 745 Tage; Abbildung 2). In der palliativ bestrahlten Tiergruppe konnte dieser Effekt nicht gezeigt werden, jedoch wurde ein Einfluss des Hämoglobins auf das Therapieergebnis offensichtlich (Tabellen 2 bis 4).
Schlussfolgerung: Bei kurativ bestrahlten spontan auftretenden Tumoren des Hundes ist die Hypoxie ein von Histologie und
Tumorvolumen unabhängiger prognostischer Faktor.
Schlüsselwörter: Hypoxie · Strahlentherapie · Polarographische Feinnadelsonden · Hund · Tumor
Received: October 4, 2005; accepted: April 13, 2006
1 Section of Diagnostic Imaging and Radiation Oncology, Vetsuisse Faculty, University of Zurich, Switzerland, 2 Biostatistics, ISPM, University of Zurich, Switzerland.
Introduction
Hypoxic conditions in tumors are known to modulate the sen-sitivity of cancer cells to various treatment modalities [18, 19, 29]. Radiation sensitivity, for example, decreases for cells in environments with pO2 values below mixed-venous blood (40 mmHg), and for values below 3–4 mmHg, the sensitivity is halved, compared to well-oxygenated tissues [38]. Tumor hypoxia, measured by invasive oxygen electrodes, has been found prognostic for tumor control and treatment outcome in a variety of human tumors [6, 12, 14, 19, 27, 28, 33, 40].
The presence, prevalence and distribution of hypoxic tu-mor cells in spontaneous canine tutu-mors have been detected by several techniques and related to tumor and patient character-istics [2, 11, 31]. The binding of nitroimidazoles, hypoxic cell-marking substances, has been studied and has proven the presence of hypoxia in canine tumors [11]. Imaging techniques that quantitate hypoxic cells, using a nitroimidazole compound labeled with a radioisotope [18F]-misonidazole (FMISO), have
been described [15, 32]. Bruehlmeier et al. used a similar tech-nique to describe tumor hypoxia and perfusion in spontane-ous canine tumors [7, 32]. Achermann et al. as well as Brur-berg et al. recently documented the presence and changes of hypoxia in spontaneous canine tumors during fractionated ra-diotherapy using invasive polarographic needle electrodes and OxyLite fluorescence probes, respectively [2, 8].
The influence of tumor oxygenation status on the re-sponse to radiation therapy has not been described for sponta-neous canine tumors. In this study we aimed at investigating the impact of pretreatment oxygenation level measurements in spontaneous canine tumors on therapy outcome, including response to radiation therapy, progression-free interval (PFI) and overall survival. We also tried to identify whether there is an oxygen partial pressure (pO2) to be found that appears to
be a cutoff level indicative of prognosis between hypoxic and less hypoxic tumors. Furthermore, the dependence of influ-encing factors such as dose of radiation, hematologic parame-ters and tumor parameparame-ters was tested.
Material and Methods Patients
Dogs with spontaneously originating malignant tumors treat-ed with fractionattreat-ed irradiation were includtreat-ed in the study. All dogs were client-owned pets that were presented for tumor therapy to the Section of Diagnostic Imaging and Radiation Oncology of the Vetsuisse Faculty, University of Zurich, Swit-zerland, from 2001 to 2004. Prior to treatment all dogs under-went diagnostic work-up as indicated for staging of the dis-ease. All patients presented with macroscopic tumors. Primary tumor site and size, histopathologic differentiation and stag-ing information were obtained.
Radiation Therapy
All dogs were treated with external-beam megavoltage radia-tion. Radiation was delivered with a 6-MV linear accelerator
(Dynaray LA20; ABB/VARIAN) using 6-MV photons or 9- to 16-MeV electrons, as appropriate. Individualized treat-ment plans were generated using a 3-D computer treattreat-ment planning system (Varian CadPlan® 6.0.8; Figure 1). Treatment
protocols were delivered either with palliative (3 × 8 Gy on days 0, 7, 21 or 4–5 × 6 Gy, applied biweekly) or curative intent (14–17 × 3–3.5 Gy, applied in four or five fractions per week), resulting in an overall treatment time of 3.5 weeks.
pO2 Measurements and Tumor Volumes
Polarographic tumor oxygen partial pressure measurements were performed as previously described in dogs by Acher-mann et al. [1, 2]. Tumor volume was calculated based on the formula: π/6 × height × width × depth, which approximately describes the volume of an ellipsoid [35]. The hypoxic sub-volume (HSV) was calculated by the formula: sub-volume (cm3)
× hypoxic fraction (% of pO2 values ≤ 5 mmHg) [34].
Patient Follow-up and Response to Treatment
Regular follow-up clinical reexaminations were performed in order to collect information about general performance and tu-mor status. Responses are defined in Table 1 and evaluated at the end of therapy, at 3 weeks or 3 months depending on tumor histology. Routine clinical follow-up visits were made every 6 months thereafter. PFI was determined from the first time point of tumor regression to the time of progressive disease, indepen-dent of completeness of previous response. Overall survival time was determined from the beginning of radiation therapy.
Statistical Analysis
Description of patient data, other than overall survival times, is given by mean (± SD [standard deviation]) unless otherwise
Figure 1. Three-field treatment plan for an oral squamous cell
carcino-ma. Transverse CT image at the level of the eyes with dose distribu-tions.
Abbildung 1. Therapieplan mit drei Feldern zur Behandlung eines
oralen Plattenepithelkarzinoms. Transversale CT-Aufnahme mit Dosis-verteilung auf Höhe der Augen.
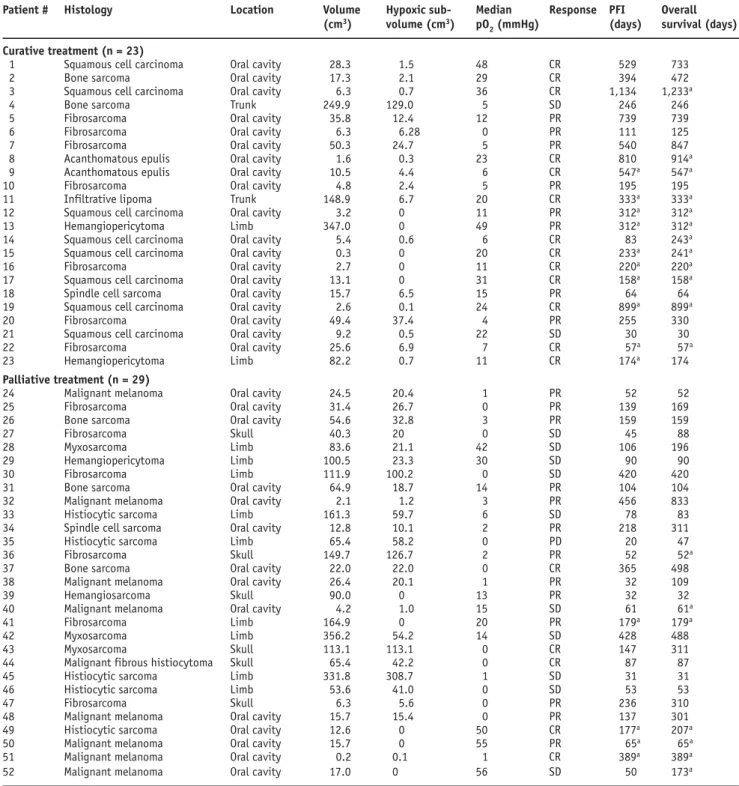
Table 1. Patient and tumor characteristics, median pO2 and response to therapy. CR: complete response (complete disappearance of all measurable and evaluable disease based on physical examination or diagnostic imaging); PD: progressive disease (increase in tumor measurements of ≥ 25%, or the development of new lesions); PFI: progression-free interval; PR: partial remission (reduction by ≥ 50%, with no new lesions developing); SD: stable disease (< 50% decrease or < 25% increase).
Tabelle 1. Patienten- und Tumordaten, Median der pO2-Messwerte und Ansprechen auf die Therapie. CR: komplette Remission (vollständige Rück-bildung des messbaren Tumors, evaluiert in klinischer Untersuchung und bildgebenden Verfahren); PD: progressive Erkrankung (Zunahme des Tumorvolumens von ≥ 25% oder Entwicklung neuer Läsionen); PFI: progressionsfreie Zeit; PR: partielle Remission (Rückbildung von ≥ 50%, keine Entwicklung neuer Läsionen); SD: stabile Erkrankung (< 50% Reduktion der Tumorgröße bzw. < 25% Zunahme).
Patient # Histology Location Volume Hypoxic sub- Median Response PFI Overall
(cm3) volume (cm3) pO
2 (mmHg) (days) survival (days)
Curative treatment (n = 23)
1 Squamous cell carcinoma Oral cavity 28.3 1.5 48 CR 529 733
2 Bone sarcoma Oral cavity 17.3 2.1 29 CR 394 472
3 Squamous cell carcinoma Oral cavity 6.3 0.7 36 CR 1,134 1,233a
4 Bone sarcoma Trunk 249.9 129.0 5 SD 246 246
5 Fibrosarcoma Oral cavity 35.8 12.4 12 PR 739 739
6 Fibrosarcoma Oral cavity 6.3 6.28 0 PR 111 125
7 Fibrosarcoma Oral cavity 50.3 24.7 5 PR 540 847
8 Acanthomatous epulis Oral cavity 1.6 0.3 23 CR 810 914a
9 Acanthomatous epulis Oral cavity 10.5 4.4 6 CR 547a 547a
10 Fibrosarcoma Oral cavity 4.8 2.4 5 PR 195 195
11 Infiltrative lipoma Trunk 148.9 6.7 20 CR 333a 333a
12 Squamous cell carcinoma Oral cavity 3.2 0 11 PR 312a 312a
13 Hemangiopericytoma Limb 347.0 0 49 PR 312a 312a
14 Squamous cell carcinoma Oral cavity 5.4 0.6 6 CR 83 243a
15 Squamous cell carcinoma Oral cavity 0.3 0 20 CR 233a 241a
16 Fibrosarcoma Oral cavity 2.7 0 11 CR 220a 220a
17 Squamous cell carcinoma Oral cavity 13.1 0 31 CR 158a 158a
18 Spindle cell sarcoma Oral cavity 15.7 6.5 15 PR 64 64
19 Squamous cell carcinoma Oral cavity 2.6 0.1 24 CR 899a 899a
20 Fibrosarcoma Oral cavity 49.4 37.4 4 PR 255 330
21 Squamous cell carcinoma Oral cavity 9.2 0.5 22 SD 30 30
22 Fibrosarcoma Oral cavity 25.6 6.9 7 CR 57a 57a
23 Hemangiopericytoma Limb 82.2 0.7 11 CR 174a 174
Palliative treatment (n = 29)
24 Malignant melanoma Oral cavity 24.5 20.4 1 PR 52 52
25 Fibrosarcoma Oral cavity 31.4 26.7 0 PR 139 169
26 Bone sarcoma Oral cavity 54.6 32.8 3 PR 159 159
27 Fibrosarcoma Skull 40.3 20 0 SD 45 88
28 Myxosarcoma Limb 83.6 21.1 42 SD 106 196
29 Hemangiopericytoma Limb 100.5 23.3 30 SD 90 90
30 Fibrosarcoma Limb 111.9 100.2 0 SD 420 420
31 Bone sarcoma Oral cavity 64.9 18.7 14 PR 104 104
32 Malignant melanoma Oral cavity 2.1 1.2 3 PR 456 833
33 Histiocytic sarcoma Limb 161.3 59.7 6 SD 78 83
34 Spindle cell sarcoma Oral cavity 12.8 10.1 2 PR 218 311
35 Histiocytic sarcoma Limb 65.4 58.2 0 PD 20 47
36 Fibrosarcoma Skull 149.7 126.7 2 PR 52 52a
37 Bone sarcoma Oral cavity 22.0 22.0 0 CR 365 498
38 Malignant melanoma Oral cavity 26.4 20.1 1 PR 32 109
39 Hemangiosarcoma Skull 90.0 0 13 PR 32 32
40 Malignant melanoma Oral cavity 4.2 1.0 15 SD 61 61a
41 Fibrosarcoma Limb 164.9 0 20 PR 179a 179a
42 Myxosarcoma Limb 356.2 54.2 14 SD 428 488
43 Myxosarcoma Skull 113.1 113.1 0 CR 147 311
44 Malignant fibrous histiocytoma Skull 65.4 42.2 0 CR 87 87
45 Histiocytic sarcoma Limb 331.8 308.7 1 SD 31 31
46 Histiocytic sarcoma Limb 53.6 41.0 0 SD 53 53
47 Fibrosarcoma Skull 6.3 5.6 0 PR 236 310
48 Malignant melanoma Oral cavity 15.7 15.4 0 PR 137 301
49 Histiocytic sarcoma Oral cavity 12.6 0 50 CR 177a 207a
50 Malignant melanoma Oral cavity 15.7 0 55 PR 65a 65a
51 Malignant melanoma Oral cavity 0.2 0.1 1 CR 389a 389a
52 Malignant melanoma Oral cavity 17.0 0 56 SD 50 173a
specified. Endpoints after radiation therapy were recorded as: (1) response to initial therapy, (2) PFI, and (3) overall surviv-al. Median PFI and overall survival times were reported to-gether with the 95% confidence interval (95% CI). Deaths attributable to disease progression were considered events in the survival analysis. Dogs that received additional treatment, died of other causes, were still alive at the time of data evalua-tion, or lost to follow-up, were censored.
The influences of different tumor and patient characteris-tics on descriptors of tumor oxygenation were evaluated by correlation (Wilcoxon rank test, Fisher’s exact probability test). PFI and overall survival were compared with respect to different tumor and patient characteristics by Kaplan-Meier method, log-rank and Breslow-Gehan-Wilcoxon tests, uni-variate proportional hazards and multiple Cox regression analysis. Distribution in HSV and tumor volumes were skewed; thus logarithmically transformed values were used rather than raw measurements. In all calculations, significance was assumed at a p-value of < 0.05. For statistical analysis, StatView 5.0.1 was used.
Results Patients
52 dogs with spontaneous malignant tumors were included in this series. Mean weight and age of the 24 female and 28 male dogs of various breeds at the time of diagnosis were 29.4 kg (range: 2.8–66 kg) and 9.3 years (range: 2–15 years), respec-tively. Only one dog had clinical evidence of pulmonary me-tastasis and none displayed a life-compromising disease other than the known cancer. The majority of the animals had sarcomas (n = 29), squamous cell carcinomas (n = 8), or malignant melanomas (n = 8). Most of the tumors were lo-cated in the oral cavity (n = 33). The hematologic param-eters were normally distributed. The mean hematocrit was 43.6% (range: 29–55%, normal:
37–55%; p = 0.466), the hemoglobin (Hb) 15.2 g/dl (range: 10–26.6 g/dl, nor-mal: 12–18 g/dl; p = 0.360).
pO2 Measurements and
Tumor Volumes
38 tumors were measured with an Eppen-dorf, 14 with a Phönix pO2 Histograph. The mean of all median pO2 values was low with 14 mmHg (range: 0–56 mmHg). 52% (27/52) of all tumors had median pO2 values ≤ 10 mmHg; 42.5% of all pO2 readings were ≤ 5 mmHg and 36.3% of all pO2 readings were ≤ 2.5 mmHg.
The mean tumor volume was 63.7 cm3
(± 88.2 cm3). Although the tumor
vol-umes and the HSV of the sarcoma group were significantly larger than the ones of the group with other histologies
(p = 0.0007 and p = 0.019), no correlation between tumor vol-umes, hematologic parameters, and any of the oxygen param-eters could be found. The relative frequency distribution of low oxygen levels in sarcoma and non-sarcoma histologies was not different; therefore for further analysis, the patients were split up according to their radiation treatment protocol.
Treatment Protocols and Response to Treatment
Initial therapy consisted of radiation (n = 52) given with cura-tive (n = 23) or palliacura-tive (n = 29) intent (mean total dose 50.5 Gy [± 3.5 Gy] vs. 27.3 Gy [± 4.9 Gy]). Seven patients each received additional chemotherapy or surgery. Response to treatment was observed in 51/52 patients (98%). Complete response could be observed in 18/52 patients (35%), partial response in 21/52 (40%), stable disease in 12/52 (23%), and progressive disease was seen in one case (2%; Table 1). At the time of analysis 14 patients were free of progression and 19 were still alive. Patients were followed up to death or the close-out date, and none was lost to follow-up. The mean and median follow-up times for patients still alive were 346 days (range: 52–1233 days) and 234 days, respectively. 25 patients died of tumor-related disease, four for other reasons, and in four cases cause of death could not be assessed.
Progression-Free Interval and Overall Survival
Univariate Models
Curatively treated patients that experienced a complete re-sponse after initial treatment had a median PFI of 810 days (95% CI 605–1,015 days), with non-complete response the PFI was 246 days (95% CI 198–293 days; p = 0.014). We found significant correlations between the percentages of pO2 vaues ≤ 10, 5 and 2.5 mmHg and shorter duration of the PFI in the curatively treated patients (Table 2). PFI for curatively
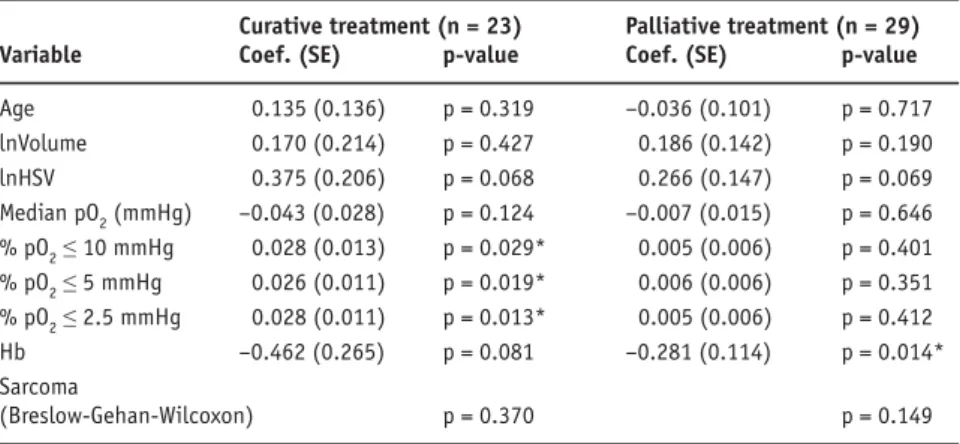
Table 2. Univariate proportional hazards Cox regression results for influences on
progres-sion-free interval. Hb: hemoglobin; HSV: hypoxic subvolume.
Tabelle 2. Resultate für beeinflussende Faktoren auf das progressionsfreie Intervall (univariate
Cox-Regression). Hb: Hämoglobin; HSV: hypoxisches Subvolumen.
Curative treatment (n = 23) Palliative treatment (n = 29) Variable Coef. (SE) p-value Coef. (SE) p-value
Age 0.135 (0.136) p = 0.319 –0.036 (0.101) p = 0.717 lnVolume 0.170 (0.214) p = 0.427 0.186 (0.142) p = 0.190 lnHSV 0.375 (0.206) p = 0.068 0.266 (0.147) p = 0.069 Median pO2 (mmHg) –0.043 (0.028) p = 0.124 –0.007 (0.015) p = 0.646 % pO2 ≤ 10 mmHg 0.028 (0.013) p = 0.029* 0.005 (0.006) p = 0.401 % pO2 ≤ 5 mmHg 0.026 (0.011) p = 0.019* 0.006 (0.006) p = 0.351 % pO2 ≤ 2.5 mmHg 0.028 (0.011) p = 0.013* 0.005 (0.006) p = 0.412 Hb –0.462 (0.265) p = 0.081 –0.281 (0.114) p = 0.014* Sarcoma (Breslow-Gehan-Wilcoxon) p = 0.370 p = 0.149 *p < 0.05
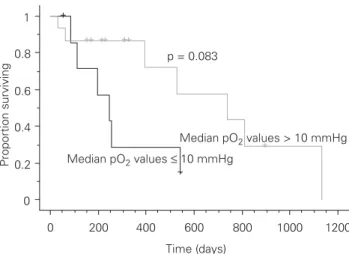
treated patients with median pO2 values > 10 mmHg was 739 days (95% CI 561–916 days), for median pO2 values ≤ 10 mmHg 246 days (95% CI 206–286 days; p = 0.083; Figure 2). For palliatively treated patients, the tumors had lower median pO2 values (p = 0.008); however, neither the median pO2
val-ues, nor the amount of pO2 values ≤ 10, 5 and 2.5 mmHg of the tumors in the palliatively treated group influenced PFI. The Hb level was negatively correlated with the duration of the PFI in the palliatively treated group only (p = 0.014). An influ-ence of the tumor group on the PFI could not be found.
The median overall survival time for patients with initial curative treatment intent was significantly longer than for the palliatively treated group (733 days [95% CI 541–925 days] vs. 196 days [95% CI 62–330 days]; p = 0.0011). Factors that influ-ence overall survival are displayed in Table 3: for patients of the
curatively treated group, high amounts of oxygen levels ≤ 5 or 2.5 mmHg resulted in a shorter overall survival time. Larger tumor volumes, HSV and low Hb levels were associated with shorter overall sur-vival in the palliatively treated group.
Multivariate Models
Multiple stepwise forward and backward analyses showed that for PFI and overall survival in the patients of the curatively treated group, the oxygen values were the only prognostic factors. In the pallia-tively treated group, PFI was influenced by Hb only, while overall survival was influenced by Hb levels, age and HSV (Table 4).
Discussion
This study found that the tumors with the highest number of pO2 values ≤ 10, 5 and 2.5 mmHg were related to the poorest outcome regard-ing PFI and overall survival for patients treated with curative intent. This finding was independent of tumor histology and volume. Also, a trend to longer PFI in tumors with median pO2 values > 10 mmHg could be shown, indicating a possible presence of a “cutoff” point in this region as described by Höckel et al. for human cervical cancers [18, 19].
Invasive oxygen electrode measurement studies have demonstrated the presence of hypoxia in a variety of human tumor types and sites [5, 6, 14, 24, 26–28], and a positive corre-lation has been demonstrated between the presence of hypoxia and poor treatment outcome. Nordsmark et al. found tumor Table 3. Univariate proportional hazards Cox regression results for influences on survival. For
abbreviations see Table 2.
Tabelle 3. Resultate für beeinflussende Faktoren auf die Überlebenszeit (univariate
Cox-Regression). Abkürzungen s. Tabelle 2.
Curative treatment (n = 23) Palliative treatment (n = 29) Variable Coef. (SE) p-value Coef. (SE) p-value
Age 0.181 (0.152) p = 0.233 –0.129 (0.095) p = 0.174 lnVolume 0.315 (0.217) p = 0.080 0.337 (0.162) p = 0.038* lnHSV 0.351 (0.201) p = 0.117 0.409 (0.176) p = 0.020* Median pO2 (mmHg) –0.037 (0.027) p = 0.167 –0.016 (0.018) p = 0.372 % pO2 ≤ 10 mmHg 0.025 (0.013) p = 0.056 0.005 (0.007) p = 0.501 % pO2 ≤ 5 mmHg 0.025 (0.011) p = 0.026* 0.004 (0.007) p = 0.504 % pO2 ≤ 2.5 mmHg 0.032 (0.013) p = 0.010* 0.004 (0.007) p = 0.595 Hb –0.309 (0.260) p = 0.235 –0.264 (0.135) p = 0.050* Sarcoma (Breslow-Gehan-Wilcoxon) p = 0.091 p = 0.426 *p < 0.05 0 0.2 0.4 0.6 0.8 1 Proportion surviving 0 200 400 600 800 1000 1200 Time (days) Median pO2 values ≤ 10 mmHg Median pO2 values > 10 mmHg p = 0.083
Figure 2. Kaplan-Meier cumulative plot for progression-free interval
for curatively treated patients grouped by median pO2 values. Disease progression was considered an event. Dogs still alive or lost to fol-low-up at the time of analysis were censored. +: censor times.
Abbildung 2. Kaplan-Meier-Kurve für progressionsfreie Zeit bei kurativ
behandelten Patienten, nach mittleren pO2-Werten gruppiert. Pro-gression der Erkrankung wurde als Ereignis angesehen. Hunde, die zur Zeit der Berechnung noch lebten oder für Nachfolgeuntersuchungen nicht mehr zur Verfügung standen, wurden zensiert (+).
Table 4. Multiple Cox regression analysis for influences on survival
(palliative group only). For abbreviations see Table 2.
Tabelle 4. Resultate für beeinflussende Faktoren auf die
Überlebens-zeit in der palliativ behandelten Gruppe (multiple Cox-Regression). Abkürzungen s. Tabelle 2.
Palliative treatment (n = 27)
Variable Coef. (SE) p-value
Age –0.201 (0.094) p = 0.033*
lnHSV 0.412 (0.205) p = 0.044*
Hb –0.365 (0.153) p = 0.017*
oxygenation status using the % pO2 values ≤ 2.5 mmHg being predictive for locoregional control after primary radiotherapy in squamous cell carcinoma of the head and neck, while Brizel et al. found additional prognostic significance of pretreatment median pO2 (below or above 10 mmHg) in soft-tissue sarco-mas [5, 6, 29]. However, Evans & Koch state, that the determi-nation of the appropriate endpoint for needle electrode mea-surements remains variable and unresolved [14].
We learned from other authors [30] and from our own ex-perience [1, 2] that sarcomas tend to be severely hypoxic. Brizel et al. [5] described a longer disease-free survival for patients with sarcomas of median pO2 > 10 mmHg, and also found more hypoxia was present in larger tumors of mesen-chymal origin [4]. However, in this regard no significance could be found in our data. Our findings are supported by findings first described by Vaupel et al. [39], stating that the occurrence of radiobiological hypoxia neither correlates with pathologic stage nor grade, and by the majority of published studies that do not support the paradigm that larger tumors are more hy-poxic than smaller tumors [19, 20, 22, 23, 26, 34, 36].
In our study the amount of tumor hypoxia only influ-enced the outcome in the group treated with curative intent (high doses) and not in the group that received lower total doses. A similar finding has been made by Brizel et al., where a higher radiation dose was related to longer overall survival, disease-free survival and duration of local-regional control [3]. Interestingly, in the palliatively treated group, where hypoxia was not found to be a determinant factor, the PFI and overall survival times correlated negatively with Hb levels. Some studies describe an association between anemia and poor tumor oxygenation, for example in rats [21], and worse prognoses for pre-, mid-, or end-treatment Hb levels for various tumor groups in humans have been reported [9, 10, 13, 16, 17, 25, 33, 34, 37]. However, pretreatment Hb level is more likely an indicator of prognosis in terms of the pa-tient’s general condition and the clinical relevance of Hb levels during and at the end of radiation therapy might be greater [13, 28].
Conclusion
Our findings support the hypothesis that tumor hypoxia in spontaneous canine tumors has an impact on PFI and overall survival time. Canine tumors contain large amounts of hy-poxic regions, and tumor hypoxia was found to be a strong prognostic indicator, independent of tumor histologies and volume.
References
1. Achermann R, Ohlerth S, Fidel J, et al. Ultrasound-guided, pre-radiation oxygen measurements using polarographic oxygen needle electrodes in spontaneous canine soft tissue sarcomas. In Vivo 2002;16:431–7. 2. Achermann RE, Ohlerth SM, Rohrer Bley C, et al. Oxygenation of
spontane-ous canine tumors during fractionated radiation therapy. Strahlenther Onkol 2004;180:297–305.
3. Brizel DM, Dodge RK, Clough RW, et al. Oxygenation of head and neck can-cer: changes during radiotherapy and impact on treatment outcome. Radio-ther Oncol 1999;53:113–7.
4. Brizel DM, Rosner GL, Harrelson J, et al. Pretreatment oxygenation profiles of human soft tissue sarcomas. Int J Radiat Oncol Biol Phys 1994;30:635–42. 5. Brizel DM, Scully SP, Harrelson JM, et al. Tumor oxygenation predicts for the
likelihood of distant metastases in human soft tissue sarcoma. Cancer Res 1996;56:941–3.
6. Brizel DM, Sibley GS, Prosnitz LR, et al. Tumor hypoxia adversely affects the prognosis of carcinoma of the head and neck. Int J Radiat Oncol Biol Phys 1997;38:285–9.
7. Bruehlmeier M, Achermann R, Kaser-Hotz B, et al. Measurement of tumor hypoxia and perfusion in spontaneous canine tumors using positron emis-sion tomography with [18F]-fluoromisonidazole, [18F]-EF5 and [15O]-H2O. Vet Radiol Ultrasound 2006:46:348–54.
8. Brurberg KG, Skogmo HK, Graff BA, et al. Fluctuations in pO2 in poorly and well-oxygenated spontaneous canine tumors before and during fractionat-ed radiation therapy. Radiother Oncol 2005;77:220–6.
9. Caro JJ, Salas M, Ward A, et al. Anemia as an independent prognostic factor for survival in patients with cancer: a systemic, quantitative review. Cancer 2001;91:2214–21.
10. Clarke H, Pallister CJ. The impact of anaemia on outcome in cancer. Clin Lab Haematol 2005;27:1–13.
11. Cline JM, Thrall DE, Rosner GL, et al. Distribution of the hypoxia marker CCI-103F in canine tumors. Int J Radiat Oncol Biol Phys 1994;28:921–33. 12. Dunst J. Management of anemia in patients undergoing curative radio-therapy. Erythropoietin, transfusions, or better nothing? Strahlenther Onkol 2004;180:671–81.
13. Dunst J, Kuhnt T, Strauss HG, et al. Anemia in cervical cancers: impact on survival, patterns of relapse, and association with hypoxia and angiogene-sis. Int J Radiat Oncol Biol Phys 2003;56:778–87.
14. Evans SM, Koch CJ. Prognostic significance of tumor oxygenation in hu-mans. Cancer Lett 2003;195:1–16.
15. Gagel B, Reinartz P, Dimartino E, et al. pO2 polarography versus positron emission tomography ([18F]-fluoromisonidazole, [18
F]-2-fluoro-2'-deoxy-glucose). An appraisal of radiotherapeutically relevant hypoxia. Strahlen-ther Onkol 2004;180:616–22.
16. Harrison L, Blackwell K. Hypoxia and anemia: factors in decreased sensitivity to radiation therapy and chemotherapy? Oncologist 2004;9:Suppl 5:31–40. 17. Harrison LB, Chadha M, Hill RJ, et al. Impact of tumor hypoxia and anemia
on radiation therapy outcomes. Oncologist 2002;7:492–508.
18. Höckel M, Knoop C, Schlenger K, et al. Intratumoral pO2 predicts survival in
advanced cancer of the uterine cervix. Radiother Oncol 1993;26:45–50. 19. Höckel M, Schlenger K, Aral B, et al. Association between tumor hypoxia
and malignant progression in advanced cancer of the uterine cervix. Cancer Res 1996;56:4509–15.
20. Höckel M, Schlenger K, Knoop C, et al. Oxygenation of carcinomas of the uterine cervix: evaluation by computerized O2 tension measurements. Can-cer Res 1991;51:6098–102.
21. Kelleher DK, Matthiensen U, Thews O, et al. Tumor oxygenation in anemic rats: effects of erythropoietin treatment versus red blood cell transfusion. Acta Oncol 1995;34:379–84.
22. Lartigau E, Le Ridant AM, Lambin P, et al. Oxygenation of head and neck tumors. Cancer 1993;71:2319–25.
23. Lartigau E, Randrianarivelo H, Avril MF, et al. Intratumoral oxygen tension in metastatic melanoma. Melanoma Res 1997;7:400–6.
24. Movsas B, Chapman JD, Greenberg RE, et al. Increasing levels of hypoxia in prostate carcinoma correlate significantly with increasing clinical stage and patient age: an Eppendorf pO(2) study. Cancer 2000;89:2018–24. 25. Nordsmark M, Bentzen SM, Overgaard J. Measurement of human tumour
oxygenation status by a polarographic needle electrode. An analysis of in-ter- and intratumour heterogeneity. Acta Oncol 1994;33:383–9. 26. Nordsmark M, Hoyer M, Keller J, et al. The relationship between tumor
oxy-genation and cell proliferation in human soft tissue sarcomas. Int J Radiat Oncol Biol Phys 1996;35:701–8.
27. Nordsmark M, Overgaard J. A confirmatory prognostic study on oxygen-ation status and loco-regional control in advanced head and neck squa-mous cell carcinoma treated by radiation therapy. Radiother Oncol 2000; 57:39–43.
28. Nordsmark M, Overgaard J. Tumor hypoxia is independent of hemoglobin and prognostic for loco-regional tumor control after primary radiotherapy in advanced head and neck cancer. Acta Oncol 2004;43:396–403. 29. Nordsmark M, Overgaard M, Overgaard J. Pretreatment oxygenation predicts
radiation response in advanced squamous cell carcinoma of the head and neck. Radiother Oncol 1996;41:31–9.
30. Nozue M, Lee I, Yuan F, et al. Interlaboratory variation in oxygen tension measurement by Eppendorf “Histograph” and comparison with hypoxic marker. J Surg Oncol 1997;66:30–8.
31. Raleigh JA, Zeman EM, Calkins DP, et al. Distribution of hypoxia and prolif-eration-associated markers in spontaneous canine tumors. Acta Oncol 1995;34:345–9.
32. Rasey JS, Koh WJ, Grierson JR, et al. Radiolabelled fluoromisonidazole as an imaging agent for tumor hypoxia. Int J Radiat Oncol Biol Phys 1989; 17:985–91.
33. Rudat V, Vanselow B, Wollensack P, et al. Repeatability and prognostic im-pact of the pretreatment pO(2) histography in patients with advanced head and neck cancer. Radiother Oncol 2000;57:31–7.
34. Stadler P, Becker A, Feldmann HJ, et al. Influence of the hypoxic subvolume on the survival of patients with head and neck cancer. Int J Radiat Oncol Biol Phys 1999;44:749–54.
35. Steel GG. The growth rate of tumours. In: Steel GG, ed. Basic clinical radio-biology, 3rd edn. New York: Arnold, 2002:8–22.
36. Sundfor K, Lyng H, Trope CG, et al. Treatment outcome in advanced squa-mous cell carcinoma of the uterine cervix: relationships to pretreatment tumor oxygenation and vascularization. Radiother Oncol 2000;54:101–7.
37. Van Belle SJ, Cocquyt V. Impact of haemoglobin levels on the outcome of cancers treated with chemotherapy. Crit Rev Oncol Hematol 2003;47:1–11. 38. Vaupel P, Kallinowski F, Okunieff P. Blood flow, oxygen and nutrient supply,
and metabolic microenvironment of human tumors: a review. Cancer Res 1989;49:6449–65.
39. Vaupel P, Schlenger K, Knoop C, et al. Oxygenation of human tumors: eval-uation of tissue oxygen distribution in breast cancers by computerized O2 tension measurements. Cancer Res 1991;51:3316–22.
40. Zips D, Adam M, Flentje M, et al. Impact of hypoxia and the metabolic mi-croenvironment on radiotherapy of solid tumors. Introduction of a multi-in-stitutional research project. Strahlenther Onkol 2004;180:609–15.
Address for Correspondence
Dr. med. vet. Dipl.-ACVR (Radiation Oncology) Carla Rohrer Bley
Section of Diagnostic Imaging and Radiaton Oncology Vetsuisse Faculty University of Zurich Winterthurerstraße 260 8057 Zürich Switzerland Phone (+41/44) 635-8487, Fax -8940 e-mail: crohrer@vetclinics.unizh.ch