CO
2Mitigation Costs for Canada and the Alberta Oil Sands
By
Justin David Anderson
Bachelor of Science in Mechanical Engineering University of Calgary, Calgary, Alberta, Canada, 2006
SUBMITTED TO THE DEPARTMENT OF AERONAUTICS AND ASTRONAUTICS IN PARTIAL FULFILLMENT OF THE REQUIREMENTS FOR THE DEGREE OF
MASTER OF SCIENCE IN AERONAUTICS AND ASTRONAUTICS at the
MASSACHUSETTS INSTITUTE OF TECHNOLOGY JANUARY 2008
©2008 Massachusetts Institute of Technology. All rights reserved.
Signature of Author:
Department of Aeronautics and Astronautics Jan 24, 2008
Certified by:
t4
John M. ReillySenior Lec er, Sloan School of Management Associate Director for Research, Joint Program on the Science and Policy of Global Change
//7
. ,Iis supervisor Certified by:Ian A. Waitz Professor of nautics and Astronautics
Thesis supervisor
Accepted by
(
David L. Darmofal Professor oTAeronautics and AstronauticsChair Cnmmittee on GradTate S•tnu~nts
ARCHIVES
MASSACHUSETS INSTf~ JE OF TEGHNOLOGYMAR
2 5 2008
LIBRARIES
I LRREi
Abstract
The threat of climate change proposes difficult problems for regulators and decision-makers in terms of uncertainties, varying exposures to risks and different attitudes towards risk among nations. Impact and cost assessments aim to alleviate some of these difficulties by attempting to treat the costs of inaction, regulation and adaptation. For such assessments to be relevant, they must deal with regions individually to estimate costs associated with different regulations since across regions the impacts from climate change and climate change regulation are heterogeneous. Canada, and her oil sands industry, is the focus of this CO2 mitigation cost and climate change impacts study. Two
Canadian policies, in line with the stated goals of the two largest Canadian political parties, have been modeled using MIT's Emission Prediction and Policy Analysis tool to better understand the costs of the policies and the emission reductions that they will achieve. Welfare losses reaching 3.3% (in 2050) for the goals outlined in the Canadian government's "Climate Action Plan" and 8.3% (in 2050) for the goal to meet Kyoto and post-Kyoto targets put forward by the opposition are predicted by the model. Oil sands upgrading/refining experiences severe carbon leakage while Oil Sands production is more resilient and may present less regulatory risk for investment. Gasification to produce natural gas substitutes could potentially be undermined by strict CO2 policy unless
optimistic carbon capture technology emerges. The results are highly dependent on whether an international carbon trading regime exists and whether bio-fuels emerge as a large scale, affordable, alternative to fossil fuels. The results are also dependent, to a lesser extent, on international CO2 policy
Thesis Adviser: Dr. John M. Reilly
Title: Senior Lecturer, Sloan School of Management & Associate Director for Research, Joint Program on the Science and Policy of Global Change
Thesis Adviser: Dr. Ian A. Waitz
Title: Professor of Aeronautics and Astronautics
Struggling for thought Caught me moving, broke the fall Never again to see like The guilt and dream washed Bubbling memory Breathing now Running now To catch the wind - to taste the moment Alone at last and together forever
Table of Contents
T able of C ontents ... 3
List of Tables and Figures... 3
Introduction... ... 5
B ackground ... ... 5
Global Warming Impacts for Canada ... 6
Conclusions: Global Warming Impacts for Canada ... 17
Canadian M itigation Costs... ... 17
The EPPA M odel ... 18
Standard E PPA ... 18
EPPA M odifications ... ... 20
Scenarios ... 29
Mitigation Costs for Canada ... 33
Mitigation Costs for Oil Sands Industry ... ... 49
Climate Change Risks for the Oil Sands Industry: Water Resource Constraints ... 51
Oil Sands Industry Mitigation Costs... ... 52
C onclusion .. ... 59
List of Tables and Figures
Figure 1 -Sensitivity to sea level rise ... ... 11Figure 2 -Fort Louisbourg (1743) high tide sea level ... ... 12
Figure 3 -Halifax tide gauge record ... 13
Figure 4 -The Northwest Passage ... 14
Figure 5 -Integrated Global Systems Model (IGSM) ... ... 19
Figure 6 -Trade, good and service flows in EPPA... ... 20
Figure 7 -Bitumen production function ... 22
Figure 8 -Bitumen upgrading production function ... 22
Figure 9 -Fixed factor for Canadian and Latin American heavy oil production functions ... ... 23
Figure 10 -Canadian Emissions 1990-2004 ... ... 34
Figure 11 -World CO2 Emissions, core cases ... ... 35
Figure 12 -Canadian CO2 Emissions, core cases ... ... 35
Figure 13 - Canadian CO2 Price, core cases... 36
Figure 14 - Canadian Welfare Change, core cases... ... 36
Figure 15 - World Petroleum Price, core cases ... ... 39
Figure 16 - North American Natural Gas Prices, core cases... 39
Figure 17 - North American Coal Prices, core cases ... ... 39
Figure 18 - North American Electricity Prices, core cases ... . 39
Figure 19 - Canadian Primary Energy Production, BAU... 41
Figure 20 - Canadian Primary Energy Consumption, BAU... 41
Figure 22 - Canadian Primary Energy Consumption, CAP ... . 41
Figure 23 - Canadian Primary Energy Production, KAB... 41
Figure 24 - Canadian Primary Energy Consumption, KAB... 41
Figure 25 - Canadian Electricity Generation, BAU ... ... 43
Figure 26 - Canadian Electricity Generation, CAP ... ... 43
Figure 27 - Canadian Welfare Change, Limited Bio-fuels ... . 45
Figure 28 - Canadian CO2 Price, Limited Bio-fuels ... ... 45
Figure 29 - Canadian Welfare Change, CO2 Trading ... .... 47
Figure 30 - Canadian CO2 Price, CO2 Trading ... ... 47
Figure 31 - Canadian Welfare Change, Strict Foreign Policy... 48
Figure 32 - Canadian CO2 Price, Strict Foreign Policy... .... 48
Figure 33 - Historical Canadian Bitumen Production since 1967... 49
Figure 34 - Bitumen Upgrading Capacity - core case ... 53
Figure 35 - Canadian Natural / Synthetic Gas Production, core case, BAU... 54
Figure 36 - Canadian Natural / Synthetic Gas Production, core case, CAP ... 54
Figure 37 - Canadian Natural / Synthetic Gas Use, core case, BAU ... 55
Figure 38 - Canadian Natural / Synthetic Gas Use, core case, CAP ... 55
Figure 39 - Canadian Natural / Synthetic Gas Use, core case, KAB ... 55
Figure 40 - Canadian Bitumen Production, CAP ... ... 56
Figure 41 - Canadian Bitumen Production, KAB ... ... 56
Figure 42 - Bitumen Upgrading Capacity - Limited bio-fuels, CAP ... 58
Figure 43 -Bitumen Upgrading Capacity - Oil Sands CCS included, CAP ... 58
Figure 44 - Bitumen Upgrading Capacity - International CO2 Trading, CAP ... 58
Figure 45 -Bitumen Upgrading Capacity - Strict International Policy, CAP... 58
Table 1 - Extreme weather impacts for Canada observed from 1920 until 2003... 9
Table 2 -Impacts from changes in sea level... ... 12
Table 3 -Forest Fire projections ... 15
Table 4 - Percent change in international tourism by century's end from warming... 16
Table 5 -Advantages and Disadvantages of predictive approaches ... 18
Table 6 - Cost Structure of Bitumen Production in Canada (USD/bbl) ... 24
Table 7 - Cost Structure of Bitumen Upgrading in Canada (USD/bbl) ... 25
Table 8 -Markups to account for transportation costs ... .... 25
Table 9 - Pulverized Coal Capture Cost Data ... ... 27
Table 10 - Value of bitumen inputs per ton of CO2 emitted, aggregated ... 27
Table 11 -Input Shares for bitumen production and upgrading... 27
Table 12 - Capital, labor and fuel inputs for production and carbon capture and sequestration ($/ton CO 2)... 28
Table 13 - Major Canadian Party Proposals and Discussions for GHG regulation... 30
Table 14 - Carbon emission targets in mmt of C used in the 'weak' case ... 32
Table 15 - Carbon emission targets in mmt of C used in the 'strict' case... 32
Introduction
The Intergovernmental Panel on Climate Change (IPCC), a group of scientists and policy makers who periodically meet and review climate change research, concluded that the evidence that anthropogenic greenhouse gases are responsible for warming is
incontrovertible (Intergovernmental Panel On Climate Change 2007). Trying to quantify the potential impacts posed by global warming represent a significant challenge to the scientific community and are researched and debated today throughout the world. Possibly an even greater challenge is before international diplomacy and policy makers who will be responsible for the major economic and environmental fall out of any measures, or lack of measures, taken to address the issue.
A significant contribution to the difficulties of finding an optimal policy in response to the possible threat of anthropogenic climate change is the difficulty of predicting the impact of CO2-reducing policies on the world's environment and
economies. It is therefore necessary for individual nations to strive to quantify the benefits and costs associated with policy action, or inaction, with respect to greenhouse gas emissions. The primary purpose of this thesis is to help quantify the costs of climate change policy for one nation of the world, Canada, by focusing on the costs of CO2 mitigation on Canada's economy and on one of her fastest growing industries - the Alberta Oil Sands. The primary goal is accomplished by means of the Emissions Prediction and Policy Analysis, or EPPA, model which will be introduced later. Before undertaking such an analysis I briefly investigate the environmental effect of a warmer climate for Canada by reviewing impacts literature relevant for Canada.
Background
The Canadian government has been considering climate change policy for some time as a party to international efforts to negotiate an agreement to limit greenhouse gases. In 1992, The United Nations Framework Convention on Climate Change
(UNFCCC) set out the non-binding objective "to achieve stabilization of greenhouse gas concentrations in the atmosphere at a low enough level to prevent dangerous
anthropogenic interference with the climate system" for its party countries
(Intergovernmental Negotiating Committee for a Framework Convention on Climate Change 1992). Since the UNFCCC entered into force, the parties have met in annual Conferences of the Parties (COP) to assess the progress of the Convention and to establish legally binding commitments from developed countries to reduce their greenhouse gas emissions. COP-3, the third annual conference held in 1997 in Kyoto, Japan, set out a binding international agreement for reducing emissions in developed
nations known as the Kyoto Protocol. The Kyoto Protocol binds Annex I countries' to reduce their greenhouse gas emissions to levels 6-8 percent below the protocol's 1990 reference year or buy international carbon credits to make up the difference. Most Annex I countries, with the notable exception of the United States and Australia, have since ratified of the treaty thereby committing their governments to enforcing Kyoto at a national level.
Canada ratified the Kyoto protocol on December 17, 2002 and in so doing committed to reducing its greenhouse gas emissions to 6 percent below its 1990 levels. However, Canadian Federal and Provincial governments have not passed any bills which set out a domestic trading scheme or greenhouse gas limits. Most of the response, so far, has been in the form of increasing efficiency and decreasing consumer energy
consumption through such programs as the one ton challenge2. Those responses appear inadequate to meet Canada's Kyoto commitment. The primary objective of this thesis is to analyze proposed Canadian policies that would attempt to meet Kyoto and possible follow-on emission targets. I focus, particularly, on the oil sands industry. The growth of oil sands production has been a boon to the Canadian economy but also a major contributor to CO2 emissions growth. Whether and under what conditions this industry
remains viable with climate policy are the main questions addressed.
Before addressing theses questions in detail, I briefly review the environmental impacts of climate change. While a detailed environmental impacts study for Canada is beyond the scope of this thesis, any mitigation cost analysis should recognize that there are environmental costs and benefits associated with climate change.
Global Warming
Impacts
for Canada
Global warming will affect different countries in different ways. The focus of this section is to briefly investigate and summarize the warming effects on Canada over the past century.
Cropland, pastureland and forestry
Climate change will likely have its greatest impact on those industries whose operations are most dependent on the climate. Agriculture is such an industry. Many studies have explored, through models and experimentation, the potential effects of a C02-richer and warmer world on soil quality, an input for agriculture producers. Studies
1 Annex I countries include Australia, Austria, Belarus, Belgium, Bulgaria, Canada, Croatia, Czech Republic, Denmark, European Union, Estonia, Finland, France, Germany, Greece, Hungary, Iceland,
Ireland, Italy, Japan, Latvia, Liechtenstein, Lithuania, Luxembourg, Monaco, Netherlands, New Zealand, Norway, Poland, Portugal, Romania, Russian Federation, Slovakia, Slovenia, Spain, Sweden, Switzerland, Turkey, Ukraine, United Kingdom and The United States of America (SOURCE)
2 The One Ton Challenge is an initiative to encourage consumers to reduce their CO2 emissions by a ton a year
range between negative impacts from increased insect populations and droughts to positive impacts due to increased water supplies, higher CO2 concentrations and better
soil conditions. The United States Department of Agriculture (Darwin et al. 1995) reports that "global changes in temperature and precipitation patterns during the next century are not likely to imperil food production for the world as a whole" and that "water supplies are likely to increase for the world". The report talks about impacts varying depending on the country and specifically cites Canada as an example where "the amount of land suitable for farming and forestry will increase". A 2002 report by the National Agriculture Assessment Group (Reilly, Graham, and Hrubovcak 2002) found more positive impacts on forestry and cropland yields as their models also accounted for the well documented beneficial effects of higher atmospheric CO2 concentrations, an
effect not accounted for in the 1995 US Department of Agriculture study. The
assessment group found that the productivity for the US crops increased overall under increased temperature and CO2 concentrations. A more recent MIT study (Reilly et al.
2006) yielded the same general result that CO2 emissions positively impact cropland,
pastureland and forestry yields.
While their exists important uncertainties in the impacts on cropland, pastureland and forestry yields from climate change, northern agriculture is usually expected to benefit from climate change. Northern climates are routinely identified as benefiting more from temperature and water supply increases. An MIT study (Deschenes and Greenstone 2007) using a hedonic3 approach to evaluate economic impacts from climate change and climate variation found that climate change will lead to a 3.4% increase in annual agricultural sector profits with the 95% confidence band of-5.6% to 12.4% change in annual agricultural sector profits resulting from climate change and variation. While the confidence band is subject to uncertainty limitations, it does give a rough indication for the weighing of uncertainty in climate change and variation in impacts on agriculture. An integrated international CO2 trading scheme could reduce the costs of
meeting emission targets, especially for countries with strict policies relative to other carbon trading countries. As international CO2 emission targets get more ambitious,
Canada might benefit from the development of a large-scale Canadian bio-fuels industry to help countries meet those targets. However, such international policy could also cripple the oil sands by reducing global demand for carbon-rich fuels, such as bitumen. Canada's agricultural sector under climate change (using a GCM4) is 19-49 billion US
dollars by the year 2100 (Mendelsohn et al. 2000).
A point emphasized by this final study and confirmed by the 2002 assessment group is that the consequences of climate change for agriculture hinge on changes in climate variability and extreme events. While increases in temperature and CO2
concentrations benefit agricultural production, increases in drought, flood and storm frequency will have a negative effect on agriculture. The connection between extreme
3 hedonic approach is to be contrasted with the production function approach -the latter's limitation being that it does not account for the full range of compensatory responses to changes in weather made by profit-maximizing farmers
weather events and climate change are not well understood and so impact analyses such as those cited above may provide an overly optimistic assessment of agricultural impacts. Extreme weather events
Global warming has been linked to possible increases in extreme weather events such as hurricanes, droughts, blizzards, forest fires and tornadoes. The causal link, if any, between the frequency of extreme events and global warming only can be determined through statistical analyses of long-term data because the natural climate system can produce weather and climate events that often appear to be uncharacteristic of the recent climate (variability) and since precise causes of extreme weather events are generally poorly understood although under intense research.
Other extreme weather events, such as droughts and floods, are very region-dependent on the role that warming is having or will have on their frequency and
intensity. As we are considering Canada specifically, I summarize the findings of a study published by the government of Alberta on the trending effects of global warming from the 1920s until now on Canadian extreme weather events (Khandekar 2002).
One main purpose of this thesis is to take a high-level potential problem, the threat of climate change, and investigate how it might impact a specific region - in this case Canada. For the threat of climate change to have traction, we must investigate how it will impact individual countries and communities. The major climate impacts of relevance to Canadians include (a) changes in summer time hot spells' and winter time cold spells' frequency and intensity, (b) changes in summer and winter heavy
precipitation events, (c) changes in average winter temperatures and (d) changes in the frequency and intensity of droughts, floods, blizzards, ice storms, severe hail, severe wind, tornadoes and other storms. Table 1, which is based on the information in the Khandekar study, summarizes the trending of these events and conditions of concern over the past 80 years of about 1 degree mean warming in Canada. Unfortunately, it is the only study which I could find on extreme weather event trending for Canada.
Table 1 - Extreme weather impacts for Canada observed from 1920 until 2003
Impact
Trend
Average
1-3 degrees warming for the Western provinces in the summer. 1-2 degreesTemperature
cooling for the Western provinces in the winter. Eastern Canadian provinces have seen little change in temperature trends during the winter and summer.Average
Moderate increase in annual precipitation. Moderate precipitation increasesPrecipitation
due largely to light or medium precipitation events.Droughts
Droughts are a major concern for the Canadian prairies and havehistorically impacted the region with devastating consequences (especially during the 1920s and 1930s). The El-Nino-Southern Oscillation (ENSO) and the Pacific North American (PNA) atmospheric flows are the important driving mechanisms of droughts in the region. There is no present link between warming trends and drought occurrences on the Canadian prairies.
Floods
Major flooding is not an issue in Canada. No trend in localized floodingobserved.
Heat
waves Heat waves have declined in the summer months.Cold (and
Mixed cold spell changes. The Western provinces have seen a decrease inwarm) spells
the number of winter cold spells. Ontario and Quebec have seen no significant change in winter cold spells. The Atlantic provinces have seen an increase in winter cold spells. The majority of the country has had an increase in winter warm spells.Blizzards
Several inconclusive studies caused the IPCC to conclude in 2001 that "the evidence on change in extra-tropical synoptic systems is inconclusive; there is no evidence of any uniform increase." The more recent Larson study (Lawson 2003) concluded no change in blizzard severity in Canada and a decrease in blizzard occurrences.Ice
Storms
/ Ice storms are primarily a concern for the Eastern provinces. No increasing Freezing Rain trend in ice storm activity. The most intense ice storm in the last 40 yearshappened in 1998. Research concludes that the formation of two low-pressure weather systems in quick succession, aided by the extreme phases of the 97'/98' El Nino and a favorable NAO, were the main causes of the 98' ice storm.
Tornadoes
/ Although no increasing or decreasing trends are detectable from thethunderstorms
statistical analysis, the data is limited. The limitation is because advances in detection and frequent tornado and storm monitoring emerged only in recent decades. Theories postulate that tornado activity is more a function of regional mean surface maximums (which are trending to less extreme in Canada) than global mean temperatures.Hail
The only significant data available is for Alberta and Saskatchewan where agriculture is impacted significantly from hail storms. No increasing or decreasing trend detected in hail activity for these regions. For continental USA, a declining trend in hail activity is observed over the past 50 years.Wind
Wind damage from events other than thunderstorms and tornadoes are uncommon in Canada, except for rare east-coast hurricanes. No increasing or decreasing trend from this kind of wind damage observed.It is difficult to establish a causal link between the one degree of mean
temperature rise in Canada over the past century and the occurrences of extreme weather events given the many variables that trigger such events and the poor understanding of (and poor ability to measure) many of those variables. Correlations between the occurrences and intensity of Canadian extreme weather events and the 0.6 degrees of mean global warming are generally non-existent or exhibit a negative association
according to the Khandekar study.
Sea level
In 2007, the IPCC estimated using a range of model outputs based on various scenario inputs, that global sea level will rise anywhere from 18 to 54 cms from 1990 to 21005 (Intergovernmental Panel On Climate Change 2007). The large range represents the modeled uncertainties in both temperature change and gaps in ocean and hydrology understanding.
The main regions which could be impacted by significant sea level change include the great lakes region and the Atlantic Provinces. Sensitivity to sea level change for Canada's ocean coasts is shown in Figure 1. Sensitivity is influenced by geological characteristics of the shoreline and ocean processes in addition to whether sea level is rising or falling in the region.
5 In contrast to their 2001 estimate of 9cm to 88cm by 2100 (Intergovernmental Panel On Climate Change 2001).
Figure 1 -Sensitivity to sea level rise
Source: (Shaw et al. 1998)
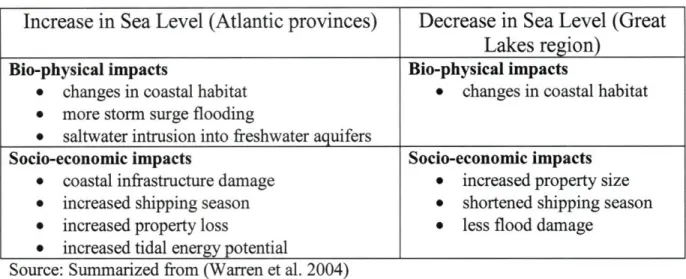
The Atlantic Provinces and great lake region differ in the direction of projected sea-level change. Sea level is expected to continue to rise in the Atlantic Provinces and projected to recede in the great lakes region. The projected impacts of sea level change
are summarized in the following table, summarizing a recent climate change impacts study by the government of Canada (Warren et al. 2004):
Table 2 -Impacts from changes in sea level
Increase in Sea Level (Atlantic provinces)
Decrease in Sea Level (Great
Lakes region)
Bio-physical impacts Bio-physical impacts
* changes in coastal habitat * changes in coastal habitat * more storm surge flooding
* saltwater intrusion into freshwater aquifers
Socio-economic impacts Socio-economic impacts
* coastal infrastructure damage * increased property size * increased shipping season * shortened shipping season * increased property loss * less flood damage
* increased tidal energy potential
Source: Summarized from (Warren et al. 2004)
How has Canada dealt with sea level changes in the past? In Atlantic Canada (except Labrador) the sea level has been rising for thousands of years. The trend is illustrated in Figure 2 which shows the mooring rings at Fortress Louisbourg. The Halifax tide gauge record in Figure 3 gives us an idea of the sea level change rate in the region (about 3.6cm/decade) during the previous century together with some projections going forward. Canada has coped with sea level change in the past with fewer resources through a combination of coastal retreat and defense. The changes have presented new challenges and opportunities then and will do so in the future.
Figure 2 -Fort Louisbourg (1743) high tide sea level
Figure 3 -Halifax tide gauge record 2.2-, i6. 1.2 1.0-1900 190 2000 20M 21C0 YOar
Source: (Warren et al. 2004)
Any rapid change in sea level will be costly to sensitive regions. The Atlantic region is the most exposed to possible damage from sea level change. Modem
technology, the slow rate of sea level change, Canada's vast land mass, rocky shores and low coastal population density could mitigate the risks of sea level rise for Canada.
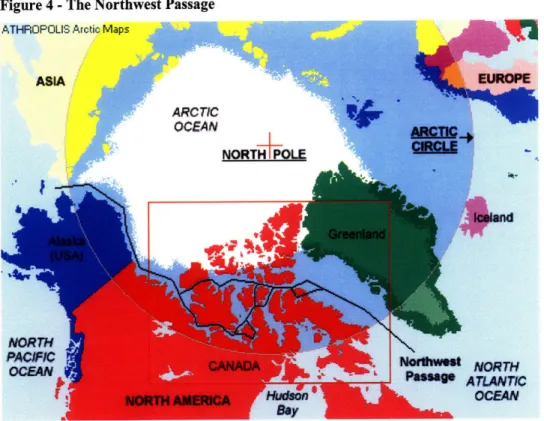
The Northwest Passage
Speculation exists about the possibility of global warming opening up the Northwest Passage to high volume shipping. The passage is presently seldom used by ships because of the often impassable sections of ice. Some thinning of the ice has been observed throughout the passage over the past few decades and interested parties are considering using of the passage for more frequent international shipping. Figure 4 displays the route in question.
Figure 4 -The Northwest Passage
The opening of the Northwest Passage would likely present opportunities and challenges for Canada. The passage, as a commercial shipping lane, could provide an economic boost for Northern towns and infrastructure. The use of the passage could also give Canada an opportunity to assert its sovereignty in the region and access to the passage could become a useful bargaining tool. Alternatively, if Canada is unable to assert her sovereignty over the region, she could lose her right to assert her own
environmental standard over the passage. Environmental degradation related to increased activity in the passage could ensue. In addition, asserting sovereignty over the passage via warships and other vessels would require government expenditures. While the world would likely benefit from access to the Northwest Passage, it is not obvious that Canada would as well.
Forest Fires
Forest fires are an integral part of the survival of Canada's boreal forests and ecosystems - without them much of the ecosystem could not persist (Environment Canada 2006b). Forest fires can also cause significant property damage. The costs of forest fire damage in Canada are estimated to be around 7 million annually (Warren et al. 2004).
Predictions of how mean temperature and precipitation increases in Canada will impact forest fires are very uncertain (Warren et al. 2004). Studies of frequency and severity trending over the past century are conflicting with results showing slight decreasing, increasing and non-trending behavior. Projections of future severity and
frequency by means of models are also conflicted, the box below showing the predictions of forest fire frequencies for various regions with different models.
Table 3 -Forest Fire projections
Region Prediction Eastern boreal forest
Fewerforestfires in future (based on historical analysis)
Canada
Increase inforestfire danger Great regional variability
(based on Forest Fire Weather Index)
Western Canada
Increase in strength and extent offires (based on RCM1 projections)
North America
General increase inforestfire activity
Little change or even a decrease in some regions (based on GCM 2x CO2 projection)
Alberta
Increase infirefrequency
(based on GCM 2x CO2 projection)
Southwestern boreal forest, Ouebec
Decrease infirefrequency
(based on GCM 2x CO2 projection) Ontario
Increase inforestfire frequency and severity (based on Forest Fire Weather Index)
Canada
Increase in fire activity Longer fire season
Increase in area of extreme fire danger (based on GCM 2x C0 2projection)
Source: Summarized from (Warren et al. 2004)
Paradoxically, it has been shown that warm weather does not necessarily lead to a bad forest fire season. 2001, the hottest year on record, had the lowest forest fire
frequency and severity on record (Warren et al. 2004). Major variables affecting forest fire frequency and severity include vegetation type, wind, lightning frequency, antecedent moisture conditions and fire management mechanisms. Significant uncertainties remain in how climate change will impact forest fire frequency and severity.
Animals and Insects
Insects pose a more significant threat to forests than fires (Environment Canada 2006b). Like fires, insects can play an important role in controlling tree growth. While warmer weather may encourage migrations of new insects and accelerate the growth rates
for some species (while reducing others), reduced snow cover during the winter may reduce insect survivability. Significant uncertainties remain in how climate change will
impact insect populations.
The impacts of warming on wildlife populations, mentioned by the most recent IPCC impacts report (Parry et al. 2007), include changes in phenology, migration, reproduction dormancy and geographic range.
Water Resources
Canada has a lot of fresh water. While making up 0.5% of the world's population, Canada has 9% of the world's fresh water supplies (Warren et al. 2004).
Weather extremes, such as hot spells and flooding, are the major drivers of stresses on water supplies. Given the difficulties in predicting the frequency and intensity of such events in a warmer and wetter Canada, it is difficult to predict the impact of global warming on Canada's water supplies on vulnerable locales.
Tourism
Tourism in Canada may increase from global warming. An international team of economists ran a study using the 'Hamburg Tourism Model' to predict how global mean temperature changes will affect tourism in various countries (Bigano, Hamilton, and Tol 2006). Canada was the biggest single net gainer of international tourism under global warming according to the study. The results are summarized in TB below as percent
changes in tourism in 2100 from what the predicted levels at that time would be without warming.
Table 4 - Percent change in international tourism by century's end from warming
Biggest Increases
Biggest Declines
Canada +220%
Mauritania -60%
Russia +174% Mali -59%
Mongolia +122% Bahrain -58%
Kyrgyzstan +89% Qatar -58%
Zimbabwe +88% Kuwait -56%
Tajikistan +86% United Arab Emirates -55%
Iceland +85% Senegal -54%
Finland +82% Niger -54%
Zambia +82% Burkina Faso -53%
Norway +77% Namibia -52%
The literature on tourism-analysis is limited and in particular, I can find no studies which investigate global warming-changes in tourism trends. The studies which use models, such as the study already mentioned, emphasize that some country's tourist industries will gain while others will lose from climate change. According to the Bigano
study, Canada is considered one of the biggest gainers in tourism from global warming.
Conclusions: Global Warming Impacts for Canada
The purpose of this section is to summarize the challenges and opportunities presented to Canada should temperatures rise as projected by the 2007 IPCC report (Intergovernmental Panel On Climate Change 2007). Emphasis has been placed on using historical temperature data-climate statistical associations to predict how Canada's
climate will change under IPCC global warming projections since there remains important gaps in climate-temperature theories and model predictions of local climate change impacts often present conflicting results or have unwieldy associated
uncertainties.
Based on the literature reviewed, there will likely be numerous effects on
Canada's environment from global warming. Canada's agricultural industry may benefit from warmer conditions and higher CO2 concentrations however there could also be
drought risks which might hurt the industry. Canada's tourist industry may benefit from the temperature rise as the tourist season would lengthen. Global warming may also contribute to the trend of the opening of the NW passage. The NW passage could be harnessed to Canada's benefit commercially but could provide challenges such as environmental pollution in the region from increased traffic and increased demands for governmental oversight in the region. Not many kinds of extreme weather events are trending much either way in terms of frequency or intensity. Sea level changes will likely be negative for Canada's Atlantic region requiring adaptation and changes in the deployment of coastal infrastructure. Finally, the work on the impacts on plant and animal life and Canada's internal water resources is too sparse to make any claims on those fronts. There are other potential environmental impacts than those mentioned here such as impacts of warming causing changes in tundra distribution and permafrost. Canada should expect significant environmental changes arising from global warming and should attempt to quantify the costs and benefits, and their uncertainties, as well as possible.
Canadian Mitigation Costs
Evaluating the mitigation costs for Canada is the central purpose of this thesis and is now considered. The analysis is performed using MIT's Emission Policy and
introduction to the Canadian and world policies which are used in the analysis. Finally, I present and analyze the results.
The EPPA Model
Two broad modeling approaches taken for predicting the interaction between energy, economic and environmental systems and technology (van der Zwaan, B.C.C. et al.). The bottom-up approach usually takes energy and other costs as exogenous and may be used, for example, to predict market penetration of technologies for a given energy output demand under constraints. The detail of the bottom-up approach is most effective
at predicting interactions of similar technologies under certain conditions. The top-down approach sacrifices some detail with the aim of making energy demand and other
important inputs endogenous (McFarland, Reilly, and Herzog 2002). For example, electricity production may be modeled as a production function whose inputs include capital, labor, natural gas, coal, etc and whose output is electricity. Electricity is then used as an input for a variety of other production functions. Elasticities of substitution
allow for various levels of demand shifts between inputs, depending upon the ease of substitution. For example, if coal prices stay low while natural gas prices increase, the electricity sector will use more coal in its input stream and less natural gas which represents a relative increase in coal generating capacity. The advantages and
disadvantages of the two broad approaches are summarized in Table 5.
Table 5 -Advantages and Disadvantages of predictive approaches
Approach type Advantages Disadvantages
Top-down * Endogenous input prices * Use of many simplifying * Captures the dynamics assumptions
between sectors
Bottom-up * Engineering cost and * Exogenous input prices performance detail make it difficult to predict
long term behavior between heterogeneous sectors The analysis which follows makes use of MIT's EPPA model - a model which is fundamentally top down but with several key components, such as carbon capture
technologies, added in the bottom-up approach.
Standard EPPA
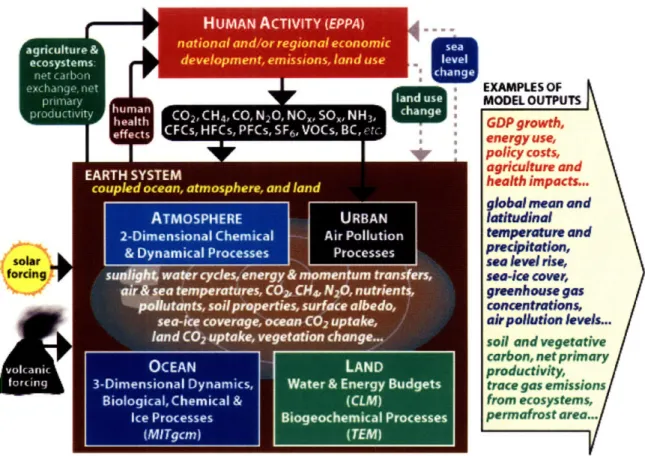
The MIT Emissions Prediction and Policy Analysis (EPPA) model is a recursive-dynamic multi-regional general equilibrium model of the world economy. EPPA may be
used independently to study greenhouse gas emissions and environmental policy. It is also part of MIT's Integrated Global Systems Model (IGSM) as shown in Figure 5.
Figure 5 -Integrated Global Systems Model (IGSM)
U.,
I s p r U s U U
- Icc r , e a
-u
e-HUMAN
ACTVITY (EPP
aqjulueý
atoaiad~rryin ileon f'
ecosstrens
evelpme t, e ossinslandtis
d
us
AI~~TMOSPHRE
RBA
Ice Processes BiUJ.O~heI~sT s Ps
Source: (Sokolov et al. 2005)
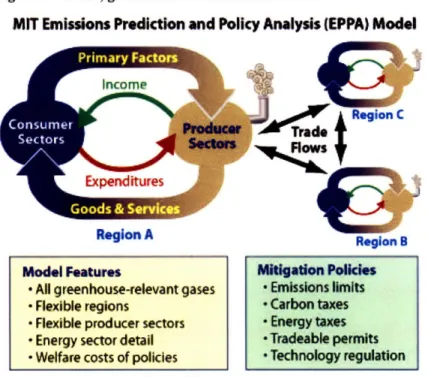
The EPPA model, which can be thought of as an integrated part of the IGSM model as indicated in Figure 1, may be operated independently of IGSM for the purposes
of a more focused and expedited economic and human emissions assessment tool. EPPA is a computable general equilibrium (CGE) model. CGE models represent the flow of trade, goods and services as indicated in Figure 6 below. In addition to the high level information shown in Figure 6 are the inter-industry transactions and
governmental flows both of which are important elements of CGE models.
EXAMPLES OF MODEL OUTPUTS GDP growth, energy use, polkcy costs, agriiulturme and health impacts...
=lobal mean and
attudinal
temperature and precipitation,
sea level rtse,
sea4ce cover,
greenhouse gas
concentrations,
air pollution evels..
soil and vegetative
carbon, net primary productivity,
trace gas emissions
from ecosystems,
permafrost area...
Figure 6 - Trade, good and service flows in EPPA
MIT Emissions Prediction and Policy Analysis (EPPA) Model
npEywrn 0 Region B
Source: (Paltsev et al. 2005)
The EPPA and IGSM models are described in detail in (Paltsev et al. 2005) and (Sokolov et al. 2005) respectively.
EPPA Modifications
For the purposes of analysis presented here, I use a modified version of the standard EPPA model described above. The modified version is called EPPA-ROIL (Choumert, Paltsev, and Reilly 2006) and it builds on EPPA's capability by representing the oil industry more comprehensively. The changes in EPPA-ROIL can be most easily
summarized by its three major modifications. Firstly, the ROIL sector in EPPA is disaggregated into multiple refined products. Secondly, the heavy fuel and refinery residue upgrading production functions are added. Thirdly, the major non-conventional
oil fields are integrated. In addition to the modifications in EPPA-ROIL, I introduce a carbon capture and storage (CCS) option in the oil sands production and upgrading sectors.
With the first modification -the disaggregation of the ROIL commodity, EPPA-ROIL can effectively capture the trend of heavier crude supply coupled with higher demand for lighter fuels. Such modifications facilitate a more realistic analysis of the upstream and downstream oil and gas sectors in Canada. These sectors and their effect
on the transportation sector together with the already well represented EPPA electricity sector are the most important industries affected by climate change policies in Canada.
Model Feature
* All greenhouse-relevant gases * Flexible regions
* Flexible producer sectors * Energy sector detail * Welfare costs of policies
Mitigation Policies * Emissions limits * Carbon taxes * Energy taxes * Tradeable permits * Technology regulation
The second addition by EPPA-ROIL is the expansion of the fuel choice for gasification from coal alone to heavy oil and coke and the addition of residue upgrading technology. These additions represent conversion technologies more rigorously and provide a more transparent window into the timing and location of different kinds of refining capacity.
The third addition by EPPA-ROIL is the integration of oil sands reserves in Canada and the heavy oil reserves in Venezuela. Given the magnitude and heavy quality of these crudes, the overall oil supply picture changes significantly with their inclusion into the model. In the standard EPPA oil sands are part of 'conventional oil' sector
-since we are focusing in on the oil sands, bitumen production and upgrading are vital sectors to have separated from conventional oil. As the addition of the bitumen sector to the model is fundamental to the analysis, I now discuss its implementation in more detail.
The Bitumen Sector
In order to add the bitumen sector to the EPPA model, we need to outline the sector's production functions and find the input and output share values for the production functions. For the EPPA implementation, two sectors were developed to represent the industry - bitumen production, whose output can substitute with heavy oil,
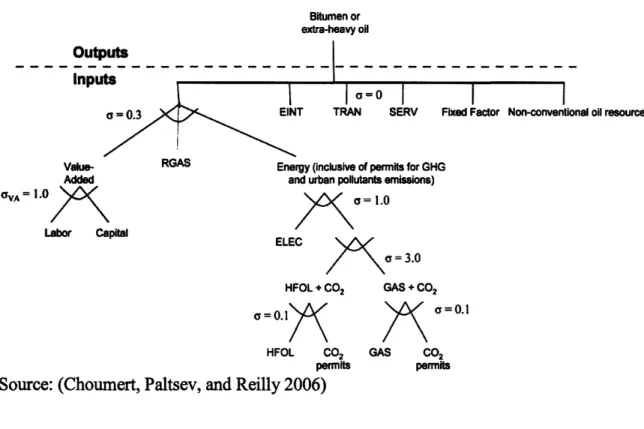
and bitumen upgrading whose input is the bitumen production output and whose output can substitute with conventional oil. The production functions which represent the two sectors are shown in Figure 7 and Figure 8.
Figure 7 - Bitumen production function Bitumen or extra-heavy oil Outputs Inni is II EIUwU a=0.3 EINT
RGAS "e IIi: and
I
=0
I
I
I
TRAN SERV Fixed Factor Non-conventional oil resource
y (inclusive of permits for GHG
urban pollutants emissions) 1
= 1.0
ELEC C
aj
o = 3.0
HFOL + CO2 GAS + CO,
= 0.1 ý
HFOL CO2
permits
Source: (Choumert, Paltsev, and Reilly 2006)
AW
a= 0.1GAS CO2
permits
Figure 8 - Bitumen upgrading production function
OIL HFOL COKE Synthetic Crude (Heavy Fuel Oil) Petroleum Coke
Outputs = 0.2
Inpu
0.5 EINT
S= 0.5 ! EINT
TRAN SER
TRAN SERV Bitumen or extra-heavy oil
Value-Added
OVA = 1.0 ^
Labor Capital
RGAS Energy (inclusive of permits for GHG and urban pollutants emissions)
>
o\
=
1.0
ELECXI
oa
= 3.0
HFOL + CO2 GAS + CO2 =0.1 = 0.1 HFOL CO2 GAS CO2 permits permits Source: (Choumert, Paltsev, and Reilly 2006)Value-Added 'vA = 1.0 Labor Capital · · · · I I
\
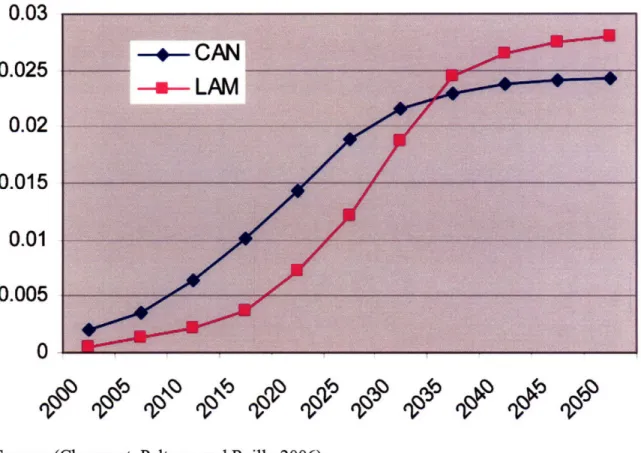
ilr•The fixed factor in Figure 7 is used to constrain the growth rate of bitumen production and represents the infrastructure and expertise constraints associated with the rapid growth of such capital intensive sectors. The fixed factor is originally set by estimating the future growth rate of the bitumen sector and fixing a curve to those estimates. Next, the fixed factor values which generate that desired growth rate are determined and used in the bitumen production function. The fixed factor values for Canada and Latin America (the other heavy oil producer affected by this fixed factor) are shown in blue and purple respectively in Figure 9.
Figure 9 - Fixed factor for Canadian and Latin American heavy oil production functions
U.U;
0.025
0.02
0.015
0.01
0.005
0
Source: (Choumert, Paltsev, and Reilly 2006)
One drawback of this fixed factor implementation is evident when demand for bitumen declines for awhile but then resumes at some future time. The previous representation does not account for the reduced production and associated loss in infrastructure and expertise and can lead to unrealistically sharp surges in production when demand for bitumen returns. To alleviate this problem, and to make the fixed factor endogenous by relating it to bitumen output, a method6, whereby the fixed factor is
reduced under certain conditions, is added to the model. The equations that follow are calculated every five years in the model to update the fixed factor for Canada7.
6 Note that for the following method there is a min fixed factor value of 2x10⁻³ and a maximum fixed factor
value of 2.57x10⁻². Also note that "Output" refers to bitumen production output and "FF" refers to fixed factor.
7 The same approach is used for Latin America.
If (Output)t >= (Output)t-1
FFt+ = -6x10 -5 x (Output)2 + 2.5x10⁻³ x (Output) +1.2x10 - 3
If (Output)t < (Output)t-1
FFt+1 = 0. 9 x FF
In this representation, the fixed factor is both dependent on the output level of the bitumen sector and depreciates if output declines. Coefficients for the growth case are regressed from the curve in Figure 9 and the depreciation coefficient is set at one third of
capital depreciation. Future work could investigate these coefficients further to estimate a more reliable relationship between sector output and growth.
Now that the production functions and fixed factor have been laid out, let us look at the cost structure for the oil sands in order to determine the production function shares. The cost structure for bitumen production and upgrading is laid out in Table 6 and Table
7. Since there are two methods used to produce bitumen, and they produce roughly equal barrels per year of product, the input shares are calculated by taking the average costs between them.
Table 6 - Cost Structure of Bitumen Production in Canada (USD/bbl)
Cost per
barrel of bitumen produced
Natural gas (mcf/bbl)
Natural gas ($/bbl)*
Non-gas OPEX ($/bbl)
Capital maintenance ($/bbl)
Total CAPEX excluding maintenance
($Bn)
Lifetime (years)
Capacity (bbd)
CAPEX ($/bbl)**
Transportation ($/bbl)
Total cost ($/bbl)
* With natural gas at $4/MMBtu. ** With a 10% capital charge rate.
Source: (Choumert, Paltsev, and Reilly 2006)
Mining/Extraction
0.27 1.114.5
0.375
1.3542
100,000
3.891.15
11.02SAGD
1.265.16
3.750.49
1.75 37 100,000 5.201.75
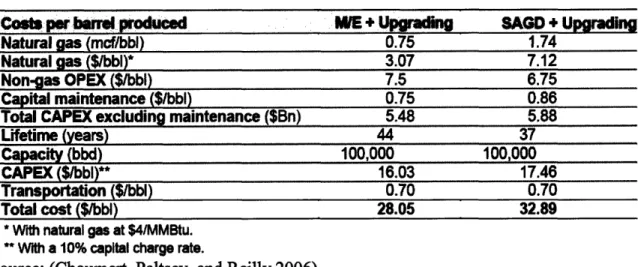
16.35 I"Table 7 - Cost Structure of Bitumen Upgrading in Canada (USD/bbl)
Costs per barl produced Natural gas (mcf/bbl) Natural gas ($/bbl)* Non-gas OPEX ($/bbl) Capital maintenance ($/bbl)
Total CAPEX excluding maintenance ($Bn) Lifetime (years)
Capacity (bbd)
CAPEX ($/bbl)** Transportation ($/bbl)
Total cost ($/bbl)
* With natural gas at $4/MMBtu.
** With a 10% capital charge rate.
Source: (Choumert, Paltsev, and Reilly 2006)
WE
+ Upgrading
0.75 3.07 7.5 0.75 5.48 44 100,000 16.03 0.70 28.05 SAGD + Upgrading 1.74 7.12 6.75 0.86 5.88 37 100,000 17.46 0.70 32.89After calculating the base shares from Table 6 and Table 7, the input shares are modified to make sure that they are consistent with the CO2 emission data in each process
and account for transportation outside the production region. In the case of Canada, 60kg of CO2 per bbl is used for production (an average of emissions from the two production
processes) and 100kg of CO2 per bbl is used for upgrading. HFOL and RGAS outputs are
calibrated to make sure that the emissions and gas input shares are consistent. For bitumen upgrading, 90% efficiency is assumed for upgrading in the production region (representing the integration of production and upgrading processes) and 85% for upgrading outside the region. To account for transportation cost differences between countries, markups are included. Thus Canada and Latin America can export their heavy oil product to any of the countries in Table 8 but only at extra cost. For instance, if Canada sends produced bitumen to China to be upgraded there, the final costs are $24.19 per bbl of synthetic crude versus $21.80 in Canada - thus transportation costs amount to $2.39 per bbl.
Table 8 - Markups to account for transportation costs
USA CAN
JPN FSU
ASI CHN IND
LAM
1.25
1.08
1.30
1.30 1.30
1.30
1.35
1.05
Source: (Choumert, Paltsev, and Reilly 2006)
The final aspect necessary to implement the bitumen sectors is output values. To get the physical shares, data from the TOTAL Sincor project was used. For a 200 kbd8 extra heavy oil stream of input, about 180kbd of synthetic crude output (or 30500 toe/day) and 5900t/d of coke output (or 4350 toe/day) result. The Sincor project uses a coker and so does not produce heavy oil. However, some upgraders also make use of
8
kbd: thousand barrels per day, toe: ton of oil equivilient and t/d: tons per day
--I
-" I
hydro cracking (though the majority of planned upgraders use cokers). Accounting for the hydro cracking yields final output shares of 87% synthetic oil, 10% coke and 3% heavy oil from upgrading bitumen. To get the final value flows, these physical flows are
multiplied by their refined product prices.
The addition of bitumen production and upgrading is an important feature of the modified EPPA model. The new sector lets us gain important insights into the effects of carbon caps on Canada's petroleum industry. For this carbon-intense industry to remain competitive, technologies, such as carbon capture and sequestration, may be important.
Bitumen CCS
The following section outlines the process that I used to add bitumen production and upgrading sectors with carbon capture and sequestration (CCS) - a technology that could prove fateful for the oil sands industry to continue operating in an environment of increasing carbon costs.
The addition of bitumen CCS was the result of research aiming at deploying non-power sector CCS technology to the EPPA model. According to the IPCC special report on CCS (The Intergovernmental Panel on Climate Change 2005) "CO2 capture for
industrial uses has not been widely studied" where "industrial" refers to energy intensive processes such as cement and steel production. Thus, using engineering data from power sector CCS may not be applicable to some non-power sector applications. However, some industrial applications, such as bitumen production and upgrading, use a significant amount of energy for the generation of steam in their processing. Furthermore, in the modifications to EPPA, fuels are disaggregated roughly into those which are combusted (natural gas and heavy oil) for energy and those used in chemical processing (lighter refinery gases and the bitumen resource). Therefore, when using CCS in the bitumen sector, we can apply it to those fuels which are combusted and form an exhaust stream as that process is similar to power sector applications.
The MIT Coal study (Ansolabehere et al. 2007) provides several cost assessments of various CCS technologies for the power sector. Pulverized coal (PC) plants represent a good source to understand the costs of flue gas capture as an 'add on' as opposed to other technologies, such as Integrated Gasification Combined Cycle (IGCC) with capture where the CO2 can be extracted from more CO2-concentrated streams depending on the
arrangement. The data we have for PC plant CCS is per unit of electricity produced but we need an estimate of the cost per unit of CO2 captured. To do this, the first step is to
estimate the $/ton of CO2 sequestered cost of adding flue gas capture to your plant in
terms of fuel, capital and labor.
The MIT study reports that a PC plant without CCS emits 830 g/kW-hr of CO2
and a plant with CCS emits 109 g/kW-hr. Dividing the difference between (w/o CCS) and the (w/ CCS) costs with the difference in (w/o CCS) and the (w/ CCS) emissions leads to the total cost per ton of CO2 sequestered.
A$ / kW - hr[withCCS - withoutCCS]
tA t,•Or / kW - h•r[,,ithtqCC'• - ,,,hCCS
Table 9 - Pulverized Coal Capture Cost Data
w/o CCS w/ CCS Difference
(cents/kW-hr) (cents/kW-hr) (cents/kW-hr) cents/kg $/ton CO2
Capital 2.70 4.34 1.64 2.27 22.75
Labor 1.33 1.75 0.42 0.58 5.83 Fuel 0.75 1.60 0.85 1.18 11.79
Based on this assessment, the total cost of adding a flue gas CO2 capture unit to a
pulverized coal plant amount to $40.36 per ton of CO2 sequestered.
The next step is to determine the input value per ton of CO2 for the sector to
which the flue gas capture technology is to be applied. This is accomplished by dividing the $ per boe9 produced (of inputs) by the kg of CO2 per boe (see Table 10). Table 11,
which comes from the Choumert study, contains the relative value shares of the bitumen production and upgrading inputs.
Table 10 -Value of bitumen inputs per ton of CO2 emitted, aggregated
Bitumen Production Bitumen Upgrading
Kg CO2 / boe 55 85
$ / boe produced 10 19
$ / ton CO2 181.82 223.53
Table 11 -Input Shares for bitumen production and upgrading
INPUT SHARE DATA
utiB men Pr >duction
0.1 0.216 0.018 0.005 0.014 0.286 0.209 0.035 0.015 0.092 0 0.01 Bitumen Uoaradina BITUM GAS RGAS HFOL ELEC K L EINT SERV TRAN S02
9 boe = barrels of oil equivalent. It is an energy measure and in the case of bitumen includes coke, heavy oil and synthetic crude.
NOIL GAS RGAS HFOL ELEC K L EINT SERV TRAN S02 FF 0.439 0.127 0.008 0.029 0.007 0.287 0.048 0.033 0.004 0.018 0
With the $ / ton of CO2 defined for the bitumen production and upgrading sector,
the next step is to disaggregate the capital, labor and fuel shares of the $ / ton of CO2
values. This amounts to answering the question - what portion of the $181.82 / ton of CO2 of bitumen production inputs comes from capital, labor and fuel. The values for fuel
should be those energy inputs which are used for energy production (for bitumen this includes GAS and HFOL) rather than those which end up in the output stream (for bitumen this includes RGAS and NCOIL) since the capture technology is applied only to
the flue gas. Multiplying the fraction of capital, labor and fuel (Table 11) by the total $ value of inputs / ton of CO2 (Table 10) yields the values below (see column 2 in Table
12).
Table 12 - Capital, labor and fuel inputs for production and carbon capture and sequestration ($/ton C02).
Bitumen Mark-up for CCS
Production Production CCS Total (Total/Production)
Capital 52.00 22.75 74.75 1.44 Labor 38.00 5.83 43.83 1.15 Fuel 40.18 11.79 51.97 1.29 Bitumen Upgrading Capital 64.15 22.75 86.90 1.35 Labor 10.73 5.83 16.55 1.54 Fuel 34.87 11.79 46.66 1.34
To clarify, row 2, column 2 in Table 12 can be read "for every ton of CO2 in the
bitumen production process, there is 52 dollars of capital input." In order to apply the capture technology outlined in Table 9, we must add to the costs of the CCS technology to each input - for example, the value of the capital input for bitumen production with CCS is now $52.00 (base technology) + $22.75 (CCS) = $74.75 giving a capital markup of $74.75 / $52.00 or 1.44. The markup is applied to the base technology in order to model the costs of a CCS version of that technology.
By representing several broad categories of refined products, adding explicit technologies to the oil sectors, including the effect of a changing crude mix on the
refining industry and adding bitumen CCS technology, the EPPA modifications provide a more accurate picture of the oil and transportation industries than standard EPPA and
allow for a better analysis of climate and environmental policy impacts on these sectors. The top-down assessment of energy policy in Canada, a country with significant energy industries, is enhanced by the greater detail captured by these EPPA modifications. Using this model, policies may be tested and the effects analyzed to better understand the economic impacts of greenhouse gas regulation on Canada. Let us now turn to the details of the regulations under consideration.
Scenarios
The modified EPPA model provides insights into the market and welfare impacts arising from Canadian regulation. Assessing the economic costs of a policy does not account for the potential impacts associated with climate change. Typically
environmental economics seeks to balance marginal costs and marginal benefits of a policy. That is complicated in the case of climate change because Canada's mitigation actions, by themselves, have little effect on the trajectory of climate change. I thus restrict myself to estimating welfare costs and environmental implications of mitigation policies. The 'core' policies used in the assessment are now set out.
Three scenarios will make up the core of the EPPA-ROIL analysis. Three Canadian policy scenarios, of different GHG control severity, are matched with the 'weak' international policy outlined below. Time horizon for the analysis goes from 2005 through to 2050.
Canadian Policy
Although Canada signed the Kyoto Protocol, a treaty which was to come into force in 2005, and ratified it in December 2002, no substantive legislative initiatives were taken until the federal government introduced bill C-30, known as the "Clean Air Act", on the 19th of October, 2006. The act set out the government's intention to develop and
implement a number of regulations under CEPA (Canadian Environmental Protection Act) to address air pollutants and GHGs by means of the amendments in Bill C-30. According to the first readings, strict limits on GHGs would not be in place until 2020 or 2025 and emission regulations on large final emitters would not take effect until 2010.
The original draft of the bill was rejected by all opposition parties and hence not approved since the conservative government held only a minority government. The bill was then referred to the legislative committee before the second reading. The amended C-30 bill focused on stricter controls in line with the Kyoto Protocol (Kyoto wasn't mentioned in the first reading). The amended bill C-30 is now no longer pursued by the government which is, instead, moving to regulate greenhouse gas emissions under CEPA (Canadian Environmental Protection Act).
The current Conservative minority government is instead proposing a new plan which is outlined in the document 'EcoAction: Action on Climate Change and Air Pollution' (Environment Canada 2007). The plan calls for emission intensity reductions
of 6% in 2008, 2009 and 2010 -summing to 18% by 2010. Subsequent years aim for further 2% annual reductions. Finally, two goals are set for 2020 at 20% absolute reductions from 2006 emissions and 2050 at 50% absolute reductions from 2006
emissions. While this plan will likely be implemented if the conservative government retains its position, an election in a Canadian minority government can happen at almost
any moment. If the conservative party loses the next election, it is likely that the official opposition will put forward their own climate-change plan.
The other major Canadian political party is the Liberal party and they have proposed their own GHG reduction plan called 'Balancing our Carbon Budget' (Liberal Party of Canada 2007). The plan, unlike the conservative plan, aims to meet Kyoto
commitments by aiming for a 6% reduction in absolute emissions from 2008-2012. The plan provides 'free' permits to each sector based on absolute reductions from 1990 levels
(Table 13). Additional emissions beyond the 'free' permits will require the polluter to pay $20-$3010 per ton of CO2 to a 'Green Investment Account' which is used for
investments in low-emission technologies. It is very difficult to predict how the plan will operate post 2013 - the only information we have is (a) the carbon tax will not go below $30 / ton of CO2 and (b) the 'carbon budget' goals change as indicated by Table 13
(under the 'Kyoto and Beyond' section).
Table 13 - Major Canadian Party Proposals and Discussions for GHG regulation
Year Conservative 'Climate Action Plan' 'Kyoto and Beyond' 2010 18% reduction in emission intensity 1990 emissions less 6%
from 2006 levels
2020 2006 emissions minus 20% 1990 emissions minus 20%
2035 1990 emissions minus 35%
2050 2006 emissions minus 50% 1990 emissions minus 60%
With the main parameters of the climate change plans before us, I now discuss how the plans will be treated for the purposes of this analysis. In implementing this
analysis, it should be noted that there remains significant regulatory uncertainty for the years after 2010. Rather than guess at the carbon price or how many allowances each plan will provide after 2010, the analysis will simply use the stated goals of each plan11.
For the 'Climate Action Plan' analysis, I apply emission intensity constraints equal to 18% in 2010, absolute constraints of 20% below 2006 levels for 2020 and 50% below 2006 levels for 205012. For the 'Carbon Budget Plan' analysis, I apply the goal to meet Kyoto targets of 1990 emissions minus 6% by 2010, and then the plan's stated 'budget'
goals of 1990 emissions minus 20% target by 2020, 1990 emissions minus 35% by 2035 and 1990 emissions minus 60%13 for 2050. In order to translate the emission targets into a continuous policy for those years where the emission goals are undefined, I interpolate linearly'4 between years with clearer targets. From this point forward, I will refer to the
10 $20 in 2008, $25 from 2009-2010 and $30 from 2011-2012
11 This is likely a departure from what the plan would actually look like. Implicit in the 'Carbon Budget' plan is the idea that the budget will not be met - hence the carbon tax on emissions beyond the budget. However, political positions of three of four major Canadian parties (including the party who put out the
'Carbon Budget' plan) continue to call for meeting Kyoto targets. Whatever the disconnect may be between 'the carbon budget' plan and the assertions to meet Kyoto, this analysis will focus on costlier goal of meeting, and not exceeding, the carbon budget and Kyoto goals.
1
2 An important caveat is the implementation uncertainty of these various constraints. The short-term emission intensity reductions are very likely to be implemented whereas the long-term absolute reductions are stated as "goals" which are predicted to come about from a combination of policy levers.
'3 60% is at the lowest end of the stated goal for 2050
conservative goals as the 'Climate Action Plan' (CAP) and the Liberal goals as 'Kyoto and Beyond1 5' (KAB).
While I am attempting to analyze how these specific plans would impact the economy, the more important1 6 result is the general understanding of how various degrees of climate change policy might impact the Canadian economy. With the two Canadian-policy plans defined, I now consider international policy.
International Policy
The Canadian regulations will be analyzed on the backdrop of two very different international GHG policy paths. The two paths include one 'strict' regime and one
'weak' 17 regime (the 'weak' policy is used in the core analysis, the 'strict' policy is used
in the sensitivity analysis). The purpose of the two paths is to gain insight into how international climate policy might affect Canada's economy when Canada undertakes its own climate policy.
For the 'strict' case, the whole world, other than Canada, pursue Kyoto-like policies (starting in 2010 for USA, Europe, Australia, New Zealand and Japan and in 2020 for the remaining countries) where restrictions on carbon emissions grow steadily to approximately 50%, or half, of 1997 levels by 2050. For the 'weak' case, restrictions reach approximately double 1997 levels by 2050 and only the USA, Europe, Australia, New Zealand and Japan engage in the policy. For more details on the 'strict' and 'weak' policies, you may refer to the 450ppm and 750ppm scenarios (Paltsev et al. 2007) from which these two policies are derived. Except for the later application of the constraints in both international policies (2010 for USA, Japan, Europe, Australia and New Zealand and 2020 for the remaining regions) and the exclusive participation in CO2 policy of
USA, Japan, Europe, Australia and New Zealand in the 'weak' case, the 'strict' and 'weak' policies correspond to the 450ppm and 750ppm stabilization cases respectively for all'8 countries except Canada. Table 14 through Table 16 present the emission targets
for each region in both the 'weak' and 'strict' case.
15 As opposed to the 'Carbon Budget Plan' - I believe 'Kyoto and Beyond' is more in tune with the stated goals of the three opposition parties than the 'Carbon Budget Plan.' Also, details for the 'Carbon Budget Plan' are too few to predict the policy for the post-2012 period.
16 More important due to the host of market, regulatory and technology assumptions necessary for such an
analysis.
17 'strict' and 'weak' are met only to ease in distinguishing between the international policies used in the analysis. They should not be interpreted as normative.
18 Note that for the 'weak' case the only countries involved in the 750ppm policy include the USA, Europe,