Cooperation and spatial self-organization
determine rate and efficiency of particulate
organic matter degradation in marine bacteria
The MIT Faculty has made this article openly available.
Please share
how this access benefits you. Your story matters.
Citation
Ebrahimi, Ali, Julia Schwartzman, and Otto X. Cordero. "Cooperation
and spatial self-organization determine rate and efficiency of
particulate organic matter degradation in marine bacteria."
Proceedings of the National Academy of Sciences of the United
States of America, 116, 46 (November 2019): 23309-23316. © The
Author(s).
As Published
http://dx.doi.org/10.1073/pnas.1908512116
Publisher
Proceedings of the National Academy of Sciences
Version
Final published version
Citable link
https://hdl.handle.net/1721.1/125634
Terms of Use
Article is made available in accordance with the publisher's
policy and may be subject to US copyright law. Please refer to the
publisher's site for terms of use.
Cooperation and spatial self-organization determine
rate and efficiency of particulate organic matter
degradation in marine bacteria
Ali Ebrahimia,1, Julia Schwartzmana,1, and Otto X. Corderoa,2
aRalph M. Parsons Laboratory for Environmental Science and Engineering, Department of Civil and Environmental Engineering, Massachusetts Institute of
Technology, Cambridge, MA 02139
Edited by Steven E. Lindow, University of California, Berkeley, CA, and approved October 4, 2019 (received for review June 3, 2019)
The recycling of particulate organic matter (POM) by microbes is a key part of the global carbon cycle. This process is mediated by the extracellular hydrolysis of polysaccharides, which can trigger social behaviors in bacteria resulting from the production of public goods. Despite the potential importance of public good-mediated interac-tions, their relevance in the environment remains unclear. In this study, we developed a computational and experimental model system to address this challenge and studied how the POM depolymerization rate and its uptake efficiency (2 main ecosystem function parameters) depended on social interactions and spatial self-organization on particle surfaces. We found an emergent trade-off between rate and efficiency resulting from the competition between oligosaccharide diffusion and cellular uptake, with low rate and high efficiency being achieved through cell-to-cell co-operation between degraders. Bacteria cooperated by aggregating in cell clusters of∼10 to 20 μm, in which cells were able to share public goods. This phenomenon, which was independent of any explicit group-level regulation, led to the emergence of critical cell concentrations below which degradation did not occur, despite all resources being available in excess. In contrast, when particles were labile and turnover rates were high, aggregation promoted compe-tition and decreased the efficiency of carbon use. Our study shows how social interactions and cell aggregation determine the rate and efficiency of particulate carbon turnover in environmentally relevant scenarios.
microbial cooperation
|
self-organization|
marine microbes|
particulateorganic matter
|
public goodsT
he microbial breakdown of complex polysaccharides is a key ecosystem process that enables the recycling of carbon from plant and animal detritus into global biogeochemical cycles. Polysaccharide breakdown by heterotrophic microbes is a relevant process in all ecosystems, from animal guts (1–3) to soils (4, 5) and oceans (6–8), allowing the deconstruction of complex forms of organic matter. In aquatic environments, many of these polysac-charides are packed inside particles∼10 to 1,000 μm in diameter, and are accessible only to microbes that interact with the particle surface and secrete hydrolytic enzymes (9, 10). Particulate organic matter (POM) provides a scaffold for cells to attach to and grow in close proximity, increasing the opportunity for microbial interac-tions to take place (11). A particularly relevant type of interaction in this context is cell–cell cooperation, in which cells mutually benefit from being close to each other by increasing the availability of public goods such as extracellular hydrolysis products (12–14). Although numerous studies have demonstrated that this type of interaction can occur both in the laboratory and in nature, we lack a quantitative understanding of the conditions in which cooperation takes place in an environment such as the ocean, and how it can affect bacterially mediated functions such as the turnover of POM. In this article, we ask how physiological and environmental pa-rameters create the conditions for cell–cell cooperation to take place during the hydrolysis of polysaccharide particles, and we quantify the effect of this social behavior on the turnover of POM.The extent to which social interactions mediated by public goods change the functioning of polysaccharide-degrading mi-crobial populations should be highly dependent on how public goods diffuse (15, 16). In a 3D aqueous environment such as the ocean, if cells are too far apart, only a minuscule fraction of the public goods are recovered by neighbors, while the rest is lost to the environment. In contrast, if cells are sufficiently proximal to each other and the resource is limiting, growth kinetics can be cooperative, meaning that the per capita growth rate is positively dependent on the density of degrader cells (14, 17). This logic suggests that cooperation could be accompanied by the emer-gence of spatial patterns, such as cell patches (13). If the co-operative effects in these patches are strong, critical population density thresholds might emerge below which degradation can-not support population growth (12, 13, 17, 18). Less clear is the contribution of individual cell behaviors, such as surface attach-ment, chemotaxis, and biofilm formation, on the ability of cells to find those critical densities by aggregating into cell patches. To begin to understand the role of social interactions in natural sys-tems, we need to take into account the physical constraints of the microenvironment and how populations interact with these con-straints through their behaviors.
Significance
Microorganisms can cooperate by secreting public goods that benefit local neighbors; however, the conditions that favor cooperative growth in the environment, and the way in which this growth alters microbes’ contribution to ecosystem func-tions, remain unexplored. Here, we show that cooperation mediates the degradation of polysaccharide particles recalci-trant to hydrolysis in aquatic environments. Combining ex-periments and models, we define the physiological and environmental parameters that mediate the transition from cooperation to competition. Cooperation emerges through the self-organization of cells into∼10- to 20-μm clusters that enable uptake of diffusible hydrolysis products. When cooperation is required, the degradation of recalcitrant biopolymers can only take place when degraders exceed a critical cell concentration, underscoring the importance of microbial interactions for ecosystem function.
Author contributions: A.E., J.S., and O.X.C. designed research; A.E. and J.S. performed research; A.E., J.S., and O.X.C. analyzed data; and A.E., J.S., and O.X.C. wrote the paper. The authors declare no competing interest.
This article is a PNAS Direct Submission.
This open access article is distributed underCreative Commons Attribution-NonCommercial-NoDerivatives License 4.0 (CC BY-NC-ND).
1A.E. and J.S. contributed equally to this work.
2To whom correspondence may be addressed. Email: ottox@mit.edu.
This article contains supporting information online atwww.pnas.org/lookup/suppl/doi:10. 1073/pnas.1908512116/-/DCSupplemental.
First published October 30, 2019.
MIC
To quantify the potential contribution of bacterial social in-teractions and spatial behavior on relevant ecosystem processes, we focused on 2 main parameters: the speed at which polymers are hydrolyzed and converted to soluble oligosaccharides, that is, the turnover rate (19, 20), and the uptake efficiency, which is the fraction of the dissolved oligosaccharide that can be taken up by cells and converted into biomass. To study the conditions that favor cooperative interactions, as well as their impact on these two functional parameters, we developed a computational and experimental model of the colonization of insoluble particulate polysaccharides by marine heterotrophic bacteria. The individual-based model (21, 22) simulates the functional traits of cells: che-motactic movement (23), particle attachment and detachment (24), the secretion and activity of enzymes (25), oligosaccharide uptake, and growth (26). The experimental system validates computational predictions in a chitin-degrading bacterial strain isolated from the coastal ocean, and clarifies the role of physio-logical parameters on social interactions. We leveraged the com-putational model to identify the physical and physiological parameters that favor the emergence of cooperative growth, and we tested some of our predictions, using our experimental model of chitin colonization. Our work demonstrates that cell–cell co-operation is critical for the degradation of complex biomaterials, implying that the degradation of recalcitrant polysaccharides can be bacteria-limited. Moreover, cell-density thresholds that de-termine the onset of cooperative growth depend strongly on individual-cell behavior, and in particular those behaviors that regulate the residence time of bacteria on particles.
Results
We modeled the dynamics of cell colonization, enzyme secretion, and growth (Fig. 1A), using an individual-based model to describe cells coupled to a reaction-diffusion framework to describe en-zymes and oligosaccharides. In the model, bacterial cells that at-tached to the surface of a polysaccharide particle broadcast enzymes that reacted with the surface of the particle, releasing oligosaccharides to which nonattached cells could chemotax. Cellular uptake of oligosaccharides followed Monod kinetics (26), and cells were allowed to divide after a certain quota of oligo-saccharide was consumed (22) (seeMethods andSI Appendixfor a detailed description andSI Appendix, Table S1for the parame-ters). This individual-based approach allowed us to modulate traits such as chemotaxis or particle-attachment rate, and to measure their impact on the carbon uptake rate on a cell-by-cell basis.
A crucial parameter of our model was the particle lability,Kp,
which defined how many grams of oligosaccharide were released per gram of enzyme acting on the polysaccharide surface per unit of time.Kpwas a compound parameter that resulted from the
product of the catalytic activity of the polysaccharide-degrading enzyme, kcat, and the recalcitrance of the substrate. This
pa-rameter played a central role because it determined the maxi-mum degradation rate and controlled the supply rate of carbon, the sole limiting resource, to the bacteria. A survey of hydrolysis rate values reported in the literature revealed that the particle lability,Kp, can exhibit significant variation across natural
envi-ronments and microbial enzymes.Kpvaried by more than 6
or-ders of magnitude within glycosyl hydrolase families, a trend that held true among different substrate types such as chitin, alginate,
10000
5000
1
1
0
0
0
0
0
0
B
K
EK
SDOM
POM
E
K
P POM DOM Enzyme(E)Particle lability
Kp, hr
-110
010
110
210
310
4No growth
0
0.05
0.1
0.15
0.2
A
B
C
Particle lability
K
p, hr
-1Initial cell
number:
Chitin Alginate Starch
POM uptake ef
ficiency (-)
10
510
410
310
210
110
010
-110
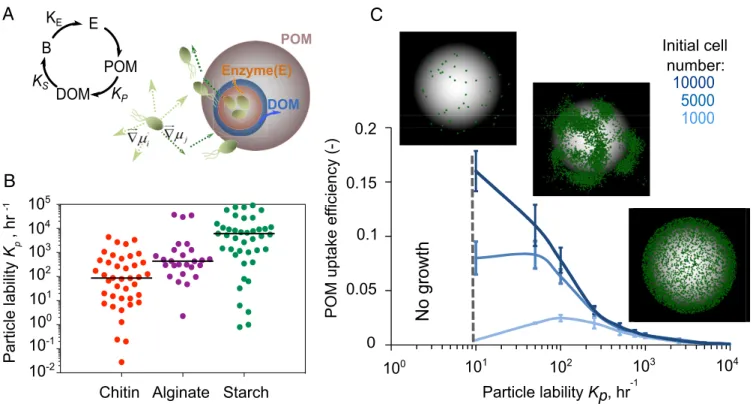
-2Fig. 1. POM uptake efficiency is regulated by an emergent rate-yield trade-off. (A) A schematic representation of individual-based modeling of microbial
dispersal and colonization on the particle is shown on the left. A conceptual representation of the relation between the rate (KE) of enzyme secretion by
bacterial cells, the rate (Kp) at which polysaccharide substrates (POM) are broken down to oligosaccharides (DOM) by enzymes, and the uptake of
oligo-saccharides by bacterial cells with half saturation (Ks) is shown at right. (B) The distribution range of particle lability (Kp) from natural polymeric carbohydrates
(chitin, alginate, starch). The data are for various bacterial species with their corresponding abiotic conditions (species name, substrates, and environmental
conditions are represented inSI Appendix, Table S2; data are from the Brenda database:https://www.brenda-enzymes.org/). The solid line indicates the mean
value of Kp. (C) POM uptake efficiency as a function of particle lability and initial population size. Dashed line indicates the no-growth zone. Microbial
population assembly on the particle with 3 initial cell densities of 1,000, 5,000, and 10,000 cells are shown. Green dots show individual cells on the particle.
Simulations are performed for a range of initial cell densities, and 1% detachment is allowed. Half saturation, Ksis assumed 0.1 mg/L.
and starch (Fig. 1B). This led us to ask how variation in particle lability, Kp, affected population growth dynamics and the
re-lationship between the rate of POM depolymerization and the uptake efficiency of released oligosaccharides.
Our results revealed that among particle-associated bacteria, the rates of depolymerization (represented by particle lability) were negatively dependent on POM uptake efficiency (Fig. 1C) (27, 28). This emergent rate/efficiency trade-off was a conse-quence of the diffusion of oligosaccharide in a 3D environment where soluble products that were not taken up by cells in the vicinity of the particle were lost. At high values ofKp,
oligosac-charides were produced in excess of Ks, the half-saturation
constant of the Monod growth function, and therefore cells approached their maximum growth rate. However, highKpalso
led∼99% of hydrolyzed oligosaccharide to be lost to diffusion (∼1% recovery), which reduced the theoretical biomass yield of the population and the POM uptake efficiency. For comparison, if the system was closed, as in a laboratory reactor, POM uptake efficiency could theoretically reach 100% because dissolved oli-gosaccharides would accumulate (SI Appendix, Fig. S1).
Natural environments are rarely, if ever, closed systems. Using parameters based on field measurements, our simulation supports the idea that diffusive losses are likely to limit POM uptake effi-ciency in the ocean (SI Appendix, Table S3). Even at the highest particle colonization densities reported from field studies, the maximum POM uptake efficiency should not exceed ∼7% according to our simulations (SI Appendix, Table S3). This number goes down to 2% if we take into account the fact that particles sink, creating a convective flow that washes away soluble oligo-saccharides (29–31) (seeSI Appendix, Figs. S2–S5for simulation results with flow). Although the exact value of POM uptake effi-ciency depends on biological parameters such as substrate affinity (1/Ks;SI Appendix, Fig. S6), our data show that in open
environ-ments, uptake efficiency is extremely low, implying that most POM is turned into dissolved organic matter (DOM), rather than biomass. Moreover, depolymerization rate and uptake efficiency are bound to be anticorrelated due to the limited capacity of cells to take up diffusible oligosaccharides.
Surprisingly, we found that the high POM uptake efficiency observed at lowKp (recalcitrant particles or low enzymatic
ac-tivity per cell) was mediated by the aggregation of cells into microscale patches on the particle surface, a phenomenon that
was not hardcoded in the model but emerged from the interplay among diffusion, cell behavior, and growth (Fig. 1C andSI Ap-pendix, Fig. S7). Within these patches, cells grew cooperatively by sharing oligosaccharides that would otherwise be lost to diffu-sion, which increased the per capita growth rate and POM up-take efficiency up to a density of 0.3 cells/μm2
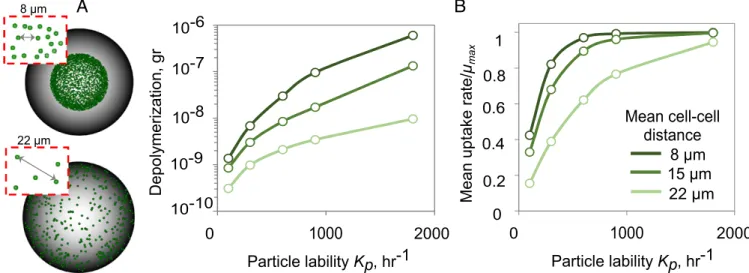
(SI Appendix, Figs. S8 and S9). To characterize the spatial-density dependence, we performed simulations to quantify particle depolymerization and mean growth rates as a function of the intercell distance (Fig. 2A). Our analysis showed that dense spacing (a nearest neighbor dis-tance of 8μm among 1-μm cells) promoted cooperation by sharing of oligosaccharides, but only when particles were recalcitrant and the oligosaccharide production rate was slow (Kp< 100 h−1; Fig.
2B). More precisely, when the amount of oligosaccharide available to cells fell nearKs, the half-saturation of the Monod growth curve,
an increase in the local concentration of oligosaccharide because of cell–cell aggregation, increased the per capita growth rate. In contrast, at high Kp(∼2,000 h−1), oligosaccharides quickly
accu-mulated, and the uptake rate was decoupled from the spatial or-ganization of the cells on the particle, as there were enough resources for cells to grow at their maximal rate ([C]>>Ks; Fig.
2B). Under these conditions, there was no benefit to aggregation, and even cells spaced more than 20 cell lengths apart reached their maximum oligosaccharide uptake rate (Fig. 2B).
In our model, cell detachment and reattachment from the particle surface was a critical behavior that enabled the forma-tion of patches and the degradaforma-tion of recalcitrant particles. On recalcitrant particles (Kp= 10–100 h−1), 1% detachment
signif-icantly increased the particle degradation rate and its uptake efficiency (Fig. 3A) and also increased the mean carbon uptake rate by a factor of∼5 (SI Appendix, Fig. S9A) compared with a nondetaching population. Detachment allowed populations to survive on recalcitrant particles that might otherwise not sustain growth (SI Appendix, Fig. S9B). Without chemotaxis, random motility alone still allowed detaching populations to grow on more recalcitrant particles than nondetaching populations, but at ∼1/6 the maximum POM uptake efficiency (Fig. 3A) and ∼1/10 the total biomass accumulation (SI Appendix, Fig. S9B). With chemotactic motility, most cells had access to the same con-centration of hydrolysis products emanating from cell patches; the distribution of carbon uptake rates for individual cells dis-played a tight peak near the maximum uptake rate (μ∼0.8μmax;
Mean cell-cell
distance
8 μm
15 μm
22 μm
10-9
10-8
10-7
1000
2000
Depolymerization, gr
0
0.2
0.4
0.6
0.8
1
A
B
0
Particle lability
Kp, hr-1
Mean uptake rate/
μ
max1000
2000
0
Particle lability
Kp, hr-1
8 μm 22 μm10-10
10-6
Fig. 2. Patch formation on particle surface enhances the rates of polysaccharide depolymerization and breakdown product uptake. (A) The cell spatial
distribution on particles for scenarios with 8- and 22-μm mean cell distances are shown. (B) Total amount of depolymerization and mean uptake rate for a range
of mean cell–cell distance are represented as a function of particle lability after 10 h from start of the simulation. The simulations are initialized by placing
1,000 individual cells uniformly on the particle at the indicated mean cell–cell distance between neighboring cells. No detachment is allowed in simulations.
MIC
SI Appendix, Fig. S9C). Our model thus suggests that detachment and chemotaxis enhance POM uptake efficiency under nutrient-limited conditions ([C]∼ Ks) by enabling the formation of
patches where cells cooperate by sharing public goods.
This analysis implies that the onset of cooperation is de-pendent on the physiology of individual bacterial strains. Strains that had either a high affinity for oligosaccharides (lowKs) or a
high hydrolytic activity (highKp) saturated their growth at low
cell densities (Fig. 3B and C), circumventing the need to co-operate through patch formation (Fig. 3D). In contrast, strains with a low uptake affinity for the public good or strains with a low per cell rate of hydrolysis (lowKp), such as those that tether
enzymes to their membrane, benefitted more from cooperation with other cells and formed patches in the simulation (Fig. 3D). Therefore, cell–cell cooperation emerged during POM break-down when the polymers were hard to degrade, either because of low hydrolytic power or poor uptake affinity. Traits such as motility, surface detachment frequency, oligosaccharide affinity, and enzyme localization determined the exact cell density thresh-old required for particle degradation in a given environment.
To experimentally validate our prediction that cell–cell co-operation drives the degradation of hard-to-degrade polysaccha-rides, we turned our attention toPsychromonas sp., psych6C06, a marine isolate that had previously been enriched from coastal seawater on model chitin particles (10). The strain readily de-grades chitin hydrogel with a half-life of∼30 h (20) and encodes at least 8 predicted chitinases, or glycosyl hydrolase family 18 and 19 homologs, but no other families of glycosyl hydrolases, leading us to conclude that the strain is representative of a chitin spe-cialist. We reasoned that if cooperative growth kinetics played a role in this system, we would observe a strong dependency be-tween the initial number of cells that colonized the particle and the growth of the population. In particular, we would expect a critical cell density below which the population was unable to form the patches required to degrade particles, revealing that the deg-radation process was bacteria-limited.
In agreement with this prediction,psych6C06 displayed a strong density dependence when growing on hydrogel chitin particles in the form of a critical cell density below which the particles were not persistently colonized (Fig. 4A). At concentrations just below the threshold critical cell density, we observed the formation of
Kp= 40
Oligomers concentration
exprienced by cell, mg/L
Mean uptake rate/
μ max
0.5
0
0.1
1% detachmentPOM uptake ef
ficiency
10
010
110
210
310
40.3
0.2
Random walk No detachment Chemotaxis Ks=1mg/L10
-310
-210
-110
010
10
1
Ks=0.1mg/L Ks=0.1mg/L Ks=1mg/LFold change in biomass
0
1
2
3
4
0.25
0
0.5
0.75
1
Bacterial density μm
-2 Strong coop. Weak coop.10
- 310
- 210
- 110
010
10.25
0
0.5
0.75
1
C
D
A
B
Particle lability
K
p, hr
-1 Particle lability Kp, hr-1 ExtinctionBacterial density μm
-2 Kp= 400Oligomers concentration
exprienced by cell, mg/L
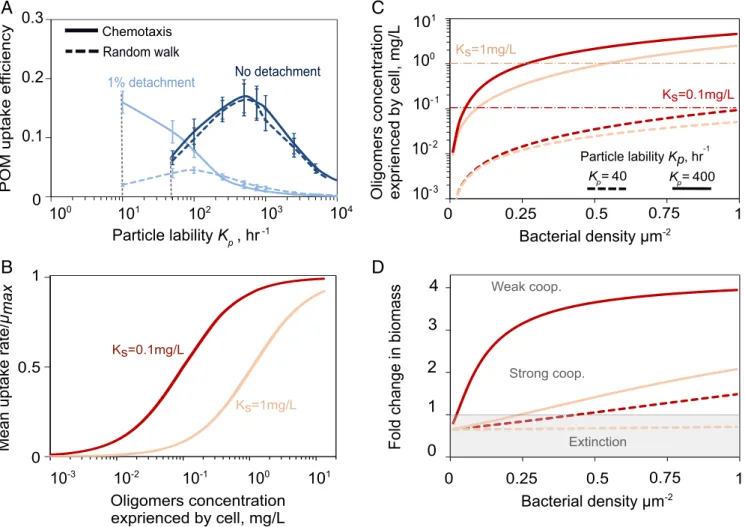
Fig. 3. Bacterial aggregation enhances oligosaccharide uptake rate. (A) Effects of individual cell behavior on POM uptake efficiency. Solid lines show the
simulation results with chemotactic behavior, and simulations with only random walk are shown with dashed lines. Data are shown for 10 h of simulation
with an initial cell number of 107cells/mL and a particle radius of 200μm. Vertical dashed lines indicate that no bacterial growth is sustained below the
indicated Kpvalues. (B) Mean oligosaccharides uptake rate as a function of oligosaccharide concentration modeled by Monod uptake kinetics. Two scenarios
are depicted: high (Ks= 0.1 mg/L) and low (Ks= 1 mg/L) affinity. (C) The effects of bacterial cell density on the oligosaccharide release by hydrolysis, for
different values of Ks(red vs. peach lines) and Kp(dashed vs. solid lines). Simulations are performed for a particle with constant radius of 200μm and initial cell
density of 0.3 cell/μm−2. (D) Fold change in biomass as a function of initial bacterial density is shown for simulations of bacterial colonization on a single
particle after 20 h. For low affinities (high Ks, peach lines) and high recalcitrance (low Kp, dashed lines) strong cooperative (strong coop.), effects emerge and a
minimum cell density threshold is required for growth and degradation.
fewer and smaller patches than at higher densities (Fig. 4B), and by 8 h, the initial population began to die off (Fig. 4A andSI Appendix, Fig. S10A), meaning that the population was not able to
sustain the cell numbers needed to colonize particles or to degrade them (Fig. 4C and D). At the colonization threshold, cells were able to maintain their initial population size, but not to support net growth (Fig. 4A). The colonization density of the particles at the critical threshold matched the population size predicted by measured rates ofpsych6C06 surface attachment and detachment (Fig. 4A and SI Appendix, Fig. S10 B and C), suggesting that a viable population must be maintained off the particle, in addition to on its surface. To test whether low particle lability limited the persistence of the population, we artificially increased Kp by
adding exogenous chitinase to supply 776μg/h GlcNAc, equivalent to the amount of chitinase produced by 7× 10⁴cells per particle psych6C06. Consistent with individual-based model results (Fig. 3D), the addition of the exogenous chitinase activity lowered the cell density-dependent threshold for colonization of the chitin particles (Fig. 4A), allowing the population to persist and grow on the particle (Fig. 4C). Taken together, our results show that oli-gosaccharide limitation leads to the emergence of cooperative growth behaviors.
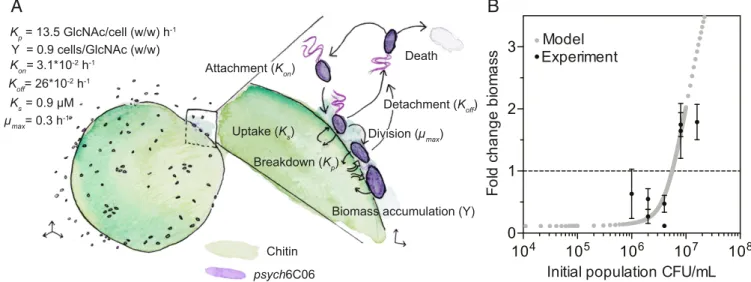
Finally, we tested whether the population-density-dependent threshold for cell–cell cooperation can be quantitatively predicted from cell physiology. We calculated the particle attachment and detachment rates by quantifying cell density on particles (Fig. 5A andSI Appendix, Fig. S10 B and C). Our measurements revealed rapid attachment and detachment rates (attachment rate, 0.03 h−1; detachment rate, 0.26 h−1; or equivalently a 3.8-h residence time). These rates were similar to those previously observed for natural marine bacterioplankton isolates (24) and were dependent on the density of cells off and on the particle, suggesting thatpsych6C06 populations undergo frequent exchange and rearrangement, sim-ilar to what we observed in our simulations (Fig. 3A). We measured Kp
forpsych6C06, using the fluorescent substrate 4-methylumbelliferyl-N-acetyl-β-D-glucosaminide, which detects the release of GlcNAc
from chitin. We noted that very little chitinase activity was de-tected in the culture supernatant ofpsych6C06, but robust activity was associated with the cells themselves (Fig. 5A andSI Appendix, Fig. S10D), indicating that enzymes were membrane bound. Using methylumbelliferyl-conjugated substrates with different cleavage specificities, we determined that most of thepsych6C06 chitinase activity was derived from exochitinase, which releases GlcNAc as a product (Fig. 5A andSI Appendix, Fig. S10E). Thus, we assessed the GlcNAc to biomass conversion factor (the biomass yield) of this strain by direct measurement of sugar consumption and cell density in exponentially growing cultures (Fig. 5A andSI Appendix, Fig. S10F). We measured the growth rate ofpsych6C06 on a range of GlcNAc concentrations, and used these substrate-limited growth measurements to derive μmax and Ksfrom a fit of the Monod growth equation (26) (Fig. 5A and SI Appendix, Fig. S10G). We parameterized a simplified version of the model with these measurements to describe population-level growth dynamics on a surface where cells can attach, detach, and grow as a function of the hydrolyzed product concentration (seeMethods for a full description of the population-level model). This model as-sumes a rate of diffusive loss of oligosaccharides predicted from the individual-based simulations, and also that all cells on the surface experience the same environment (no local gradients). Using this simplified model, with no free parameters, we studied how the initial cell density determines the population-average colonization rate and the growth of bacteria on the particle surface. We found a remarkable quantitative agreement be-tween this population-level model and our experiments, with critical thresholds predicted between initial densities of 2.5× 10⁴ and 5× 10⁴cells/particle (Fig. 5B). Our analysis thus shows that cell-level physiology and behavior together with diffusion regu-late the onset of social degradation of POM.
0 2 4 6 8 0.0 0.5 1.0 1.5 Initial population cells/bead *10^4 24 h c el ls /bead (* 1 0 4) psych6C06 + Enz
Encounter rate model
0 2 4 6 8 10 24 0.0 0.5 1.0 1.5 Hours C e lls /bead (* 10 4) 4 2 1 8 Initial population cells/bead *104 0.1 1 10 100 1000 0 50 100 Patch size m2 N u m b er of pat c hes
A
B
D
C
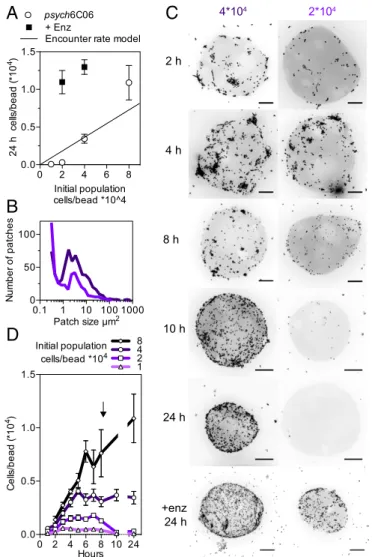
2 h 4 h 8 h 10 h 24 h +enz 24 h 4*104 2*104Fig. 4. Chitinase limitation and encounter rate drive critical
population-density thresholds of chitin-degrading strain psych6C06. (A) Colonization of chitin particles by psych6C06 shows dependence on initial population density (open symbols) and chitinase production (closed symbols). Solid line gives the predicted colonization density based on measured surface residence time, without division or death. Above a critical threshold (intercept of encounter rate model and experimental data), populations are able to survive at their initial density or grow. Below this threshold (gray shaded zone), populations are unable to maintain their initial density, and they go extinct. Adding
ex-ogenous chitinase (776 GlcNAcμg per hour, filled circles) allows populations
below the critical density to maintain their size and grow. In comparison, the Kp
of psych6C06 chitinase is 13.5 g GlcNAc/g cells/h, meaning that the exogenous
chitinase supplies the equivalent of 7× 10⁴cells/particle. (B) Distribution of
psych6C06 cells in patches after 4 h. Dark purple line indicates an initial
pop-ulation of 4× 10⁴and light purple line indicates an initial population of 2× 10⁴.
(C) Representative images showing density-dependent colonization dynamics
for initial populations of cells below (2× 10⁴cells/particle) and above (4× 10⁴
cells/particle) the colonization threshold at times during colonization.+enz 24 h
indicates the addition of exogenous chitinase, as earlier. (Scale bars, 20μm.) (D)
Particle colonization dynamics for populations of psych6C06 over the course of 24 h. Arrow indicates 8-h time, where populations below the critical threshold begin to decrease in density on chitin particles. Data points are combined from 3 experimental replicates. Initial population densities (cells/particle) are noted
by symbols: diamonds, 8× 10⁴; circles, 4× 10⁴; squares, 2× 10⁴; diamonds, 1×
104. Error bars are SEM from at least 6 individual measurements of colonization
density on chitin particles from 3 independent experiments (at least 18 mea-surements). Lines represent the mean trajectory for each cell density.
MIC
Discussion
Here we have shown that cell–cell cooperation, an emergent social behavior of populations, changes the rate and efficiency with which POM is broken down in aquatic environments. Co-operation emerged in populations as a result of 3 key physiological parameters: the affinity of cells for hydrolyzed oligosaccharide, the rate of polysaccharide hydrolysis, and the attachment and de-tachment of cells on/off the particle surface. These 3 parameters defined how public goods were shared among individuals in the population. Low hydrolysis rates favored cooperation because cell–cell clustering increased the uptake efficiency of soluble oli-gosaccharides. In contrast, when hydrolysis rates were high or when aggregates exceeded a certain size threshold, cell–cell clus-tering decreased the per capita access to resources, and instead promoted competition among cells. Remarkably, we observed that active rearrangement of cells caused the dissolution of cell clusters and mitigated competition, but decreased the per capita uptake efficiency. This observation also highlights the fact that in systems with potential for spatial self-organization, that is, most systems outside the laboratory, the balance between cooperation and competition can be delicate and is modulated by the intersection of physical processes with microbial physiology. Although our simulations reveal that physiology and diffusion alone are suffi-cient to explain the onset of cooperation, many bacteria actively regulate enzyme secretion and other group behaviors at the level of transcription in a density-dependent manner (32–35), poten-tially amplifying the effects described here.
Our study highlights 2 important consequences of bacteria– particle interactions in the ocean: most of the POM is lost to diffusion after hydrolysis, effectively turning into DOM, and density dependencies can control the degradation of recalcitrant polysaccharides. In simulations of an open, 3D environment, a faster depolymerization rate for labile particles meant that cells experienced higher local concentrations of oligosaccharide. How-ever, a larger fraction of this oligosaccharide was lost to diffusion, thus reducing the final biomass yield of the population. Uptake efficiency was maximized on hard-to-degrade recalcitrant particles,
where cell–cell cooperation was required to secure access to enough resources to maintain the population size and grow. As a consequence, we observed the emergence of cell density thresh-olds associated with the onset of cooperation, which drastically changed the hydrolysis rate of particles. This result contrasts with the assumption that the breakdown of POM in the environment is primarily controlled by abiotic factors, and that bacteria degrade it at fixed per capita rates (36–40). Instead, we showed experimen-tally that degradation in an environment such as the ocean can be bacteria-limited. Compared with the complexity of POM breakdown by polysaccharide-degrading microbes in the ocean, the model developed in this study is vastly simplified. How-ever, such an approach presents an opportunity to address the fundamental question of how cellular and population-level mi-crobial processes affect the turnover of organic matter in the ocean (41), and in particular, at what spatial and temporal scales variation impacts the higher-order function of communities or ecosystems (42).
Methods
Individual-Based Model of Cell Behavior and Physiology. The mathematical model represents metabolism, surface interaction, and flagellar motility of individual cells in 3D space in the presence of chemical gradients. We in-troduce an individual-based model (43, 44) to quantify single-cell interac-tions with organic particles by abstracting the structural heterogeneities of natural POM into a mathematically simpler spherical shape, while preserving some key physical and chemical processes associated with POM degradation.
A spherical organic particle of 200μm radius is simulated such that it remains
static in the middle of an aqueous volume (∼1 mm3
). Although natural or-ganic matter aggregates may show various shapes and chemical compositions, we modeled particles as perfect spheres made of a single type of insoluble linear polysaccharides such as chitin, alginate, or cellulose. This computational model is inspired by experimental model systems used to study community
assembly on marine POM (10, 20). The particle’s size and its surface chemistry
are assumed to be unchanged during particle degradation: only the particle density changes over time to satisfy mass conservation. This assumption is consistent with experimental observations that have shown no significant change in organic particle size during microbial degradation until the final stages of collapse (20). We simulated a scenario in which an isogenic pop-ulation of cells is allowed to colonize and degrade a particle with a defined
A
10
410
510
610
710
80
1
2
3
Initial population CFU/mL
F
o
ld
c
hange
bi
om
as
s
Experiment
Model
B
Kon= 3.1*10-2 h-1 Koff= 26*10-2 h-1 Ks = 0.9 μM Kp = 13.5 GlcNAc/cell (w/w) h-1 μmax= 0.3 h-1 Y = 0.9 cells/GlcNAc (w/w) Uptake (Ks) Breakdown (Kp) Attachment (Kon) DeathBiomass accumulation (Y) Detachment (Koff) Division (μmax)
Chitin
psych6C06
Fig. 5. Physiological traits predict the population-density dependence of growth on chitin particles by psych6C06 in a diffusive environment. (A)
Summary of measurements made to parameterize the population-level bottom-up model of psych6C06 growth on chitin. The key parameter for each
process is given in parentheses: Kon, rate of cell attachment to particles (SI Appendix, Fig. S10B); Koff, rate of cell detachment from particles (SI Appendix,
Fig. S10C); Kp, rate of GlcNAc release by cell-associated chitinase (SI Appendix, Fig. S10D); Y, the yield of GlcNAc conversion to biomass during
carbon-limited growth (SI Appendix, Fig. S10F); Ks, Monod half-saturation constant for GlcNAc (SI Appendix, Fig. S10G);μmax, maximum growth rate on GlcNAc (SI
Appendix, Fig. S10G). wt/wt, ratio of weights. (B) Prediction of the fold change in biomass of psych6C06 populations after 24 h of growth on a chitin
surface with an analytical model based on psych6C06 physiological the parameters measured inSI Appendix, Fig. S10(gray points). Black data points show
the experimentally measured change in biomass from Fig. 3A. Dotted horizontal line indicates no biomass change. Error bars represent SEM from at least 3 measurements of particle colonization density.
volume. The simulations were started with zero oligosaccharides, and the particle was considered to be the sole carbon source.
To take into account the fact that cells might regulate their enzymatic activity, the model limits enzyme secretion to 2 scenarios: when cells adhere to the particle surface or when the rate of oligosaccharide supply exceeds the maintenance threshold. Importantly, our simulations ensure mass conser-vation between total carbon uptake and growth and loss of oligosaccharides. Individual cells are initialized as a uniform random distribution in the aqueous volume, and are allowed to disperse following gradients of chemoattractant (in this case, oligosaccharide). The cells can consume the oligosaccharide, grow, and divide to new daughter cells and experience a range of local conditions. A full derivation of the mathematical expressions and steps used for modeling of microbial growth, dispersal, and enzyme secretion can be
found in theSI Appendix.
Experimental Methods. Strain psych6C06 was previously isolated from an enrichment of nearshore coastal seawater (Nahant, MA) for surface-associated chitin degrading microbial communities (10, 20). The strain was maintained as colonies on Marine Broth 2216 (Difco 279110) with 1.5% agar (BD 214010). To establish exponential growth, we modified a culturing protocol previously developed for Escherichia coli K12 (45) and grew cells on a defined seawater
medium with the N-acetyl-D-glucosamine (GlcNAc) at the concentrations
in-dicated. Chitin hydrogel particles (NEB) were washed and diluted to 200 to
250 particles per milliliter with size range from 40 to 100μm in diameter. The
particles were rotated end over end at 21 °C to 25 °C. The density of
in-oculated cells was set to be at an absorbance at 600 nm, (A600) of 0.01, diluted
from 20 mM GlcNAc minimal medium cultures prepared as described earlier.
To visualize particles and their surface-associated bacteria, 200-μL subsamples
were stained with the DNA-intercalating dye SYTO9 (Thermo Fisher, S34854) at a 1:285 dilution of the stock in 96-well plates with optically clear plastic bottoms (VWR 10062-900).
Cell density measurements A600of exponentially growing cells were used
to measure the maximum cellular growth rate, and plating was used to
measure growth under GlcNAc limitation, from which we derived the half-saturation constant. GlcNAc depletion was measured during growth, using the dintrosalicylic acid reagent method (46), and the depletion rate was used
to calculate the biomass yield (SI Appendix).
Chitinase activity was quantified using methylumbelliferyl-conjugated
substrates N,N′-diacetyl-β-D-chitobioside, N-acetyl-β-D-glucosaminide, and
β-D-N,N′,N′′-triacetylchitotriose (Sigma CS1030). Microscopy was performed
on microconfocal high-content imaging system (ImageXpress Micro
Confo-cal, Molecular Devices), using the 60-μm pinhole spinning disk mode.
Fluo-rescent signal was visualized with a LED light cube (Lumencore Spectra X light engine), and bandpass filters (ex 482/35 nm em 538/40 nm dichroic 506 nm), with a 40× objective (Nikon Ph 2 S Plan Fluor ELWD ADM 0.60 NA cc 0 to 2 mm, correction collar set to 1.1), and a sCMOS detector (Andor Zyla). Image analysis was performed in MATLAB (release 2018a). Briefly, image stacks were split in half and a maximum intensity projection was obtained for each half. The low level of fluorescent signal associated with free dye in the hydrogel particles was used to define an intensity threshold suitable to create a binary mask for the particle projections. A mask of the cells on the particles was then defined using their brighter fluorescence intensity. We used this segmentation to quantify the total surface area occupied by the cells on the particle and to quantify the total surface area occupied by patches. We define patches as an area greater than that equivalent to 3 cells
(>10 μm2), where cells contact other cells or were in close proximity (<10 μm
from nearest neighbor). This definition is analogous to the spacing con-straints defined in the individual-based simulation.
ACKNOWLEDGMENTS. We thank Lu Lu for technical assistance and all members of the O.X.C. laboratory for their support and critical feedback. We also thank Terry Hwa and members of his laboratory for discussions. This project was supported by Simons Early Career Award 410104 and the Simons Collaboration: Principles of Microbial Ecosystems, award number 542395. A.E. acknowledges funding from Swiss National Science Foundation: Grants P2EZP2 175128 and P400PB_186751.
1. H. J. Flint, K. P. Scott, S. H. Duncan, P. Louis, E. Forano, Microbial degradation of complex carbohydrates in the gut. Gut Microb. 3, 289–306 (2012).
2. E. C. Martens et al., Recognition and degradation of plant cell wall polysaccharides by two human gut symbionts. PLoS Biol. 9, e1001221 (2011).
3. F. Cuskin et al., Human gut Bacteroidetes can utilize yeast mannan through a selfish mechanism. Nature 517, 165–169 (2015).
4. E. A. Paul, The nature and dynamics of soil organic matter: Plant inputs, microbial transformations, and organic matter stabilization. Soil Biol. Biochem. 98, 109–126 (2016). 5. C. Liang, J. P. Schimel, J. D. Jastrow, The importance of anabolism in microbial control
over soil carbon storage. Nat. Microbiol. 2, 17105 (2017).
6. H. Dang, C. R. Lovell, Microbial surface colonization and biofilm development in marine environments. Microbiol. Mol. Biol. Rev. 80, 91–138 (2015).
7. J. T. Turner, Zooplankton fecal pellets, marine snow, phytodetritus and the ocean’s biological pump. Prog. Oceanogr. 130, 205–248 (2015).
8. H. P. Grossart, H. Ploug, Microbial degradation of organic carbon and nitrogen on diatom aggregates. Limnol. Oceanogr. 46, 267–277 (2001).
9. L. D’Ambrosio, K. Ziervogel, B. MacGregor, A. Teske, C. Arnosti, Composition and enzymatic function of particle-associated and free-living bacteria: A coastal/offshore comparison. ISME J. 8, 2167–2179 (2014).
10. M. S. Datta, E. Sliwerska, J. Gore, M. F. Polz, O. X. Cordero, Microbial interactions lead to rapid micro-scale successions on model marine particles. Nat. Commun. 7, 11965 (2016).
11. O. X. Cordero, L. A. Ventouras, E. F. DeLong, M. F. Polz, Public good dynamics drive evolution of iron acquisition strategies in natural bacterioplankton populations. Proc. Natl. Acad. Sci. U.S.A. 109, 20059–20064 (2012).
12. C. D. Nadell, K. Drescher, K. R. Foster, Spatial structure, cooperation and competition in biofilms. Nat. Rev. Microbiol. 14, 589–600 (2016).
13. K. Drescher, C. D. Nadell, H. A. Stone, N. S. Wingreen, B. L. Bassler, Solutions to the public goods dilemma in bacterial biofilms. Curr. Biol. 24, 50–55 (2014).
14. G. E. Leventhal, M. Ackermann, K. T. Schiessl, Why microbes secrete molecules to modify their environment: The case of iron-chelating siderophores. J. R. Soc. Interface 16, 20180674 (2019).
15. F. Azam, F. Malfatti, Microbial structuring of marine ecosystems. Nat. Rev. Microbiol. 5, 782–791 (2007).
16. J. Gore, H. Youk, A. van Oudenaarden, Snowdrift game dynamics and facultative cheating in yeast. Nature 459, 253–256 (2009).
17. C. Ratzke, J. Gore, Self-organized patchiness facilitates survival in a cooperatively growing Bacillus subtilis population. Nat. Microbiol. 1, 16022 (2016).
18. J. H. Koschwanez, K. R. Foster, A. W. Murray, Sucrose utilization in budding yeast as a model for the origin of undifferentiated multicellularity. PLoS Biol. 9, e1001122 (2011).
19. R. C. Newell, M. I. Lucas, E. A. S. Linley, Rate of degradation and efficiency of con-version of phytoplankton debris by marine microorganisms. Mar. Ecol. Prog. Ser. 6, 123–136 (1981).
20. T. N. Enke, G. E. Leventhal, M. Metzger, J. T. Saavedra, O. X. Cordero, Microscale ecology regulates particulate organic matter turnover in model marine microbial communities. Nat. Commun. 9, 2743 (2018).
21. J. U. Kreft, G. Booth, J. W. T. Wimpenny, BacSim, a simulator for individual-based modelling of bacterial colony growth. Microbiology 144, 3275–3287 (1998). 22. A. Ebrahimi, D. Or, Hydration and diffusion processes shape microbial community
organization and function in model soil aggregates. Water Resour. Res. 51, 9804– 9827 (2015).
23. T. Ahmed, R. Stocker, Experimental verification of the behavioral foundation of bacterial transport parameters using microfluidics. Biophys. J. 95, 4481–4493 (2008). 24. T. Kiørboe, H. P. Grossart, H. Ploug, K. Tang, Mechanisms and rates of bacterial
col-onization of sinking aggregates. Appl. Environ. Microbiol. 68, 3996–4006 (2002). 25. L. Michaelis, M. L. Menten, K. A. Johnson, R. S. Goody, The original michaelis constant:
Translation of the 1913 michaelis-menten paper. Biochemistry 50, 8264–8269 (2011). 26. J. Monod, The growth of bacterial bultures. Annu. Rev. Microbiol. 3, 371–394 (1949). 27. A. Rieck, D. P. R. Herlemann, K. Jürgens, H. P. Grossart, Particle-associated differ from free-living bacteria in surface waters of the baltic sea. Front. Microbiol. 6, 1297 (2015). 28. W. B. Whitman, D. C. Coleman, W. J. Wiebe, Prokaryotes: The unseen majority. Proc.
Natl. Acad. Sci. U.S.A. 95, 6578–6583 (1998).
29. T. J. Battin et al., Biophysical controls on organic carbon fluxes in fluvial networks. Nat. Geosci. 1, 95–100 (2008).
30. R. Stocker, J. R. Seymour, A. Samadani, D. E. Hunt, M. F. Polz, Rapid chemotactic response enables marine bacteria to exploit ephemeral microscale nutrient patches. Proc. Natl. Acad. Sci. U.S.A. 105, 4209–4214 (2008).
31. J. R. Taylor, R. Stocker, Trade-offs of chemotactic foraging in turbulent water. Science 338, 675–679 (2012).
32. M. Jemielita, N. S. Wingreen, B. L. Bassler, Quorum sensing controls Vibrio cholerae multicellular aggregate formation. eLife 7, e42057 (2018).
33. E. Goo et al., Bacterial quorum sensing, cooperativity, and anticipation of stationary-phase stress. Proc. Natl. Acad. Sci. U.S.A. 109, 19775–19780 (2012).
34. K. M. DeAngelis, S. E. Lindow, M. K. Firestone, Bacterial quorum sensing and nitrogen cycling in rhizosphere soil. FEMS Microbiol. Ecol. 66, 197–207 (2008).
35. D. M. Cornforth et al., Combinatorial quorum sensing allows bacteria to resolve their social and physical environment. Proc. Natl. Acad. Sci. U.S.A. 111, 4280–4284 (2014). 36. K. Georgiou, R. Z. Abramoff, J. Harte, W. J. Riley, M. S. Torn, Microbial community-level regulation explains soil carbon responses to long-term litter manipulations. Nat. Commun. 8, 1223 (2017).
37. S. Manzoni, S. M. Schaeffer, G. Katul, A. Porporato, J. P. Schimel, A theoretical analysis of microbial eco-physiological and diffusion limitations to carbon cycling in drying soils. Soil Biol. Biochem. 73, 69–83 (2014).
38. J. P. Schimel, M. N. Weintraub, The implications of exoenzyme activity on microbial carbon and nitrogen limitation in soil: A theoretical model. Soil Biol. Biochem. 35, 549–563 (2003).
MIC
39. T. Ilyina et al., Global ocean biogeochemistry model HAMOCC: Model architecture and performance as component of the MPI-Earth system model in different CMIP5 experimental realizations. J. Adv. Model. Earth Syst. 5, 287–315 (2013). 40. J. K. Moore, S. C. Doney, J. A. Kleypas, D. M. Glover, I. Y. Fung, An intermediate
complexity marine ecosystem model for the global domain. Deep Sea Res. Part II Top. Stud. Oceanogr. 49, 403–462 (2001).
41. N. Jiao et al., Microbial production of recalcitrant dissolved organic matter: Long-term carbon storage in the global ocean. Nat. Rev. Microbiol. 8, 593–599 (2010). 42. O. X. Cordero, M. S. Datta, Microbial interactions and community assembly at
micro-scales. Curr. Opin. Microbiol. 31, 227–234 (2016).
43. J. U. Kreft, C. Picioreanu, J. W. T. Wimpenny, M. C. M. van Loosdrecht, Individual-based modelling of biofilms. Microbiology 147, 2897–2912 (2001).
44. A. N. Ebrahimi, D. Or, Microbial dispersal in unsaturated porous media: Characteristics of motile bacterial cell motions in unsaturated angular pore networks. Water Resour. Res. 50, 7406–7429 (2014).
45. M. Scott, C. W. Gunderson, E. M. Mateescu, Z. Zhang, T. Hwa, Interdependence of cell growth and gene expression: Origins and consequences. Science 330, 1099–1102 (2010).
46. G. L. Miller, Use of dinitrosalicylic acid reagent for determination of reducing sugar. Anal. Chem. 31, 426–428 (1959).