HAL Id: hal-02498645
https://hal.archives-ouvertes.fr/hal-02498645
Submitted on 28 Sep 2020
HAL is a multi-disciplinary open access
archive for the deposit and dissemination of
sci-entific research documents, whether they are
pub-lished or not. The documents may come from
teaching and research institutions in France or
abroad, or from public or private research centers.
L’archive ouverte pluridisciplinaire HAL, est
destinée au dépôt et à la diffusion de documents
scientifiques de niveau recherche, publiés ou non,
émanant des établissements d’enseignement et de
recherche français ou étrangers, des laboratoires
publics ou privés.
revealed by time-resolved crystallography and transient
absorption spectroscopy.
Joyce Woodhouse, Gabriela Nass Kovacs, Nicolas Coquelle, Lucas M. Uriarte,
Virgile Adam, Thomas R. M. Barends, Martin Byrdin, Eugenio de la Mora,
R. Bruce Doak, Mikolaj Feliks, et al.
To cite this version:
Joyce Woodhouse, Gabriela Nass Kovacs, Nicolas Coquelle, Lucas M. Uriarte, Virgile Adam, et al..
Photoswitching mechanism of a fluorescent protein revealed by time-resolved crystallography and
transient absorption spectroscopy.. Nature Communications, Nature Publishing Group, 2020, 11 (1),
pp.741. �10.1038/s41467-020-14537-0�. �hal-02498645�
Photoswitching mechanism of a
fluorescent protein
revealed by time-resolved crystallography and
transient absorption spectroscopy
Joyce Woodhouse
1
, Gabriela Nass Kovacs
2,12
, Nicolas Coquelle
1,3,12
, Lucas M. Uriarte
4,12
,
Virgile Adam
1,12
, Thomas R.M. Barends
2
, Martin Byrdin
1
, Eugenio de la Mora
1
, R. Bruce Doak
2
,
Mikolaj Feliks
5
, Martin Field
1,6
, Franck Fieschi
1
, Virginia Guillon
1
, Stefan Jakobs
7
, Yasumasa Joti
8
,
Pauline Macheboeuf
1
, Koji Motomura
9
, Karol Nass
2
, Shigeki Owada
10
, Christopher M. Roome
2
,
Cyril Ruckebusch
4
, Giorgio Schirò
1
, Robert L. Shoeman
2
, Michel Thepaut
1
, Tadashi Togashi
8
,
Kensuke Tono
8
, Makina Yabashi
10
, Marco Cammarata
11
, Lutz Foucar
2
, Dominique Bourgeois
1
,
Michel Sliwa
4
*, Jacques-Philippe Colletier
1
, Ilme Schlichting
2
* & Martin Weik
1
*
Reversibly switchable
fluorescent proteins (RSFPs) serve as markers in advanced
fluores-cence imaging. Photoswitching from a non-
fluorescent off-state to a fluorescent on-state
involves trans-to-cis chromophore isomerization and proton transfer. Whereas excited-state
events on the ps timescale have been structurally characterized, conformational changes on
slower timescales remain elusive. Here we describe the off-to-on photoswitching mechanism
in the RSFP rsEGFP2 by using a combination of time-resolved serial crystallography at an
X-ray free-electron laser and ns-resolved pump–probe UV-visible spectroscopy. Ten ns after
photoexcitation, the crystal structure features a chromophore that isomerized from trans to
cis but the surrounding pocket features conformational differences compared to the final
on-state. Spectroscopy identi
fies the chromophore in this ground-state photo-intermediate as
being protonated. Deprotonation then occurs on the
μs timescale and correlates with a
conformational change of the conserved neighbouring histidine. Together with a previous
excited-state study, our data allow establishing a detailed mechanism of off-to-on
photo-switching in rsEGFP2.
https://doi.org/10.1038/s41467-020-14537-0
OPEN
1Univ. Grenoble Alpes, CEA, CNRS, Institut de Biologie Structurale, F-38000 Grenoble, France.2Max-Planck-Institut für medizinische Forschung, Jahnstrasse
29, 69120 Heidelberg, Germany.3Large-Scale Structures Group, Institut Laue Langevin, 71, avenue des Martyrs, 38042, Grenoble cedex 9, France.4Univ. Lille, CNRS, UMR 8516, LASIR, Laboratoire de Spectrochimie Infrarouge et Raman, F59 000 Lille, France.5Department of Chemistry, University of Southern California, Los Angeles, USA.6Laboratoire Chimie et Biologie des Métaux, BIG, CEA-Grenoble, Grenoble, France.7Department of NanoBiophotonics, Max Planck Institute for Biophysical Chemistry, Göttingen, Germany.8Japan Synchrotron Radiation Research Institute, 1-1-1 Kouto, Sayo-cho, Sayo-gun, Hyogo
679-5198, Japan.9Institute of Multidisciplinary Research for Advanced Materials, Tohoku University, Sendai 980-8577, Japan.10RIKEN SPring-8 Center,
Sayo, Japan.11Department of Physics, UMR UR1-CNRS 6251, University of Rennes 1, Rennes, France.12These authors contributed equally: Gabriela
Nass-Kovacs, Nicolas Coquelle, Lucas M. Uriarte, Virgile Adam. *email:michel.sliwa@univ-lille.fr;ilme.schlichting@mpimf-heidelberg.mpg.de;weik@ibs.fr
123456789
P
hototransformable
fluorescent proteins (PTFPs) are
invaluable tools for advanced
fluorescence microscopy,
serving as genetically encoded markers that change
emis-sion color or intensity when irradiated with visible light at specific
wavelengths
1,2. A subgroup of PTFPs, the so-called reversibly
switchable
fluorescent proteins (RSFPs), are used in
ensemble-based nanoscopy approaches such as RESOLFT (reversible
saturable optical
fluorescence transition
3) or NL-SIM (nonlinear
structured illumination microscopy
4), where they are repeatedly
toggled back and forth between a
fluorescent on- and a
non-fluorescent off-state by irradiation with light at two different
wavelengths
5. Depending on whether irradiation at the excitation
peak turns the
fluorescent state off or on, RSFP are coined
negative or positive switchers, respectively. It is widely accepted
that the molecular basis of photoswitching in RSFPs (with the
exception of some engineered variants such as Dreiklang
6) is a
combination of isomerization and change in protonation state of
the chromophore phenol moiety, as evidenced by X-ray
crystal-lography
7and absorption and
fluorescence spectroscopies
8. In all
negative RSFP, the
fluorescent on-state chromophore is an
anionic cis isomer (cis-phenolate) whereas the non-fluorescent
off-state is a neutral trans isomer (trans-phenol). The
chron-ological order of isomerization and protonation-changes is being
controversially discussed, as well as corresponding timescales on
which they occur.
Over the past decade, several spectroscopic investigations
focused on Dronpa, a negative RSFP from Anthozoa (e.g. corals)
9.
Due to the thousand-fold higher switching quantum yield (QY)
in the off-to-on (0.37) direction as compared to on-to-off (3.2 ×
10
−4)
9, mostly off-to-on photoswitching has been studied
experimentally. The
first investigation of Dronpa by ultrafast
optical spectroscopy suggested that the deprotonation of the
trans-phenol occurs in the excited state on the ps timescale via an
excited-state proton transfer (ESPT) mechanism
10. Later,
how-ever, picosecond time-resolved infrared (TR-IR) spectroscopy on
Dronpa
11and its fast-switching M159T mutant
12indicated that
isomerization occurs during picosecond excited-state decay. This
has also been suggested by femtosecond UV–visible transient
anisotropy absorption spectroscopy, which attributed the
first
photoproduct to a cis-protonated chromophore
13. The same
study also showed that chromophore deprotonation occurs in the
ground state on the microsecond timescale. However, another
TR-IR study on the Dronpa-M159T mutant advocated that both
isomerization and deprotonation are ground-state processes,
attributing the ps spectroscopic changes in the excited state to
protein conformational changes priming the chromophore for
switching
14. This view was corroborated by a follow-up TR-IR
study on Dronpa-M159T involving isotope labeling
15. In that
study, evidence has been provided for chromophore distortion
and excited-state decay on the picosecond timescale, followed by
formation of the cis protonated chromophore with a 91 ns time
constant before the
final deprotonation step. Importantly, the
structure of the cis-protonated switching intermediate in Dronpa
has remained elusive.
RSFPs from Hydrozoa (e.g. jellyfish), such as rsEGFP2
16, are
less well studied than those from Anthozoa because fewer
examples have been identified or generated so far
17. Whereas
both hydrozoan and anthozoan RSFPs have the same overall
protein fold and chromophore
(4-(p-hydroxybenzylidene)−5-imidazolinone (p-HBI)), structural features in their chromophore
pockets differ. For example, the p-hydroxyphenyl ring of the
on-state chromophore is stabilized in rsEGFP2 by three hydrogen
bonds
18and in Dronpa by
π-stacking with the side chain of a
histidine residue and by two hydrogen bonds
7. Therefore, it is not
clear yet if the photoswitching mechanisms in hydrozoan and
anthozoan RSFPs differ in details or not. Moreover, structures of
ground-state intermediates remain to be determined for both
hydrozoan and anthozoan RSFPs. Here, we studied off-to-on
photoswitching in rsEGFP2 by a combination of time-resolved
crystallography and transient absorption spectroscopy.
rsEGFP2 is a bright, photostable, monomeric and
photo-switchable variant of the enhanced green
fluorescent protein
(EGFP). This fast RSFP is extensively used for tagging proteins in
mammalian cells for live-cell RESOLFT nanoscopy
16. Its p-HBI
chromophore, formed autocatalytically from the three residues
Ala-Tyr-Gly, is carried by an
α-helix entrapped within an
11-stranded
β-barrel
18(Fig.
1
a). rsEGFP2 remains photoactive in the
crystalline state, so that
first insights into the structure of its
on-and off-state chromophores could be obtained by conventional
crystallography
18. Optical spectroscopy measurements and crystal
structures established that in rsEGFP2, as in other RSFPs such as
Dronpa
7, asFP595
19, mTFP0.7
20, or IrisFP
21, the resting on-state
b
a
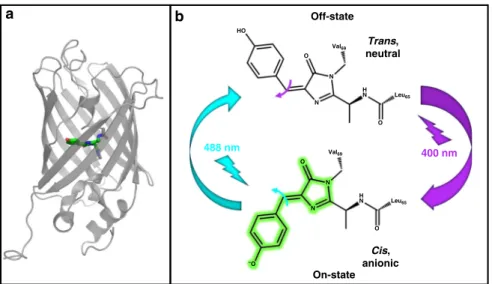
400 nm 488 nm On-state Off-state HO O O O N N – O O N H N H N Val69 Val69 Leu65 Leu65 N Trans, neutral Cis, anionicFig. 1 Structure and photoswitching scheme of rsEGFP2. a Three-dimensional structure showing an 11-strandedβ-barrel embedding a chromophore held by a centralα-helix. b The chromophore of rsEGFP2 in its fluorescent on-state (bottom) absorbs at 479 nm (laser 488 nm) and emits at 503 nm. Isomerization competes withfluorescence and leads the chromophore to its non-fluorescent off-state, which absorbs at 403 nm (laser 400 nm) and ultimately isomerizes back to the initial on-state. Flashes and arrows represent the color of each actinic wavelength. The width of arrows is representative of the efficiency of each isomerization.
is characterized by a cis-phenolate chromophore, which absorbs
at 479 nm and emits at 503 nm (fluorescence QY of 0.35),
whereas the off-state features a trans-phenol chromophore, which
absorbs at 403 nm. Like Dronpa, rsEGFP2 is a negative RSFP,
meaning that on-to-off photoswitching competes with
fluores-cence
18and is triggered by illumination of the anionic species at
479 nm with a switching QY
on-to-offof 1.65 × 10
−2.
Back-switching to the on-state is triggered by illumination at 405 nm,
and characterized by a QY
off-to-onof 0.33
18(Fig.
1
b).
Chromophore states that accumulate at room temperature and
physiological pH can be characterized by conventional X-ray
crystallography. In order to characterize the room-temperature
structure of photoswitching intermediate states that only exist
transiently, another method is needed that allows collecting
structural data on a timescale from a few ps to ms. Such a method
is time-resolved serial femtosecond (fs) crystallography (TR-SFX)
using X-ray free-electron lasers (XFELs)
22,23, which has already
provided intermediate-state structures of several photosensitive
proteins
24–37. Recently, we combined ultrafast optical
spectro-scopy and TR-SFX to study excited-state intermediates of
rsEGFP2 on the ps timescale during off-to-on switching
27.
Optical spectroscopy showed that the excited state decays with a
time constant of a few ps. TR-SFX revealed that 1 ps after
pho-toexcitation at 400 nm, the chromophore adopts a twisted
con-formation halfway between the trans and cis isomers, while at 3
ps, the cis chromophore of a presumed ground-state intermediate
starts to become populated. The quality of the latter data,
how-ever, did not allow building a structural model reliably.
Conse-quently, the structure of the
first photoproduct during rsEGFP2
off-to-on photoswitching has remained elusive. Such a structure
would provide insight into conformational changes in the
chro-mophore pocket occurring after decay of the excited-state and
clarify the order of photoswitching events in RSFPs from
Hydrozoa.
Here, we describe TR-SFX experiments that capture an
off-to-on switching intermediate, formed 10 ns after
photo-excitation of rsEGFP2. The structure of the intermediate
reveals that the initially trans-protonated chromophore has
transitioned to the cis isomer and evidences conformational
changes in the main and side chains of residues in the
chro-mophore pocket. Structural features revealed by the 10 ns
structure are compatible with a cis protonated chromophore.
Indeed, pump–probe UV–visible spectroscopy indicates that at
this time, the chromophore is still protonated, as
deprotona-tion only occurs on the µs to ms timescale in soludeprotona-tion. Thus,
our data, together with our ps study published earlier
27,
establish that off-to-on photoswitching in rsEGFP2 involves
excited-state isomerization on the ps timescale followed by µs
conformational changes in the ground state that trigger proton
transfer on the ms timescale. This allows proposing a detailed
switching mechanism.
Results
Time-resolved UV–visible transient absorption spectroscopy.
Time-resolved UV–visible transient absorption spectra were
recorded from 40-ps to 10-ms after excitation of rsEGFP2 in its
off-state in solution (50 mM HEPES pH 8, 50 mM NaCl; Fig.
2
,
Supplementary Fig. 1). On the examined timescale, the excited
state had decayed
27so that the photodynamics of rsEGFP2 in the
ground state was monitored. From 40 ps to 2 ns (Supplementary
Fig. 1a), transient spectra show a negative and a positive band at
420 and 460 nm, respectively, evolving with a characteristic time
constant of 87 ps ± 8 ps (Supplementary Fig. 1c). A negative band
at 500 nm originates from stimulated emission from residual 10%
of rsEGFP2 that had remained in the cis anionic on-state
(Supplementary Fig. 1b) and vanished after 2 ns (Supplementary
Fig. 1d). Between 10 and 100 ns, there is no significant spectral
evolution (Supplementary Fig. 2). Figure
2
shows spectral changes
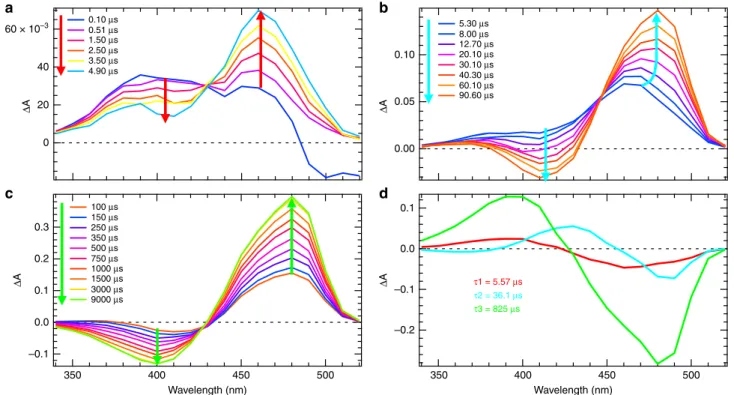
from 100 ns to 9 ms. The transient difference absorbance
spec-trum at 100 ns shows a broad positive band with a maximum at
400 nm (dark blue in Fig.
2
a). This band evolves within 4.9
μs to a
spectrum (light blue) with two positive maxima at 390 nm and
460 nm. Then within 90.6 µs, the
first peak (390 nm) vanishes,
while a negative band appears at 410 nm. The second peak (460
nm) increases and shifts to 480 nm (Fig.
2
b). Subsequently, and
on a timescale from 100 µs to 9 ms, the maximum of the negative
band shifts from 420 to 400 nm while the positive band at 480 nm
further increases in amplitude. The 480 nm band is characteristic
of the cis anionic form
16.
Three distinct time windows are observed for the evolution of
transient spectra (Fig.
2
a–c) with the existence of two isosbestic
points (Fig.
2
a, c). A model based on the weighted sum of three
exponential decays was chosen to
fit the kinetic traces for all
wavelengths between 100 ns to 10 ms. The estimated time
constants are 5.57 ± 0.02 µs, 36.1 ± 0.1 µs and 824.8 ± 0.3 µs,
respectively. The residuals show no structure, thus validating
the given confidence intervals (Supplementary Fig. 3). However, it
is known that standard deviations of the parameter values are
optimistic estimates of the confidence on these parameters (since
it assumes that the estimated parameters are the true ones)
38.
Therefore, we performed a bootstrap estimate of the standard
deviation of the set of parameters. By bootstrapping, different sets
of parameters are reported for each replicated
fit. Mean value and
confidence can then be estimated from their respective
distribu-tion. Results obtained for 1000 replicates are reported in
Supplementary Fig. 4 (see details in the Methods section) and
confirm the validity of the time constants reported above. Similar
experiments were carried out in D
2O solution (50 mM HEPES pD
8, 50 mM NaCl; Supplementary Fig. 5), and the same model was
applied, yielding time constants of 5.16 ± 0.02 µs, 88.4 ± 0.2 µs
and 2041.1 ± 0.7 µs. Thus, the
first time constant is similar in H
2O
and D
2O, but a significant isotope effect is observed for the two
others (k
H/k
D= 2.45 and 2.47, respectively) which can be
assigned to proton transfer steps. Decay associated spectra
(Fig.
2
d) show that the 5.57 µs time constant in H
2O solution is
mainly characterized by a growth of the positive band at 460 nm
and a decay at 390 nm. The 36.1 µs time constant has some
positive and negative contributions characteristic of the band
shift observed, while the 825 µs time constant is mainly
characterized by the respective decay and growth of the 390-nm
and 480-nm bands.
Nanosecond transient absorption data were also recorded
from a suspension of rsEGFP2 microcrystals (in 100 mM
HEPES pH 8, 2.5 M ammonium sulfate), using a modified
flash-photolysis setup (see Methods). Transient difference spectra
similar to those measured in solution were obtained, with
positive bands
first growing at 460 nm and then at 480 nm
(Supplementary Fig. 6). A global
fit analysis of kinetic traces for
all wavelengths yield time constants of 4.75 ± 0.13 µs, 42.9 ± 0.8
µs and 295 ± 2 µs, i.e. significantly smaller than of rsEGFP2 in
H
2O solution (50 mM HEPES pH 8, 50 mM NaCl). To test
whether these results are due to the differences in buffer
composition or in protein state, measurements were made with
a solution of rsEGFP2 in buffer containing ammonium sulfate
at a concentration too low to produce crystals or cause protein
precipitation. In this buffer (50 mM HEPES, 50 mM NaCl, pH
8, 1.25 M ammonium sulfate), time constants of 4.23 ± 0.02 µs,
40.4 ± 0.2 µs and 245.2 ± 0.2 µs were found (Supplementary
Fig. 7), which are similar to those for microcrystals. This
suggests that ammonium sulfate accelerates proton transfer in
rsEGFP2.
rsEGFP2 structure solved by TR-SFX 10 ns after
photoexcita-tion. In order to structurally characterize intermediates along the
off-to-on photoswitching reaction coordinate of rsEGFP2,
TR-SFX was carried out at the Spring-8 Angstrom Compact Laser
(SACLA
39) XFEL, according to an optical pump–X-ray probe
scheme (Experiment No. 2015A8031, July 2015). A pump–probe
delay of 10 ns was specifically chosen in order to increase chances
to characterize a ground-state intermediate featuring a
cis-pro-tonated chromophore. Indeed, the 10-ns delay is much shorter
than the µs–ms timescale on which time-resolved UV–visible
transient
absorption
spectroscopy
identified chromophore
deprotonation to occur (see above), while much longer than the
ps timescale on which a twisted-chromophore isomerization
intermediate has been characterized in the excited state
27. Prior to
injection, rsEGFP2 microcrystals were photoswitched from their
(resting) on-state to their off-state (half-life of 100 min
40) by
illumination with 488-nm light, using a dedicated
pre-illumination device
40. Two interleaved datasets were collected,
with (laser_on_Δ10 ns) and without (laser_off) activation by
the 400-nm pump laser (peak power density 1.25 GW/cm
2).
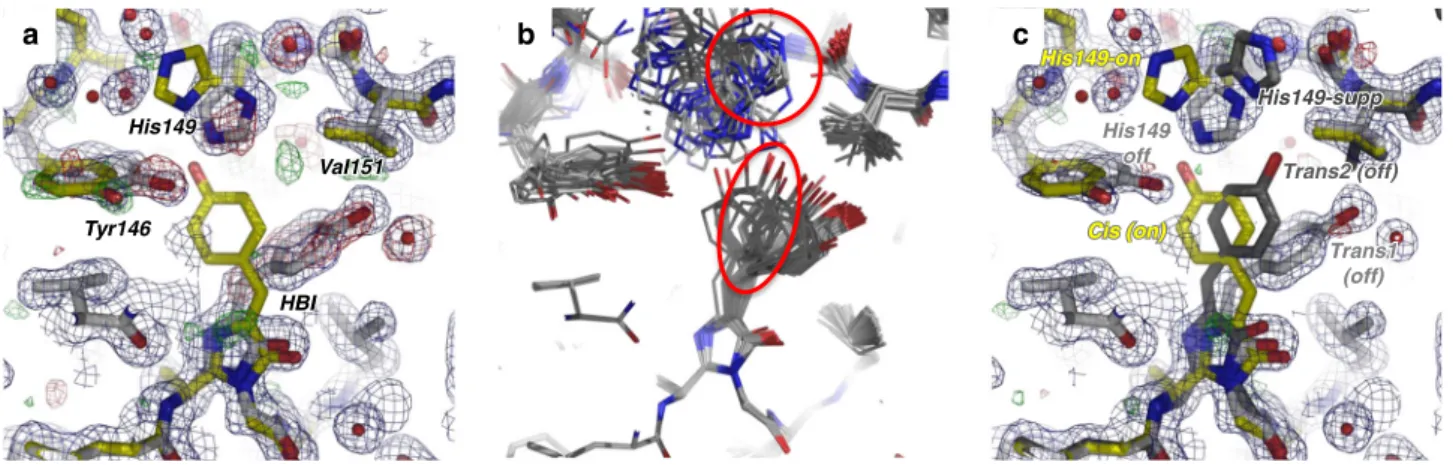
From the laser_off dataset, a laser_off structure was determined at
1.60 Å resolution. The initial model consisted of 90% off-state
and 10% on-state (see Method section for details), with the
chromophore being in the trans and the cis conformation,
respectively (Fig.
3
a). The reason for including the on-state
model was because of absorption spectroscopy that indicated a
residual amount of ~10% of the molecules remained in the
on-state after pre-illumination
40. Moreover, in the resulting
mF
obslaser_off–DF
calclaser_offmap, negative peaks on the trans
chromophore and on the side chains of Tyr146 and His149 were
observed, suggesting that the off-state is even less than 90%
occupied (Fig.
3
a). Additionally, a positive peak at 4.2
σ was
observed halfway between the trans and cis conformers of the
chromophore, suggesting the presence of a third, hitherto
unobserved conformation (Fig.
3
a). An ensemble refinement
against the laser_off dataset was carried out starting from the
trans chromophore of the off-state and also suggested the
pre-sence of a third chromophore conformation (oval contour in
Fig.
3
b). Ensemble refinement identified this conformation as a
trans isomer (called trans2 hereafter). Thus, the chromophore
was modeled in a triple conformation, i.e. trans1, trans2, and cis
and refined against the laser_off dataset, yielding occupancies of
65, 25 and 10%, respectively (Fig.
3
c). Ensemble refinement also
suggested a third conformation of the His149 side chain
(His149-supp, cf. circle in Fig.
3
b), in addition to the ones characteristic of
the on- (His149-on) and the off- (His149-off) states (Fig.
3
b, c),
respectively. Likewise, three conformations of His149 (His149-off,
His149-supp, His149-on) were included in the laser_off model at
65, 25, and 10% occupancy, respectively. Inclusion of these new
chromophore and His149 conformers cleared all major peaks in
the F
obslaser_off–F
calclaser_offmap (Fig.
3
d). Three alternate
con-formations were also included for residues at positions 146-148
and 150-152 of
β-strand-7, which is known to adopt slightly
different conformations in the on- and the off-states at
room-temperature
27, residues at the N- and C-terminus of the
chro-mophore (residues 65 and 69), and for Thr204 and Glu223 (see
details in the Methods section).
Following pump-laser irradiation, some protein molecules
in the crystal are excited and change structure whereas
others are not and thus remain in the laser_off structure.
The structural features that occur within 10 ns after
photoexcita-tion can be disentangled from the resting laser_off structure
in a q-weighted
41difference Fourier map. Such a map was
calculated at 1.85 Å resolution, using observed structure factor
amplitudes of the laser_on_Δ10 ns and laser_off datasets
(F
obslaser_on_Δ10ns–F
obslaser_off) and phases calculated from the
60 × 10–3 40
a
b
d
c
0.10 0.05 0.00 0.1 0.0 –0.1 –0.2 0.10 μs 5.30 μs 8.00 μs 12.70 μs 20.10 μs 30.10 μs 40.30 μs 60.10 μs 90.60 μs τ1 = 5.57 μs τ2 = 36.1 μs τ3 = 825 μs 0.51 μs 1.50 μs 2.50 μs 3.50 μs 100 μs 150 μs 250 μs 350 μs 500 μs 750 μs 1000 μs 1500 μs 3000 μs 9000 μs 4.90 μs 20 0.3 0.2 0.1 0.0 –0.1 Δ A Δ A Δ A Δ A 0 350 400 450 Wavelength (nm) Wavelength (nm) 500 350 400 450 500Fig. 2 Transient UV–Visible spectroscopy in H2O solution. Time-resolved difference absorption spectra of rsEGFP2 in H2O solution (50 mM HEPES pH 8,
50 mM NaCl) recorded after a 410 nm nanosecond excitation of the trans-protonated off-state in the time windows from 100 ns to 9 ms (a–c). The spectrum without laser excitation was subtracted to calculate the difference spectra. The colored arrows (red in (a), cyan in (b) and light green in (c)) correspond to the three time constants (5.57, 36.1 and 825µs, respectively) identified by a global fit analysis of kinetic traces for all wavelengths. d Decay associated spectra obtained byfitting the kinetic traces in panels (a–c) for all wavelengths with a weighted sum of three exponential functions.
laser_off model (Fig.
4
a). The strongest features are located at the
chromophore and its direct environment. Negative (down to
−5.7 σ) and positive (up to 4.5 σ) peaks are observed at the
positions of the trans1 and the cis chromophore, respectively, in
particular on their phenol group and methylene bridge. We do
not observe a negative peak on the trans2 chromophore. Such a
negative peak might have vanished by overlay of a nearby positive
peak on the cis chromophore (Fig.
4
a). Additionally, negative
peaks are present on the off-state conformers of Tyr146 (−4.2 σ)
and His149 (−4.8 σ on His149-off), and a positive one on the
on-state conformers of Tyr146 (3.5
σ). The off-state has thus been
depleted and an intermediate-state built up with a chromophore
conformation similar to the one observed in the on-state.
A structural model of the rsEGFP2 intermediate structure 10 ns
after photoexcitation (laser_on_Δ10 ns intermediate structure)
was determined by difference refinement
42,43using extrapolated
structure factor amplitudes (F
extrapolatedlaser_on_Δ10ns, see eq. 1 in
Methods section)
44. An occupancy of ~50% was estimated
for the intermediate state in the laser_on_Δ10 ns dataset
(Supplementary Fig. 8, see details in the Methods section). The
2F
extrapolatedlaser_on_Δ10ns–F
calcmap (Fig.
4
b) features continuous
and well-defined electron density in the intermediate state for the
entire chromophore and for all neighboring residues, including
His149. At 10 ns, the chromophore has transitioned to a cis
isomer. The main differences between the off-state and the
laser_on_Δ10 ns intermediate structures, besides chromophore
isomerisation, are structural changes in the side chains of Tyr146
and His149 (Fig.
5
). The former is found in its on-state
conformation, whereas the latter remains in an off-like
con-formation. Figure
6
displays an overlay of the laser_on_Δ10 ns
intermediate structure and the on-state structure (PDB entry code
5O89
27) and shows that the main difference between these are the
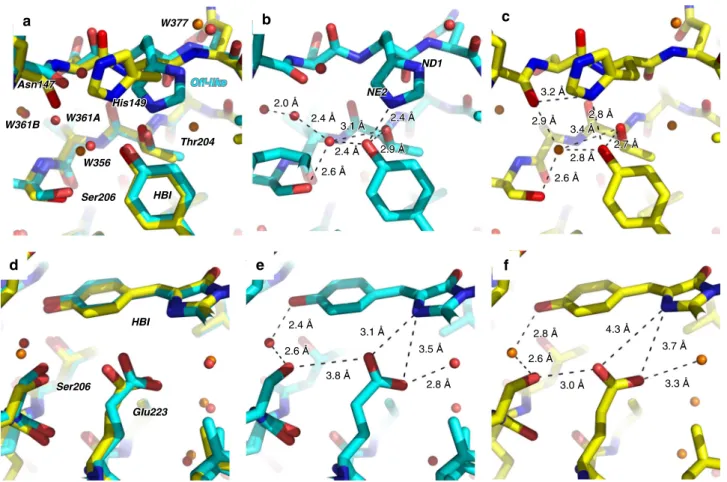
conformations of His149 and Glu223. In the on-state, the
δ
nitrogen atom (ND1) of His149 H-bonds to the deprotonated
chromophore phenol oxygen (Fig.
6
c), whereas in the
laser-on-Δ10 ns intermediate structure (Fig.
6
b) it is the
ε (NE2) nitrogen
atom of His149 that H-bonds to the phenol oxygen of the
chromophore (distance 2.4 Å). Assuming that His149 is singly
c
Cis Cis (on)(on)
Trans1 Trans1 (off) (off) Trans2 Trans2 (o(off) His149-on His149-on Cis (on) His149-on His149 His149 off off -His149-supp His149-supp Trans1 (off) Trans2 (off) His149 off His149-supp
b
a
Tyr1yr146 His His14949 HBI HBI Val1al151 Tyr146 His149 HBI Val151Fig. 3 Off-state structure. Chromophore (HBI) and its neighboring residues in the rsEGFP2 laser_off structure determined by SFX without pump-laser activation are shown.a The initial laser-off model consists of a mixture of the off-state conformer (light gray carbon trace) and the residual on-state conformer (yellow carbon trace) with occupancies of 90% and 10%, respectively. 2Fobslaser_off–Fcalclaser_off(blue) and Fobslaser_off–Fcalclaser_off(green/red)
maps at 1.6 Å resolution are displayed at 1σ and ±3σ, respectively. A positive Fobslaser_off–Fcalclaser_offpeak between the trans (gray) and the cis (yellow)
chromophores suggests the presence of an additional conformer.b Result of ensemble refinements against the laser_off dataset starting for the off-state model (chromophore 100% trans1). A third chromophore conformation and a third rotamer of His149 are revealed. (c) The final laser-off model features triple conformations of His149 and of the chromophore, i.e. His149-off and trans1 (light gray), His149-on and cis (yellow) and the additional His149-supp and trans2 (dark gray) conformations, at 65%, 10% and 25% occupancy, respectively. 2Fobslaser_off–Fcalclaser_off(blue) and Fobslaser_off–Fcalclaser_off(green/
red) maps calculated from the laser-off dataset at 1.6 Å resolution are displayed at 1σ and ±3σ, respectively.
b
Off-like Off-like Off-likea
Tyr1yr146 His His14949 HBI HBI OnOn SuppSuppSupp
Off Val1al151 Tyr146 His149 HBI Val151 Cis Cis (on)(on)
On
Cis (on) Trans1 Trans1 (off) (off) Trans2 Trans2 (o(off) Off Trans1 (off) Trans2 (off)
Fig. 4 10-ns intermediate-state structure. a Q-weighted difference electron density map (Fobslaser_on_Δ10ns–Fobslaser_off), determined from SFX data with
and without pump-laser activation, is contoured at+3σ (green) and −3σ (red) and overlaid onto the model determined from the laser_off dataset. b Model of the laser_on_Δ10 ns intermediate structure (cyan) determined by difference refinement at 1.85 Å resolution. 2Fextrapolatedlaser_on_Δ10ns–Fcalc(blue, 1σ)
protonated and that its protonation state does not change
between the laser_on_Δ10 ns intermediate and the on-state
structures, i.e. that His149NE2 is unprotonated and His149ND1
protonated, the chromophore phenol would be an obligate donor
for the H-bond to His149NE2 in the laser-on-Δ10 ns
inter-mediate structure. Thus, the His149 conformer observed 10 ns
after excitation by the pump laser are compatible with a
protonated cis isomer of the chromophore. As to Glu223, one
of its carboxyl oxygens is in H-bonding distance to N2 of the
chromophore (3.1 Å) in the laser_on_Δ10 ns intermediate
(Fig.
6
e) but not in the on-state structure (Fig.
6
f), and is in
H-bonding distance to Ser206OG in the on-state structure (Fig.
6
f)
but not in the laser_on_Δ10 ns intermediate structure (Fig.
6
e).
Discussion
The mechanism of off-to-on photoswitching in rsEGFP2 involves
trans-to-cis isomerization and deprotonation of the
chromo-phore, and it was here investigated by time-resolved pump–probe
UV–visible spectroscopy and TR-SFX. Spectroscopy in solution
provides evidence for the existence of four intermediate states
decaying with time constants of 87 ps, 5.57, 36.1 and 825 µs,
respectively. The latter two time constants are markedly affected
when experiments are carried out in D
2O instead of H
2O
solu-tion, changes compatible with a proton transfer step. The data
thus show that chromophore deprotonation takes place after
excited-state decay in the ground state, with time constants of
36.1 and 825 µs. The crystal structure obtained 10 ns after
pho-totriggering features a cis chromophore that is still in the
pro-tonated state, as inferred from the spectroscopic data and from
His149 HBI Off Trans1 (off) Tyr146 Off-like Cis (10 ns)
Fig. 5 Overlay of 10-ns intermediate-state and off-state structures. The chromophore regions in the 10-ns intermediate structure (cyan) and the laser-off model (gray) are shown. For the sake of clarity, only the major conformer (65% occupancy) of the laser-off model is shown. Note that His149 is hydrogen bonded to Tyr146 in the laser-off model and to the chromophore in the 10-ns intermediate structure.
e
3.1 Å 3.1 Å 3.5 Å 3.5 Å 2.8 Å 2.8 Å 3.8 Å 3.8 Å 2.6 Å 2.6 Å 2.4 Å 2.4 Åf
4.3 Å 4.3 Å 3.7 Å 3.7 Å 3.3 Å 3.3 Å 3.0 Å 3.0 Å 2.6 Å 2.6 Å 2.8 Å 2.8 Åb
NE2 NE2 ND1 ND1 2.6 Å 2.6 Å 2.4 Å 2.4 Å 2.9 Å2.9 Å 3.1 Å 3.1 Å 2.4 Å 2.4 Å 2.4 Å2.4 Å 2.0 Å 2.0 Åc
2.6 Å 2.6 Å 2.8 Å 2.8 Å 2.7 Å 2.7 Å 3.4 Å 3.4 Å 2.9 Å 2.9 Å 2.8 Å2.8 Å 3.2 Å 3.2 Åa
HBI HBI Off-like Off-like Off-like Thr204 Thr204 Ser206 Ser206 W356 W356 Asn147 Asn147 W361A W361A His149 His149 W361B W361B W377 W377 HBI HBI Ser206 Ser206 Glu223 Glu223 3.1 Å 3.5 Å 2.8 Å 3.8 Å 2.6 Å 2.4 Å 4.3 Å 3.7 Å 3.3 Å 3.0 Å 2.6 Å 2.8 Å NE2 ND1 2.6 Å 2.4 Å 2.9 Å 3.1 Å 2.4 Å 2.4 Å 2.0 Å 2.6 Å 2.8 Å 2.7 Å 3.4 Å 2.9 Å 2.8 Å 3.2 Å HBI Thr204 Ser206 W356 Asn147 W361A His149 W361B W377 HBI Ser206 Glu223d
Fig. 6 Overlay of 10-ns intermediate-state and on-state structures. Overlay (a, d) of the chromophore region in the 10-ns intermediate structure (cyan, b, e) and the on-state structure (yellow, c, f) determined from SFX at room temperature (PDB entry code 5O8927). The focus is on the phenol moiety of the
analysis of the hydrogen-bonding network at the chromophore
phenol group. In our earlier TR-SFX study
27, chromophore
twisting was observed in the excited state 1 ps after photoexciting
the off-state. Also, a low-occupancy population of a cis isomer
was found 3 ps after photoexcitation that indicated chromophore
isomerisation occurs in the excited state. Due to insufficient data
quality, however, no structural model could be built of the 3-ps
intermediate state
27. The present spectroscopic and structural
data unequivocally shows that the excited-state chromophore
isomerisation in rsEGFP2
27is followed by proton transfer in the
ground state.
The TR-SFX structure determined from data collected 10 ns
after triggering differs from the structure of the starting off-state
(Fig.
5
) and of the stable cis anionic on-state (Fig.
6
),
respec-tively, and corresponds to that of an intermediate state
(laser_on_Δ10 ns). Spectroscopy (see above) provides evidence
that the chromophore is still protonated at 10 ns
(Supplemen-tary Fig. 2 and Fig.
2
) so that the 10-ns intermediate corresponds
to a cis protonated photoproduct. In the 10-ns intermediate
structure, the side chain of His149 remains in an off-like
con-formation while the chromophore has isomerized (Figs. 4b and
6
b). His149 might be more disordered in the intermediate than
in the off-state structure, since there is a negative but no positive
peak on that residue in the F
obslaser_on_Δ10ns-F
obslaser_offmap.
The transition to the
final on-state conformation of His149 is
thus completed on a timescale longer than 10 ns. Notably, the
water molecule which is being hydrogen bonded to the
chro-mophore phenolate in the on-state (W356 in Fig.
6
a), and absent
in the off-state (Fig.
5
), is present at 10 ns (Fig.
6
b). Interestingly,
Thr204 adopts the same rotamer in the 10-ns intermediate and
the on-state structure (Fig.
6
a), whereas it is in different
rota-mers in 1-ps intermediate and in the off-state structure
27. In the
10-ns intermediate, the chromophore phenol group engages in
three H-bonds, i.e. His149NE2, W356 and Thr204OG1 (Fig.
6
b).
The 50% occupancy of the laser_on_Δ10 ns intermediate
exceeds the primary quantum yield of the off-to-on
photo-switching reaction (0.33
18). Indeed, the pump-laser parameters
chosen resulted in nominally 17 absorbed photons per
chromo-phore (cf. Methods) so that those molecules that after excitation
return to a hot trans ground state within a few ps
27and then
further evolve to the cold initial trans ground state can be excited
again during the 100-ps pump pulse. Additionally, intermediates
formed within 100 ps can also absorb and either drive the
reac-tion forward or generate off-pathway intermediates. The
time-resolved difference absorption spectra recorded at 40 and 100 ps
display values close to zero at 400 nm (Supplementary Fig. 1a),
indicating that the signals from ground-state depletion and an
arising intermediate state absorbing at 400 nm compensate.
Therefore, we cannot exclude that the laser_on_Δ10 ns
inter-mediate has partially evolved from an interinter-mediate absorbing at
400 nm during the 100 ps pump pulse.
During the transition from the laser_on_Δ10 ns intermediate
to the stable cis anionic on-state His149 moves from the off-like
conformation (Fig.
7
b) to its on conformation (Fig.
7
d). This
move could correspond to the process with a 5.57 µs time
con-stant determined by spectroscopy. Alternatively, the 5.57 µs
process could correspond to structural rearrangements elsewhere
in the protein and His149 would move to the on position
con-comitantly with chromophore deprotonation. A TR-SFX
experi-ment with a pump–probe delay of 20 µs would provide the
unknown structure (Fig.
7
c) prior to chromophore
deprotona-tion, therefore allowing to decide between the two alternative
scenarios. Changes in the H-bonding network around the
chro-mophore phenol group between the laser_on_Δ10 ns
inter-mediate and the cis anionic on-state structure (Fig.
6
) are
strikingly similar to the ones between the protonated A form and
the anionic B form of wild-type GFP
45. An exception is the
H-bond between the chromophore phenol and Thr204OG1
present in the laser_on_Δ10 ns intermediate structure but absent
in the protonated A form of wild-type GFP (Fig.
2
a in
45). The
laser_on_Δ10 ns intermediate structure allows proposing three
different pathways taken by the proton upon chromophore
deprotonation. On the
first pathway, the proton is transferred
from the chromophore via Thr204OG1 and His149O to the
solvent outside the protein as suggested for GFP
46. A proton
pathway between the solvent and the chromophore has also been
suggested to exist in the positive RSFP Padron
47,48. A second
pathway proceeds via His149 and a chain of three water
mole-cules (W377, W158, W144; only W377 is seen in Fig.
6
a)
con-nected to His149ND1 to the solvent. A third pathway guides the
proton via a Grotthuss mechanism involving W356 and W361
(Fig.
6
a, b) to the solvent.
The laser_off structure, determined from SFX data without
pump-laser excitation, features the chromophore in two trans
conformations, one of which (trans2, 25% occupancy) was not
previously observed in the off-state of rsEGFP2. The third
His149 conformation (His149-supp), included in the laser_off
structure in addition to the ones in the on (His149-on) and the
off (His149-off) states (Fig.
3
c) might correspond to the trans2
conformation of the chromophore to which it would be
H-bonded (distance of 2.7 Å between phenol oxygen and ND1).
Ensemble refinements against published off-state datasets
col-lected by room-temperature SFX
27and cryo-crystallography at a
synchrotron
18show no indication of trans2 and His149-supp
conformations (Supplementary Fig. 9). We do not yet have
an explanation for this structural off-state heterogeneity.
Evi-dence for the existence of a trans2 chromophore also comes from
Trans protonated
off-state Cis anionic
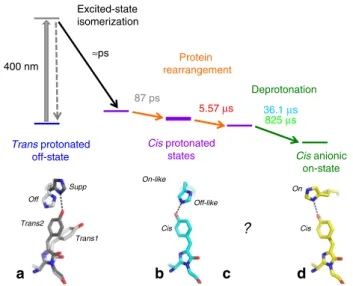
on-state Cis protonated states 5.57 μs 825 μs Excited-state isomerization Protein rearrangement ≈ps 400 nm Deprotonation 87 ps 36.1 μs Supp Off Trans1 Trans2 Cis Cis Off-like On-like
?
Ona
b
c
d
Fig. 7 Model for the rsEGFP2 off-to-on photoswitching process. The bold purple bar represents the laser_on_Δ10 ns intermediate structure determined by TR-SFX. Time constants correspond to those determined by femtosecond (87 ps) and nanosecond-resolved pump–probe UV–visible absorption spectroscopy (5.57, 36.1 and 825µs) in H2O solution (50 mM
HEPES pH 8, 50 mM NaCl). All three cis protonated states (purple bars) are ground-state intermediates, interconversion of which involves
rearrangements of the protein matrix (orange arrows). Corresponding structural models for the chromophore and His149 as determined by X-ray crystallography are shown in panelsa, b (this work) and d27. Trans1 and
His149-off (light gray) and trans2 and His149-supp (dark gray) of the trans-protonated off-state (a, Fig.3c) transited to cis and His149-off-like at 10 ns (b, Fig.4b, Fig.6b, e). His149-off-like has moved to His149-on in the cis anionic on state (d, Fig.6c, f). The structure whose intermediate forms in 5.57µs remains elusive (c).
cryo-crystallographic synchrotron experiments, in which
illu-mination at 488 nm of an rsEGFP2 variant with a substituted
phenolate ring yielded trans2 when crystals with a contracted
unit cell were examined, whereas the trans1 conformation is
populated when crystals with a larger unit cell were used
49. The
authors suggest the tighter packing of proteins in the contracted
crystal reduces the
flexibility of the chromophore pocket, thereby
limiting the volume available for the isomerizing chromophore
and favoring the volume-conserving cis - to - trans2 transition,
rather than the volume-consuming cis - to - trans1 transition.
Coincidentally, different illumination conditions were used for
the two datasets. We note that a chromophore conformation
similar to trans2 has been observed in rsFolder
18, a reversibly
switchable
fluorescent protein designed for efficient expression in
oxidizing cellular environments.
Based on the new results described here, we can now propose a
model for the rsEGFP2 off-to-on photoswitching process (Fig.
7
).
Excitation at 400 nm of the trans-protonated chromophore in the
off-state triggers excited-state isomerization to a cis chromophore
within a few picoseconds
27. After excited-state decay, there is an
evolution in the ground-state with a 87 ps time constant that we
assign to a protein reorganization to accommodate the cis
chro-mophore. The resulting intermediate state with a cis protonated
chromophore remains stable up to 100 ns (Supplementary Fig.
2) and was characterized by TR-SFX at 10 ns (purple bold bar in
Fig.
7
). Transient absorption spectroscopy in H
2O solution
evi-dences a further ground-state process with a time constant of
about 5.57 µs (no isotope effect) that might correspond to a
protein rearrangement during which the off-like conformation of
His149 transitions to the on conformation (Fig.
7
). Alternatively,
the conformational change in His149 could accompany
chro-mophore deprotonation that occurs with characteristic time
constants of 36.1 and 825 µs (isotope effect) to yield the
final cis
anionic on-state.
Together, the present and the preceding ultrafast studies
27clarify the order of off-to-on photoswitching events in rsEGFP2
(hydrozoan origin) and provide evidence for chromophore
iso-merization and deprotonation being excited-state and
ground-state processes, respectively. If the photoswitching mechanism
of RSFPs from Anthozoa is identical to the one from Hydrozoa,
our study would disagree with the proposed ground-state
iso-merization in Dronpa
14,15and provide unambiguous support to
the proposed excited-state isomerisation and ground-state
deprotonation
11–13. TR-SFX on Dronpa and TR-IR
spectro-scopy on rsEGFP2 would shed light on differences and
simila-rities in the photoswitching mechanisms of RSFPs from Anthozoa
and Hydrozoa.
Methods
Protein expression, purification, and crystallization. rsEGFP216fused to an
N-terminal polyhistidine tag was expressed in E. coli BL21 cells and purified by Ni-NTA affinity and size exclusion chromatographies18. For TR-SFX, rsEGFP2
microcrystals (3 × 3 × 3 µm3) were generated by seeding a solution withfinal
protein, precipitant, salt and buffer concentrations of ~20 mg/ml, ~2 M ammonium sulfate, 20 mM NaCl, 120 mM HEPES pH 8, respectively. Sedimented microcrystals were resuspended in 100 mM HEPES pH 8, 2.5 M ammonium sulfate prior to injection into the XFEL beam. A suspension containing 2–8% (v/v) microcrystals wasfiltered through a 20-µm stainless steel filter using a sample loop and a manually driven syringe.
H2O/D2O exchange of rsEGFP2 in solution. H2O/D2O exchange for nanosecond
transient absorption spectroscopy was performed by several cycles of dilution/ concentration. 450 µl of 50 mM HEPES pD 8, 50 mM NaCl were added to a tube containing 50 µl of rsEGFP2 at 20 mg/ml in 50 mM HEPES pH 8, 50 mM NaCl. Then the protein solution was concentrated to afinal volume of 100 µl using 10 kDa concentrators (Amicon 1 ml Centrifugal Filters 10 kDa Millipore). The dilu-tion/concentration cycle was repeated four times, so that the total dilution factor was at least 1000.
Time-resolved UV–visible absorption spectroscopy. Femtosecond transient absorption spectroscopy from 40 ps to 2 ns was carried out on rsEGFP2 (12.5 mg/ ml) in a H2O solution containing 50 mM HEPES pH 8, 50 mM NaCl according to
the protocol reported earlier27(Supplementary Fig. 1).
Nanosecond transient absorption spectroscopy experiments were carried out from 10 ns to 10 ms (Fig.2, Supplementary Figs. 2, 5, 7) using a conventional flash-photolysis setup (90° geometry between pump and probe beams, Supplementary Fig. 10)50on three rsEGFP2 solutions (46 µM): (i) 50 mM HEPES pH 8, 50 mM
NaCl in H2O, (ii) 50 mM HEPES pD 8, 50 mM NaCl in D2O, (iii) 50 mM HEPES
pH 8, 50 mM NaCl, 1.25 M (NH4)2SO4in H2O. Initially, the solutions (2 ml) were
illuminated for 3 min at 488 nm (Cobolt 06-MLD 488; 200 mW, 2 mm 1/e2waist
diameter) to photoswitch 90% of the proteins to the trans-protonated off-state (absorbance of about 1 at 410 nm for a 1 cm thickness). Pump beam (410 nm, 8 ns, 1.6 mJ, beam size approximately 1 mm × 10 mm) was focused using a cylindrical lens onto a spectroscopic cell (Hellma, chamber thicknesses 1 mm) containing the protein solution (Supplementary Fig. 10a). The time traces of the variation in absorbance were recorded from 350 to 520 nm in 10-nm steps (3.5 nm spectrometer bandpass) to reconstruct the transient difference absorption spectra at different time delays after the pump-pulse excitation. The recorded time traces were obtained by averaging a sequence of eight pump–probe experiments (laser energyfluctuation is below 0.1 mJ pulse-to-pulse and is not corrected). There was a time lapse of 30 s between two consecutive pump-pulse excitations. To photoswitch the proteins in the stationary solution back to the off-state after each 410 nm pump pulse the spectroscopic cell containing the stationary protein solution was illuminated continuously by 490-nm light (collimated Thorlabs LED M490L4, 200 mW, beam diameter 9 mm; Supplementary Fig. 10a). Time traces of the variation in absorbance can be analyzed only at and above 10 ns, given the 8-ns pump pulse length. A transient difference absorption spectrum at one time delay (t) is obtained by averaging 10 time delay points (from t−5 points to t + 5 points) of the time traces. Three time delay windows were explored from 10 ns to 5 µs (500 ps/point), from 5 µs to 100 µs (10 ns/point) and from 100 µs to 10 ms (1 µs/point).
For spectroscopy experiments on microcrystal suspensions (Supplementary Fig. 6), rsEGFP2 microcrystals (3 × 3 × 3 µm3) were suspended in 100 mM HEPES
pH 8, 2.5 M ammonium sulfate. Suspensions were initially irradiated for 30 min at 488 nm (Cobolt 06-MLD 488; 200 mW, 2 mm 1/e2waist diameter) to achieve
off-switching. For the subsequent ns–ms transient absorption experiment, the microcrystal suspension was placed in a spectroscopic cell (Hellma, chamber thickness 1 mm, Supplementary Fig. 10b). The conventionalflash-photolysis setup was modified (15° between pump and probe beams, Supplementary Fig. 10b) to minimize light scattering. The pump laser (410 nm, 8 ns, 5 mJ, beam diameter approximately 2 mm) was focused using a spherical lens onto the cell containing the microcrystal suspension. The probe light-source was not modified from conventional experiments. The diameter of both pump and probe beams was 2 mm through the spectroscopic cell. Following single-shot excitation, the time traces of the variation in absorbance were recorded from 350 to 520 nm in 10-nm steps (9.4 nm spectrometer bandpass) to reconstruct the transient difference absorption spectra at different time delays after the pump-pulse excitation. Between each single-shot excitation the cell was moved manually to probe a fresh area. Time traces of the variation in absorbance start to be meaningful at 500 ns. Time windows explored were from 500 ns to 100 µs (10 ns/point) and from 100 µs to 2 ms (200 ns/point).
For the analysis of transient absorption spectra, a model based on a weighted sum of three exponential decays was chosen tofit the kinetic traces for all wavelengths (globalfit analysis). This was done with Igor Pro and a custom-made analysis routine in python 3 using lmfit package51. The quality of thefit was
checked by analyzing the residuals (no structure, Supplementary Fig. 3) and the Levenberg-Marquardt algorithm was used to minimize least-squares error surface (χ2< 10−5). The reported values of the standard deviations of the parameters
correspond to the diagonal elements of the covariance matrix, which is the inverse of the so-called curvature matrix taken at the minimum of the error. By contrast to linearfitting, this matrix is not constant but a function of the fitting parameters for nonlinear modeling. Still, information on standard deviations can be derived but should, however, be interpreted with caution, keeping in mind the assumption that the set of parameters estimated is true. A more reliable estimation of the uncertainty would require replicated estimations of the nonlinear parameters on different datasets. These replicated datasets can be generated with bootstrap. Fitting these datasets provides different sets of parameters, whose means and standard deviations can be estimated from their distributions. The model was herefitted on 1000 replicated datasets constructed using the best parameters of thefit and adding replicates of noise (Supplementary Fig. 4). These replicates were obtained from the residuals (difference between the original and reconstructed data) randomly shuffling 25% of the values. Figures were made using Igor Pro and Searborn and matplotlib python 3 package.
SFX data collection. A suspension of rsEGFP2 microcrystals (2–8% (v/v) was transferred into a stainless steel syringe that was mounted on an anti-settling device52and whose temperature was maintained at 20 °C with an adjustable Peltier
element. The microcrystal suspension was injected with a gas dynamic virtual nozzle (GDVN53) injector into the helium-filled Diverse Application Platform for
at SACLA39(hutch temperature ca. 27 °C). The GDVN carried a sample capillary
of 100 µm inner diameter and operated atflow rates of 30–40 µl/min. Both para-meters, as well as the low microcrystal concentration, were critical to avoid microcrystal aggregation and thus nozzle-clogging that occurred at lowerflow rates and smaller nozzle diameters. The resulting jet had a diameter of 3–5 µm at a focusing helium pressure of 15 psi.
On their way from the sample syringe to the injector, rsEGFP2 microcrystals were photoswitched from their on-state (the resting state) to the off-state (see Fig.1) by irradiation with continuous 488-nm laser-light (cw, 200 mW) within a pre-illumination device40. The analysis of absorption spectra (Fig.6in40) obtained
from microcrystals collected at the exit of the device with (200 mW) and without pre-illumination indicated that approximately 90% of microcrystalline rsEGFP2 were switched off. The transit time from the pre-illumination device to the interaction zone was less than, or equal to, 1 min. This time interval is short compared to the off-to-on thermal recovery of microcrystalline rsEGFP2 (100 min40) so that 90% of the proteins were in their off-state when reaching
the interaction zone.
SFX data were collected at 30 Hz using an X-ray beam (nominal photon energy 10 keV, pulse length≤ 10 fs, 300 µJ per pulse at the sample position, 2 × 10¹¹
photons/pulse) focused to 1.4 µm (horizontal) × 1.6 µm (vertical) (FWHM). Diffraction data were recorded using an octal-MPCCD detector with eight sensor modules55positioned 52 mm away from the sample. Online monitoring of
diffraction data, such as determination of hit-rate and estimation of the fraction of multiple hits, was done with CASS56.
TR-SFX data were collected using an optical pump–X-ray probe scheme with a pump–probe delay of 10 ns. The off-to-on transition was triggered by a pump-laser pulse (400 nm, 100 ps pulse length, 180 µm × 180 µm focal spot (FWHM), 46 µJ per pulse, leading to a peak power density of 1.25 GW/cm2and corresponding
nominally to 17 absorbed photons per chromophore) generated by a Ti:sapphire laser, aligned perpendicularly to both the liquid jet and the X-ray beam. A sequence of interleaved laser_off and laser_on diffraction images was collected at 30 Hz. SFX data processing. A total of about 609,000 frames were collected for the laser_on_Δ10 ns and the laser_off datasets, respectively. NanoPeakCell57was used
to perform offline hit-finding and sort frames with and without prior pump-laser excitation into laser_on_Δ10 ns (13300 hits) and laser_off (12487 hits) datasets, respectively. CrystFEL 0.6.2 was used for further data processing (i.e. indexing and integration), resulting in 9781 and 9997 indexed frames for the laser_on_Δ10 ns and laser_off datasets, respectively. The“ring-nocen” method was used for intensity integration. The sample-detector distance was refined until the distribu-tion of unit-cell parameters was Gaussian58. Merging with the partialator module
of CrystFEL 0.6.2 was optimal when combining scaling and partiality refinement with the push-res option set to zero, as judged by Rsplit, CC* and the Wilson plot.
Data collection statistics are given in Supplementary Table 1.
Structure solution and refinement. The structure corresponding to the laser_off dataset was phased by molecular replacement using Phaser59with the structure of
rsEGFP2 in it off-state determined by synchrotron cryo-crystallography (PDB entry 5DTY18) as a starting model. Refinement with the Phenix suite60included
positional and isotropic individual B factor refinement in reciprocal space. Model building was carried out using Coot61and occupancies were set manually. Given
that the pre-illumination efficiency was approximately 90%40, an alternate
chro-mophore conformation corresponding to the cis isomer in the on-state was included at 10% occupancy. Accordingly, those residues adopting different con-formations in the on- and the off-states, i.e. part ofβ-strand 7 (residues 146 to 152), residues at the N- and C-terminus of the chromophore (residues 65 and 69), and Thr204, were alsofirst modeled in double conformations, (90% off and 10% on). When the remaining 90% were attributed to the trans isomer of the off-state, a negative peak in the Fobslaser_off–Fcalclaser_offmap indicated that the relative
occu-pancy must be lower than 90% and a positive Fobslaser_off–Fcalclaser_offpeak halfway
between the cis and the trans (called trans1 hereafter) isomers indicated the pre-sence of a third chromophore conformer (called trans2 hereafter) occupied at 25% or less (Fig.3a). Ensemble refinement against the laser_off dataset was carried out
with the Phenix suite starting from the off-state model (trans1 chromophore; Fig.3b). The values of pTLS, tbath and tx were varied, where pTLS is the fraction of the molecules included in the TLSfitting procedure, tbath is a parameter that controls the X-ray weight and that is coupled to the thermostat temperature and tx is the relaxation time used during the simulation. The tested values were 0.6, 0.8, 0.9 and 1.0 for pTLS, 2.5, 5 and 10 K for tbath, and 0.35, 0.7 and 1.4 ps for tx. Rfree
was plotted as a function of the different sets of parameter values using a custom-made python script. The lowest Rfreewas chosen as a criterion to determine the
most appropriate set of values of these three parameters. Ensemble refinement indicated the presence of a third chromophore conformation (trans2) and a third rotamer of His149 (His149-supp). Consequently, the chromophore and His149 were modeled with three alternate conformations, i.e. trans1, cis, trans2, and His149-off, His149-on, His149-supp, whose occupancies were jointly refined to 65% (alternate conformers A), 10% (alternate conformers B) and 25% (alternate conformers C), respectively (Fig.3c). Thr204 and residues inβ-strand 7 (positions 146-148 and 150-152) and at the N- and C-termini of the chromophore were also modeled in three alternate conformations and included in the occupancy
refinement. As a control, ensemble refinement was carried out against the off-state data collected by cryo-crystallography at a synchrotron18starting from the
cor-responding off-state model (chromophore 100% trans1, PDBcode5DTY18) and
against the off-state data collected by room temperature SFX27starting for the
corresponding off-state model (PDBcode5O8A) from which the cis alternate conformation was omitted so that the chromophore was fully in the trans1 con-formation27. The same procedure was applied and the set of parameters yielding
the lowest Rfreevalues were ptls= 0.8, bath = 5, tx = 2.0 for 5DTY and ptls = 0.8,
bath= 5, tx = 2.0 for 5O8A. Neither trans2 and nor His149-supp, conformations were occupied (Supplementary Fig. 9).
Structural changes 10 ns after pump-laser excitation were qualitatively identified in a q-weighted41(qW) difference Fourier electron density map (Fobslaser_on_Δ10ns–
Fobslaser_off), calculated with the laser_off structure as a phase model using CNS62
(Fig.4a). For further analysis, extrapolated structure factors (Fext) were calculated
based on the q-weighted structure factor amplitude differences according to the following formula: Fextlaser_on_Δ10ns= α * q/ < q > * (Fobslaser_on_Δ10ns–
Fobslaser_off)+ Fobslaser_off(eq. 1), whereα is the inverse of the estimated occupancy of
the fraction of molecules that changed conformation upon photoexcitation and q is the Bayesian weight retrieved through the q-weighting procedure41. To determineα, a
procedure reported earlier27was applied, i.e. F
extrapolatedlaser_on_Δ10nswere calculated
and the ratio of integrated peaks in the Fextrapolatedlaser_on_Δ10ns–Fcalclaser_offmap and of
integrated peaks in the qW Fobslaser_on_Δ10ns–Fobslaser-offmap was plotted as a function
ofα (Supplementary Fig. 8). Only peaks in the vicinity of the chromophore, Tyr146, His149, Val151, and Thr204 were integrated. The most appropriate value ofα is the one at a maximum is reached, i.e. 2 in the present case (Supplementary Fig. 8). Anα of 2 corresponds to an occupancy of 50% of the laser_on_Δ10 ns intermediate structure. The laser_on_Δ10 ns intermediate structure was refined using the difference refinement procedure, and 2Fextrapolatedlaser-on-Δ10ns–Fcalcand Fextrapolated
laser-on-Δ10ns–Fcalcelectron density maps were used to build the model. The same
procedure as for the laser-off model was followed. Refinement statistics are given in Supplementary Table 1. Figures were prepared using PyMOL63.
Data availability
Coordinates and structure factors have been deposited in the Protein Data Bank under accession codes 6T39, 6T3A. The source data underlying Supplementary Fig 8 are provided as a Source Datafile. Other data are available from the corresponding authors upon reasonable request.
Received: 28 May 2018; Accepted: 6 January 2020;
References
1. Nienhaus, K. & Nienhaus, G. U. Fluorescent proteins for live-cell imaging with super-resolution. Chem. Soc. Rev. 43, 1088–1106 (2014).
2. Adam, V., Berardozzi, R., Byrdin, M. & Bourgeois, D. Phototransformable fluorescent proteins: Future challenges. Curr. Opin. Chem. Biol. 20C, 92–102 (2014).
3. Hofmann, M., Eggeling, C., Jakobs, S. & Hell, S. W. Breaking the diffraction barrier influorescence microscopy at low light intensities by using reversibly photoswitchable proteins. Proc. Natl Acad. Sci. USA 102, 17565–17569 (2005).
4. Gustafsson, M. G. L. Nonlinear structured-illumination microscopy: wide-field fluorescence imaging with theoretically unlimited resolution. Proc. Natl Acad. Sci. USA 102, 13081–13086 (2005).
5. Nienhaus, K. & Nienhaus, G. U. Photoswitchablefluorescent proteins: do not always look on the bright side. ACS Nano 10, 9104–9108 (2016).
6. Brakemann, T. et al. A reversibly photoswitchable GFP-like protein with fluorescence excitation decoupled from switching. Nat. Biotechnol. 29, 942 (2011).
7. Andresen, M. et al. Structural basis for reversible photoswitching in Dronpa. Proc. Natl Acad. Sci. USA 104, 13005–13009 (2007).
8. Habuchi, S. et al. Reversible single-molecule photoswitching in the GFP-likefluorescent protein Dronpa. Proc. Natl Acad. Sci. USA 102, 9511–9516 (2005).
9. Ando, R., Mizuno, H. & Miyawaki, A. Regulated fast nucleocytoplasmic shuttling observed by reversible protein highlighting. Science 306, 1370–1373 (2004).
10. Fron, E. et al. Ultrafast excited-state dynamics of the photoswitchable protein Dronpa. J. Am. Chem. Soc. 129, 4870–4871 (2007).
11. Warren, M. M. et al. Ground-state proton transfer in the photoswitching reactions of thefluorescent protein Dronpa. Nat. Commun. 4, 1461 (2013). 12. Kaucikas, M., Tros, M. & van Thor, J. J. Photoisomerization and proton
transfer in the forward and reverse photoswitching of the fast-switching M159T mutant of the Dronpafluorescent protein. J. Phys. Chem. B 119, 2350–2362 (2015).