Publisher’s version / Version de l'éditeur:
Vous avez des questions? Nous pouvons vous aider. Pour communiquer directement avec un auteur, consultez la première page de la revue dans laquelle son article a été publié afin de trouver ses coordonnées. Si vous n’arrivez pas à les repérer, communiquez avec nous à PublicationsArchive-ArchivesPublications@nrc-cnrc.gc.ca.
Questions? Contact the NRC Publications Archive team at
PublicationsArchive-ArchivesPublications@nrc-cnrc.gc.ca. If you wish to email the authors directly, please see the first page of the publication for their contact information.
https://publications-cnrc.canada.ca/fra/droits
L’accès à ce site Web et l’utilisation de son contenu sont assujettis aux conditions présentées dans le site LISEZ CES CONDITIONS ATTENTIVEMENT AVANT D’UTILISER CE SITE WEB.
Procedia Manufacturing, 34, pp. 269-274, 2019-07-18
READ THESE TERMS AND CONDITIONS CAREFULLY BEFORE USING THIS WEBSITE. https://nrc-publications.canada.ca/eng/copyright
NRC Publications Archive Record / Notice des Archives des publications du CNRC :
https://nrc-publications.canada.ca/eng/view/object/?id=d9571180-40cb-4f07-9f0b-0a0452e48789
https://publications-cnrc.canada.ca/fra/voir/objet/?id=d9571180-40cb-4f07-9f0b-0a0452e48789
NRC Publications Archive
Archives des publications du CNRC
This publication could be one of several versions: author’s original, accepted manuscript or the publisher’s version. / La version de cette publication peut être l’une des suivantes : la version prépublication de l’auteur, la version acceptée du manuscrit ou la version de l’éditeur.
For the publisher’s version, please access the DOI link below./ Pour consulter la version de l’éditeur, utilisez le lien DOI ci-dessous.
https://doi.org/10.1016/j.promfg.2019.06.150
Access and use of this website and the material on it are subject to the Terms and Conditions set forth at
Effect of initial surface topography during laser polishing process:
statistical analysis
ScienceDirect
ScienceDirect
www.elsevier.com/locate/procedia
Procedia Manufacturing 34 (2019) 269–274
2351-9789 © 2019 The Authors. Published by Elsevier B.V.
This is an open access article under the CC BY-NC-ND license (http://creativecommons.org/licenses/by-nc-nd/3.0/) Peer-review under responsibility of the Scientiic Committee of NAMRI/SME.
10.1016/j.promfg.2019.06.150
© 2019 The Authors. Published by Elsevier B.V.
This is an open access article under the CC BY-NC-ND license (http://creativecommons.org/licenses/by-nc-nd/3.0/) Peer-review under responsibility of the Scientiic Committee of NAMRI/SME.
47th SME North American Manufacturing Research Conference, Penn State Behrend Erie,
Pennsylvania, 2019
Keywords: Laser polishing, surface quality, statistical analysis, initial topography, laser power, travel speed, roughness
1. Introduction
Laser polishing (LP) is one of the advanced manufacturing surface finishing techniques that has been continuously developed over the past two decades [1-6] and successfully employed for improving the surface morphologies of components made from various ferrous and non-ferrous materials. LP achieves good surface finishing without deteriorating the overall structural form through surface smoothing by melting and redistributing a thin layer of molten
material over the surface through surface tension attempting to minimize surface energy. Since there is no material removal, the form of the given geometric feature is preserved. LP as one of the advanced manufacturing, knowledge-based technologies opens new avenues in cost effective manufacturing of value-added parts, components and tooling with complex 3D geometry eliminating manual or other types of finishing operations and significantly reducing overall tooling cost (up to 40%) and manufacturing time (up to 30%). The efficiency of LP technology is already proven since it has shown improvements of the surface quality as high as ~90% (from Sa
= 1.35 um before to Sa= 0.18 um after LP, respectively) [7].
One of the main research and application challenges preventing the conversion of LP into a conventional technology is related to the lack of fundamental understanding on how the initial surface geometry influences the formation of LPed surface topography [8]. The team of researchers from Fraunhofer ILT has identified that one critical aspect of the LP Nomenclature
CF coherence function LP laser polishing TF transfer function
hini(x,y) initial 2D surface topography
hLP(x,y) LPed 2D surface topography
Ra profile average surface roughness
Evgueni Bordatchev
a,b,*
,1, Srdjan Cvijanovic
b,a,1, O. Remus Tutunea-Fatan
b,a,*aNational Research Council of Canada, London, Ontario, Canada, N6G 4X8 bWestern University, London, Ontario, Canada, N6A 3K7
* Corresponding authors. Tel.: +1-226-688-5604; fax: +1-519-430-7064. E-mail: evgueni.bordatchev@nrc-cnrc.gc.ca / rtutunea@eng.uwo.ca;1
first authors
Abstract
Surface finish is one of the most important quality characteristics of fabricated components. Laser polishing (LP) is one of the advanced manufacturing surface finishing techniques that has been recently developed and successfully employed for improving surface quality without deteriorating the overall structural form through surface smoothing by melting and redistributing a thin layer of molten material. This paper advances the statistical analysis of the LP process emphasizing aspects of the effect of the initial surface topography. Flat and ground initial surfaces are used for comparative statistical analysis of initial and polished profiles obtained experimentally. Their profile geometries and surface quality characteristics, such as, roughness, were compared and analyzed. In addition, LP process was experimentally investigated as a thermodynamic operator represented by a transfer function and it was examined by means of a coherence function.
Effect of initial surface topography during laser polishing process:
Statistical analysis
270 Evgueni Bordatchev et al. / Procedia Manufacturing 34 (2019) 269–274
process: LPed surface topography is formed by two processes – LP of the flat bulk material and LP of the initial surface topography (seen as deviations from the flat bulk material). In addition, two classes of the surface structures formed by the LP process were identified and thoroughly studied: a) surface structures produced by the dynamics of the melt and solidification front (ripples, undercuts), and b) surface structures produced by plastic deformation and changes in the microstructure (bulges, step structures, and martensite needles).
A different view on related aspects pertaining LP melting and redistribution was demonstrated in [9]: shallow surface melting (SSM) and surface over melting (SOM) effects were identified as dependent on the thickness of the melted layer. SSM regime was defined as being characterized by a melted layer thickness smaller than peak-to-valley distance such that molten peaks will flow down to valleys under the capillary pressure. This is also usually termed as capillary regime [10] in which high spatial frequencies are smoothed by surface tension and viscosity. When melted layer thickness is greater than the peak-to-valley distance, the SOM regime occurs and initial surface topography completely disappears. This case constitutes the so-called thermocapillary regime [10] according to which LPed topography with dominant low spatial frequency components is generated by high temperature gradients on the rapid solidification front. Despite the discrepant terminologies, the common and most critical conclusion of [8-10] is that these two regimes are typically lumped, in a sense that they take place simultaneously during LP. As a result, final Pled surface quality will be defined by the regime with a dominating performance. However, this also opens new opportunities in achieving best possible or desired surface quality through process parameters optimization aiming to control the effects of each regime.
In this context, the main objective of the current study was to demonstrate and characterize the differences in the surface topography formation having initial flat and ground surfaces for the same LP process parameters. Statistical modelling and analysis methodologies that were previously proposed [11] were utilized to separate the effects of the laser melting and solidification of both solid bulk material and initial surface topography. Several comprehensive statistical functions, such as transfer and coherence functions were employed to describe a statistical digital twin of the LP process and to demonstrate the dynamics of the LPed surface topography formation with respect to the laser power and travel speed and separate contributing surface formation processes. Overall, this manuscript aims to develop fundamental knowledge thorough understanding, and to establish additional engineering foundations of the LP technology by emphasizing aspects of surface quality characterization.
2. Statistical digital twin of the laser polishing process Laser polishing (LP) process is a CNC-based technology where continuous or pulsed laser beam is travelling in accordance with a laser path trajectory for material melting, redistribution and solidification. Laser beam produces a continuous molten pool of the material moving it within prespecified area and smoothing the initial surface topography. The geometry and the volume of material polished depend on
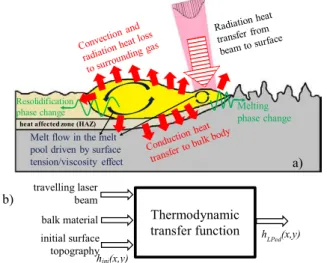
Fig. 1. Generalized schematics of the LP process (a) and its statistical digital twin (b).
the material properties and the laser-material interaction process parameters as related to laser, optics and motion. Fig. 1a shows the schematics of the LP process, which has a main functional goal to smooth the original surface geometry to a desired polished surface through laser-material interactions and by means of a set of process parameters related to machined material, laser, optics and laser beam motions.
Taking into account the main functional goal of LP to modify the geometry of original surface in order to achieve a better surface quality, LP process can be understood as a thermodynamic transformation of the original hini(x,y) into the
polished hLP(x,y) surface topography. It is common to represent
surface geometry as a 1D (e.g., surface profile) or 2D (e.g., surface area) spatial random process, in which surface amplitude is a random variable of one, h(x), or two, h(x,y), surface coordinates, respectively. Therefore, by means of control theory and correlation/spectral analysis [12] of dynamic systems and LµP schematics as shown in Fig. 1b, LP process can be considered as a mathematical operator W(.) as a transfer function (TF). In spatial domain, this transformation can be described by the classical convolution integral surface geometry in 1D case for surface cross-sections [12]:
∫
+∞ ∞ − − = η η η η w h x d hLP( ) ( ) ini( ) (1)where w(η) is the weighting function representing a statistical digital twin of the LP process in spatial domain. Fourier transformation of Eq. 1 produces a direct spatial frequency domain description of the LµP given as:
2 ) ( ) ( ) (ω S ω W jω
SLP = ini ,
S
ini−LP(
j
ω
)
=
S
ini(
ω
)
W
(
j
ω
)
, (2)where W(jω) is the transfer function of LP process; Sini(ω),
SLP(ω) and Sini-LP(jω) are the autospectrums and cross-spectrum
of original and polished surface profiles, respectively; ω is the spatial frequency, and j=√-1 is the imaginary unit.
The description presented above allows the understanding
Melt flow in the melt pool driven by surface tension/viscosity effect Resolidification
phase change Melting
phase change
heat affected zone (HAZ)
a) Thermodynamic transfer function travelling laser beam balk material initial surface topography hini(x,y) hLPed(x,y) b)
and modelling LP process as a thermodynamic dynamic system including aspects of the laser-material interactions and physical-mechanical material properties. In this case, a complete description of LP process is only possible when both statistical characteristics of original and polished surfaces and dynamic characteristics of LµP process as a thermodynamic operator will be known and identified.
3. Experimental and surface analysis methodology The experimental set-up for the LP process is shown in Fig. 2. The LP system is a complex opto-electro-mechanical CNC-controlled system and consists of a high-precision 3-axis motion system and a 1070 nm, 500 W continuous wave laser from IPG Photonics (model YLR-500). The motion system is controlled by a CNC motion controller from Aerotech with a position resolution of 0.1μm such that accuracy and repeatability of laser beam motions was ensured. In addition, to allow highspeed 2D scanning within 100 x 100 mm working envelope, the laser beam was directed to a 2-axis galvanometric scanning head, manufactured by ScanLab and with an f-theta objective having a focal length of 160 mm. Laser focal position was defined through single spot tests.
Fig. 2. Generalized schematic of the LP system.
The surface topography analysis methodology consisted of three primary steps: a) measurement of original surface geometry hini(x,y) between alignment marks, b) performing LP
experiments on previously measured surface, and c) measurement of LPed surface geometry hLP(x,y) using marks
for alignment with respect to the original surface profile. The sample surfaces before and after polishing were measured using a WYKO NT1100 white light interferometer, having a 1Å height measurement resolution. The pixel resolution of the surface scan was 0.258μm, and auto-stitching technique was applied to increase the measuring envelope. Digitized hini(x)
and hLP(x) were used for calculating two critical statistical
characteristics, e.g. transfer (TF) and coherence (CF) functions [12], for comprehensive description of the surface topography thermodynamic transformation during LP process.
Two sets of LP experiments were performed on H13 tooling steel samples varying laser power from 25 W to 100 W and travel speed from 250 mm/s to 1000 mm/s. Most critical and unique aspects of these LP experiments are that two H13 samples have significantly different initial surface topography: ground and perfectly flat shown in Figs. 3 and 4, respectively. This selection represents the primary focus of this study, namely to statistically analyze the effect of initial surface topography on LP process in order to enhance its digital twin.
Fig. 3. LPed sample with ground initial surface.
Fig. 4. LPed sample with initially flat surface.
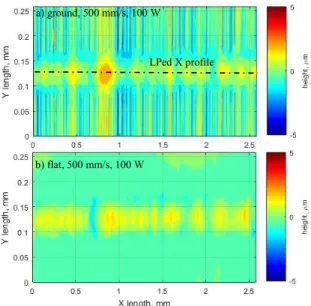
Fig. 5. Typical 3D topography of ground and flat surfaces.
Laser Mirror Objective lens Z-stage Argon shielding Workpiece Stage Motion subsystem Optic/laser subsystem Control subsystem power W speed mm/s 100 1000 75 50 25 100 750 75 50 25 100 500 75 50 25 100 250 75 50 25 1 mm power W speed mm/s 100 1000 75 50 25 100 750 75 50 25 100 500 75 50 25 100 250 75 50 25 1 mm LPed X profile a) ground, 500 mm/s, 100 W b) flat, 500 mm/s, 100 W
272 Evgueni Bordatchev et al. / Procedia Manufacturing 34 (2019) 269–274
Ground initial surface represents a variety of spatial frequencies of the topography having a profile average roughness Ra= 0.75…0.98μm. Initial surface of a flat sample
was machined by single point diamond cutting and yielded Ra= ~0.033μm over the entire area. Typical 3D topographies
of ground and flat initial surfaces with examples of LPed lines are shown in Fig. 5. LPed lines were produced with a length of 3 mm, however only central 2.5 mm length was used for statistical analysis where steady state LP takes place. For this feasibility study, only notable dissimilar pairs of LP process parameters were selected from the range of performed experiments in order to differentiate the effects of laser power and travel speed on surface topography formation. Thus, LP experiments performed with a laser power of 25 W and 100 W and with a travel speed of 500 mm/s were used for analysis of the laser power effect and experiments performed with a travel speed of 250 mm/s and 750 mm/s and with a laser power of 75 W were used for analysis of the travel speed effect.
4. Surface topology characterization of LPed samples with initially ground surface
Effect of the laser power on ground initial surface topography was studied by comparing initial and LPed profiles hini(x) and hLP(x) and statistical interdependence characteristics
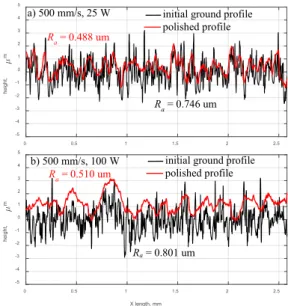
between them, such as TF and CF. Fig. 6 shows comparative analysis of the ground initial and LPed profiles. The focus of this analysis is on how LP with different levels of laser power changes thermodynamic self-organizational distribution of the molten material in longitudinal direction under dynamic surface tension and capillary flow. However, it should be kept in mind that these are only specific cases drawn from a more complex 3D thermo-dynamic phenomenon [7]. Several other important observations can also be drawn from this analysis. Firstly, laser power critically contributes to the effectiveness of the LP process as 34.6% was achieved for a laser power of 25 W at 500 mm/s travel speed reducing Rafrom 0.746μm to
0.488μm (see Fig. 6a) as LP with a laser power of 100 W reduced Rafrom 0.801μm to 0.510 μm (see Fig. 6b) gaining
very similar 36.3% surface quality improvement. However, the areal distributions of the molten material are completely different for these two cases. Low-power LP is smoothing surface profile very lightly and thus acts as a statistical moving averaging of the surface profile. This can be confirmed by a calculated mean value for both ground and flat initial profiles – -0.031μm and 0.376 μm, respectively. As such, the bulging effect lifts initial surface profile by 0.407μm. However, for the higher level of power, LPed surface profile was moved up by 1.204μm. In this case, the bulging effect is three times smaller and acts as an amplitude modulator for the initial profile.
Such observations can be supported by the comparative analysis of the TF and CF shown in Figs. 7 and 8, respectively. It is evident, that TF25 Wand CF25 Whave much wider width
than TF100 Wand TF100 Wmeaning that linear thermo-dynamic
transformation of the initial into LPed profiles occurs in this range of the spatial frequencies. Both LP processes with low (25 W) and high (100 W) laser power perform as expected as a low-pass filter [10, 11], however, with different cut-off frequencies. It also can be observed that LP100 Wamplifies
low-frequency components more than LP25 W up to a spatial
Fig. 6. Effect of the laser power on ground surface topography.
Fig. 7. Transfer function of ground surfaces LPed with 25 W and 100 W.
Fig. 8. Coherence function of ground surfaces LPed with 25 W and 100 W.
frequency of ~5 mm-1, while TF
25 W gradually reduces
amplitudes of the initial profile frequency components. It is known [12] that linear dynamic models can be applied only when CF > 0.7…0.8, and therefore statistical digital twin can be applied for the surface profile transformation preferably for the low laser power LP process. LP100 W has statistical
correlation with initial surface profile only in a waviness range (e.g. up to 1.25 mm-1 for a cut-off length of 0.8 mm per
ISO 4288). Therefore, classic thermodynamic LP models may be only applied for surface profile and waviness formations.
0 0.5 1 1.5 2 2.5 X length, mm -5 -4 -3 -2 -1 0 1 2 3 4 5 height, m
initial ground profile polished profile a) 500 mm/s, 25 W 0 0.5 1 1.5 2 2.5 X length, mm -5 -4 -3 -2 -1 0 1 2 3 4 5 height, m b) 500 mm/s, 100 W Ra= 0.801 um Ra= 0.510 um Ra= 0.488 um Ra= 0.746 um
initial ground profile polished profile 0.0 0.2 0.4 0.6 0.8 1.0 1.2 1.4 0 20 40 60 80 100 120 a m pl it ude , di m e ns io nl e ss spatial frequency, 1/mm 500-25W 500-100W 0.0 0.1 0.2 0.3 0.4 0.5 0.6 0.7 0.8 0.9 1.0 0 20 40 60 80 100 120 a m pl it ude , di m e ns io nl e ss spatial frequency, 1/mm 500-25W 500-100W
Fig. 9. Effect of the travel speed on ground surface topography.
Fig. 10. Transfer function of ground surfaces LPed with 250 and 750 mm/s.
Fig. 11. Coherence function of ground surfaces LPed with 250 & 750 mm/s.
The effect of the travel speed on ground initial surface topography is shown in Figs. 9-11. The comparison of initial and LPed profiles hini(x) and hLP(x) (see Fig. 9) demonstrates an
effect similar to laser power effect according to which low travel speed LP acts as a moving average and smooths mainly high frequency components. This is also confirmed by TF250
and TF750(see Fig. 10) and CF250and CF750(see Fig. 11) having
a similar cut-off frequency ~7 mm-1whereas TF
750amplifies
waviness components more than TF250.
Fig. 12. Effect of the laser power on flat surface topography.
Fig. 13. Transfer function of flat surfaces LPed with 25 W and 100 W.
Fig. 14. Coherence function of flat surfaces LPed with 25 W and 100 W.
5. Surface topology characterization of LPed samples with initially flat surface
The analysis of the 3D topography formation on flat initial surface represents a pure thermodynamic effect of the LP process on a bulk material since surface topography variations are below 30 nm. Such LP experiments can be also used for the verification of thermodynamic modelling with initially flat surfaces [7]. 0 0.5 1 1.5 2 2.5 X length, mm -5 -4 -3 -2 -1 0 1 2 3 4 5 height, m
initial ground profile polished profile a) 250 mm/s, 75 W Ra= 0.544 um Ra= 0.895 um 0 0.5 1 1.5 2 2.5 X length, mm -5 -4 -3 -2 -1 0 1 2 3 4 5 height, m
initial ground profile polished profile b) 750 mm/s, 75 W Ra= 0.877 um Ra= 0.982 um 0.0 0.2 0.4 0.6 0.8 1.0 1.2 1.4 0 20 40 60 80 100 120 a m pl it ude , di m e ns io nl e ss spatial frequency, 1/mm 250-75W 750-75W 0.0 0.1 0.2 0.3 0.4 0.5 0.6 0.7 0.8 0.9 1.0 0 20 40 60 80 100 120 a m pl it ude , di m e ns io nl e ss spatial frequency, 1/mm 250-75W 750-75W 0 0.5 1 1.5 2 2.5 X length, mm -5 -4 -3 -2 -1 0 1 2 3 4 5 height, m 0 0.5 1 1.5 2 2.5 X length, mm -5 -4 -3 -2 -1 0 1 2 3 4 5 height, m
initial flat profile polished profile a) 500 mm/s, 25 W b) 500 mm/s, 100 W Ra= 0.033 um Ra= 0.391 um Ra= 0.099 um Ra= 0.033 um
initial flat profile polished profile 0 5 10 15 20 25 30 35 0 20 40 60 80 100 120 a m pl it ude , di m e ns io nl e ss spatial frequency, 1/mm 500-25W 500-100W 0.0 0.1 0.2 0.3 0.4 0.5 0.6 0.7 0.8 0.9 1.0 0 20 40 60 80 100 120 a m pl it ude , di m e ns io nl e ss spatial frequency, 1/mm 500-25W 500-100W
274 Evgueni Bordatchev et al. / Procedia Manufacturing 34 (2019) 269–274
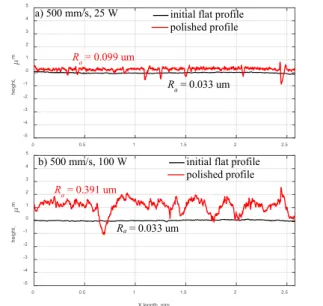
The effect of the laser power on flat initial topography is shown in Figs. 12. The comparison of initial and LPed profiles for LP25 Wand LP100 Wdemonstrates that significant variations
in the LPed topography occur even at low laser power due to the bulk material-laser interactions resulting in forming bulging geometry of the laser track. It was found that the mean value for the LP25 Wwas -0.029 µm and 0.263 µm for LP100 W. Thus,
the bulging effect lifts the initial profile by 0.292μm. However, for the higher level of power, LPed profile was moved up by 0.882μm. These values of the bulging effect are somewhat lower than for the ground initial surface. An additional possible reason for the lower bulging values can reside in a higher reflectance value of the flat initial surface. The analysis of the TF and CF shown in Fig. 13 and 14, respectively, does not uncover any statistically meaningful information since there is no formation of the periodical structures in the LPed profiles. This result was expected as bulk material-laser interactions are predominantly a non-linear thermodynamic process with self-organization of the LPed topography due to the surface tension, molten material flow viscosity, and capillary effects.
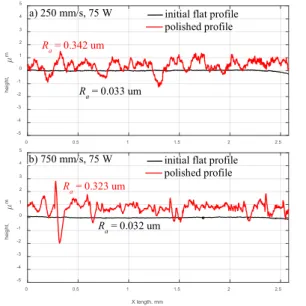
The effect of the travel speed on flat initial topography is shown in Fig. 15. Travel speed seems to have a smaller impact of the formation of LPed topography than laser power. This observation is based on the fact that for significantly different travel speeds (250 mm/s and 750 mm/s) Ravalues of LPed lines
are very similar, e.g. 0.342μm and 0.323 μm, respectively. In contrast, laser powers of 25 W and 100 W, yield Ravalues of
0.099 µm and 0.391 µm, respectively (see Fig. 12).
5. Summary and conclusions
This study presents an advanced statistical analysis of the LP process that emphasizes the effect of initial surface topography. Flat and ground initial surfaces were used for comparative statistical analysis of initial and polished profiles obtained experimentally. Profile geometries and surface quality characteristics, e.g., roughness, were compared and analyzed. In addition, LP process was experimentally assimilated with a thermodynamic operator represented by a transfer function and it was examined by means a coherence function. The following conclusions can be drawn from the results above:
• LP is a complex physical-thermo-dynamic process, in which in addition to laser, optics, material, and motion related parameters, original surface geometry also plays a critical role on the formation of the polished surface.
• Formation of the LPed surface topography includes a bulging effect and involves two major processes: bulk material-laser interactions and an additional effect from the non-uniform initial surface.
• Contributions brought by the two processes are not linear and smoothing a given material and initial surface can be only achieved when the effect of the polishing process itself on the bulk material will be as minimal as possible.
• Travel speed affects roughness of the LPed lines significantly more than laser power.
• Future research and full analysis of the performed LP experiments will need to continue the development of fundamental/engineering foundation for the LP technology.
Fig. 15. Effect of the travel speed on flat surface topography.
Acknowledgements
This study is the result of collaboration between the National Research Council of Canada (London, Ontario) and Western University (London, Ontario). Partial financial support was also provided by the Natural Sciences and Engineering Research Council (NSERC) of Canada.
References
[1] Willenborg E. Polieren von werkzeugstählen mit laserstrahlung, Dissertation RWTH Aachen, Shaker Verlag Aachen 2006 [2] Willenborg E. Polishing with laser radiation. In: Poprawe R, editor:
Tailored Light 2: Laser Allication Technology., 2011. P. 196-202 [3] Temmler A, Willenborg E, Wissenbach K. Laser polishing. Proceedings
of SPIE 8243: paper 82430W, 13 p.
[4] Pfefferkorn FE, Duffie NA, Li X, Vadali M, Ma C. Improving surface finish in pulsed laser micro polishing using thermocapillary flow. CIRP Annals - Manufacturing Technology 2013; 62:203–206
[5] Pfefferkorn FE and Morrow JD. Controlling surface topography using pulsed laser microstructuring. CIRP Annals-Manuf Tec 2017; 66:241-244 [6] Bordatchev EV, Hafiz AMK, Tutunea-Fatan OR. Performance of laser
polishing in finishing of metallic surfaces. Int J Adv Manuf Technol 2014; 73:35–52
[7] Mohajerani S, Bordatchev EV, Tutunea-Fatan RO. Recent developments in modeling of laser polishing of metallic materials. Lasers in Manuf and Materials Processing, published on-line 28 Sept 2018; 35 p.
[8] Nusser C, Kumstel J, Kiedrowski T, Diatlov A, and Willenborg E. Process- and material-induced surface structures during laser polishing. Advanced Engineering Materials 2015; 3:268-277
[9] Ukar E, Lamikiz A, López de Lacalle LN, del Pozo D, Arana JL. Laser polishing of tool steel with CO2laser and high-power diode laser. Int J
Mach Tool Manuf 2010; 50:115–125
[10] Pf efferkorn, F.E., Duffie, N.A., Li, X., Vadali, M., Ma, C. (2013). Improving surface finish in pulsed laser micro polishing using thermocapillary flow. CIRP Annals – Manuf Tech, 62, 203-206 [11] Chow MTC, Hafiz AMK, Tutunea-Fatan OR, Knopf GK, Bordatchev
EV. Experimental statistical analysis of laser micropolishing process. In: Proceedings of the International Symposium on Optomechatronic Technologies (ISOT) 2010, Toronto, Canada, 6 pp.
[12] Bendat JS and Piersol AG. Engineering applications of correlation and spectral analysis, John Wiley & Sons, New York NY USA, 1993
0 0.5 1 1.5 2 2.5 X length, mm -5 -4 -3 -2 -1 0 1 2 3 4 5 height, m 0 0.5 1 1.5 2 2.5 X length, mm -5 -4 -3 -2 -1 0 1 2 3 4 5 height, m
initial flat profile polished profile a) 250 mm/s, 75 W
Ra= 0.342 um
Ra= 0.033 um
initial flat profile polished profile b) 750 mm/s, 75 W
Ra= 0.323 um
