Faculté des Sciences Economiques Avenue du 1er-Mars 26
CH-2000 Neuchâtel
PhD Thesis submitted to the Faculty of Economics and Business
Institute of Economic Research University of Neuchâtel
For the degree of PhD in Economics by
Luciano LÓPEZ
Accepted by the dissertation committee:
Prof. Milad ZARIN-NEJADAN, University of Neuchâtel, thesis director
Prof. Alain SCHÖNENBERGER, University of Neuchâtel, president of the committee Prof. Mak ARVIN, Trent University, Canada
Prof. Gilles CARBONNIER, Graduate Institute of International and Development
Studies, Geneva
Dr. Sylvain Weber, University of Neuchâtel
Defended on September 6th, 2018
The Impact of Official Development Assistance on the Donor’s
Economy: The Case of Switzerland
Acknowledgments
As many of my predecessors wrote in their “acknowledgments” section, writ-ing a PhD thesis is difficult, if not impossible, without support of all kind. I can attest, they were right.
First of all, I want to thank my PhD supervisor, Prof. Milad Zarin-Nejadan, for giving me the opportunity to write a thesis under his supervi-sion. I have obviously benefited a lot from his valuable comments throughout the years but above all, from his benevolence. I also thank him for being such a dedicated and passionate teacher. He is a source of inspiration in my day to day life as teacher myself.
I also want to thank my co-authors, Prof. Alain Schönenberger and Dr. Sylvain Weber. It is without a doubt when writing those chapters with you that I felt myself the most fulfilled.
I would like to express my most sincere gratitude to Prof. Mak Arvin for his valuable comments on my chapters and for hosting me at Trent University. I would also like to thank him for having contributed so much on this very important topic of foreign aid.
A special thanks goes to Prof. Jean-Marie Grether with whom I have col-laborated for teaching purposes. Together with Benjamin T.-D., we formed a wonderful teaching team.
I have spent five years as PhD candidate at the University of Neuchâtel. While there, I have met many people that have contributed to my success in writing a PhD thesis. I thank sincerely all of them and in particular my closest colleagues, Lionel, Dimitri, Thierry, Caspar, Sandra, Géraud, Ben-jamin V., Ivan and Cécile. A particular thanks to David, Leila, Joséphine, Alexandra and Benjamin T.-D..
Obviously, I would also like to thank my family. They have not brought me the solutions to my research issues but they definitely have brought the courage to look for them. Thank you Angela, Vanessa, José-Antonio, Jorge, Lucas, Anthony, Astrid, Daniel, Paul, Julien, Julie, Elia, Chorizo (rabbit 1) and Pipas (rabbit 2).
Last but not least, I thank the woman who has changed my life forever, from a normal one to an unbelievably magic and precious life. I love you Claudia Paola López.
Abstract
This thesis investigates the impact of Official Development Assistance (ODA) on the donor’s economy in the case of Switzerland. As a first step, chapter 1 discusses a flow-of-funds approach to quantify the impact of bilateral and multilateral ODA on the donor country’s economy. The simple yet rigorous methodology employed allows to compute both, the primary (immediate) and the final impacts of ODA on the domestic GDP. We find for the year 2014 a primary effect of around 70 to 90 centimes for each Swiss franc of ODA provided. Regarding the final effect, computed by means of a Keynesian multiplier, it is found to lie between 1.19-1.56 franc.
In addition to these effects, ODA, particularly bilateral ODA, may induce exports from the donor to the recipient countries. This hypothesis is tested in the following chapters using time-series and structural econometric modeling based on panel data.
Chapter 2, as a preliminary step towards chapter 3, discusses and further develops a statistical method, namely the Dumitrescu-Hurlin (DH) Granger non-causality test that enables the verification of causal links between any pair of time series based on panel data. In particular, the chapter presents the user-written command xtgcause, implemented in the Stata software that allows for the computation of DH Granger non-causality tests.
Chapter 3 employs the method discussed in chapter 2 to investigate the existence and direction of Granger causality between Swiss bilateral ODA and Swiss exports. The results reveal foremost bidirectional Granger causality. In other words, exports from Switzerland to the recipient countries are Granger-caused by ODA flows and vice-versa.
Finally, chapter 4 measures the magnitude of the induced effect of bilat-eral ODA on Swiss exports. To this end, an augmented-gravity trade model is employed. The results point towards a return through exports of 0.59 USD for each 1 USD of ODA allocated in the short run (static model) and of up to 1.73 USD in the long run (dynamic model).
These results are important in terms of policy implications on several accounts, not the least of which is providing decision makers with a more comprehensive view of the (real) costs of ODA.
Keywords: donor country, official development assistance, exports,
Résumé
Cette thèse analyse l’impact économique de l’Aide Publique au Développe-ment (APD) sur le pays donateur pour le cas de la Suisse. Comme première étape, le chapitre 1 discute d’une approche “flux de fonds” pour quantifier l’impact de l’APD bilatérale et multilatérale sur l’économie du pays dona-teur. Cette méthodologie simple mais rigoureuse, permet de calculer l’impact primaire (immédiat) ainsi que l’impact final de l’APD sur l’économie domes-tique. Nous trouvons, pour l’année 2014, un effet primaire se situant entre 70 et 90 centimes pour chaque franc suisse fourni. Concernant l’effet final, calculé à l’aide d’un multiplicateur keynésien, il se situe entre 1,19 et 1,56 franc.
En plus de ces effets, l’APD, en particulier l’APD bilatérale, peut induire des exportations du pays donateurs vers les pays receveurs. Cette hypothèse est testée dans les chapitres suivants à l’aide d’analyse de séries temporelles et de modélisation économétrique structurelle basées sur des données de panel. Le chapitre 2, comme étape préliminaire en vue du chapitre 3, discute et développe une méthode statistique, à savoir le test de non-causalité de Granger élaboré par Dumitrescu et Hurlin (DH), qui permet la détection de liens de causalité entre n’importe quelle paire de séries temporelles basée sur des données de panel. En particulier, le chapitre présente la commande xtgcause, implémentée dans le logiciel Stata et qui permet d’effectuer des “DH Granger non-causality tests”.
Le chapitre 3, utilise la méthode décrite dans le chapitre 2 pour examiner l’existence et le sens de causalité entre l’aide publique bilatérale suisse et les exportations suisses. Les résultats révèlent une causalité bidirectionnelle au sens de Granger. En d’autres termes, les exportations suisses vers les pays receveurs d’APD sont Granger-causées par les flux d’APD et vice-versa.
Finalement, le chapitre 4 mesure l’ampleur de l’effet induit de l’APD bilatérale sur les exportations suisses. Pour ce faire, un modèle gravitationnel de commerce international est utilisé. Les résultats montrent un retour de l’APD à travers les exportations de 0,59 USD pour chaque USD d’APD alloué à court terme (modèle statique) et de jusqu’à 1,73 USD à long terme (modèle dynamique).
Les résultats obtenus sont importants en termes d’implications politiques et ce pour plusieurs raisons, notamment en fournissant aux preneurs de dé-cisions une vision plus complète du coût (réel) de l’APD.
Mots-clés: pays donateur, aide publique au développement, exportations,
approche flux de fonds, causalité au sens de Granger, modèle gravitationnel, données de panel.
Contents
Acknowledgments
v
Abstract
vii
Résumé
ix
General Introduction
1
1 General overview 1 1.1 Definition of ODA . . . 11.2 ODA governing bodies . . . 2
1.3 Who provides ODA, how much and why? . . . 3
1.4 Why ODA? . . . 4
1.5 Who receives ODA? . . . 6
1.6 Destination and forms of ODA . . . 8
1.7 Main criticisms addressed to the measurement of ODA . . . . 9
2 Swiss context 10
3 Motivation and contributions 13
Chapter 1
17
1 Introduction 17
2 Literature review 19
3 Methodology 22
4 Results 31
5 Discussion and limitations 34
6 Conclusion 37
Appendix B 42
Chapter 2
45
1 Introduction 45
2 The Dumitrescu-Hurlin test 45
3 The xtgcause command 48
3.1 Saved results . . . 49
4 Examples 50
4.1 Example based on simulated data . . . 50 4.2 Example based on real data . . . 53
5 Conclusion 56
Chapter 3
57
1 Introduction 57 2 Literature review 59 3 Data 61 4 Tests 624.1 Unit root tests . . . 62 4.2 Dumitrescu-Hurlin Granger non-causality test . . . 64
5 Results 67
5.1 Unit root . . . 67 5.2 Dumitrescu-Hurlin Granger non-causality . . . 71
6 Discussion and limitations 76
7 Conclusion 78
Appendix A 80
1 Introduction 81 2 Literature review 83 3 Data sources 85 4 The model 87 4.1 Model specification . . . 87 4.2 Model estimation . . . 89 5 Results 90
6 Limitations and further research 101
7 Conclusion 101
Appendix A 103
General Conclusion
105
1 Main findings 105
2 Policy implications 106
3 General limitations and further research 107
General Introduction
This thesis is about investigating the impact of Official Development Assis-tance (ODA) on the donor country’s economy, in the case of Switzerland. In its own way, each of the four chapters comprising the thesis provides an answer, or at least part of the answer, to this non-trivial research question. Before discussing the motivation of this thesis and briefly presenting the con-tent of each article, it is worth giving a broad-spectrum overview of ODA in general and Swiss ODA in particular.
1
General overview
The first international financial flows measured date back to the 15th century when rich and powerful European families lent money throughout Europe. However, these international capital flows from private sources were profit oriented, differentiating them from international assistance flows, the ODA ancestor. Even if international assistance originated in the 19th century, mainly in the United States, Great Britain and France, the origin of modern ODA can be situated in the mid-20th century, after World War 2, spurred by the United Nations. Among the first ODA flows stand the ones arising from the Marshall Plan. The present section looks at the definition of ODA, answers the questions of who manages the concept of ODA, who provides ODA (donors), how much and why, who receives ODA (recipients), in what form and finally what are the main criticisms addressed to ODA?
1.1
Definition of ODA
Official development assistance is a concept used and defined by the De-velopment Assistance Committee (DAC) of the Organisation for Economic Co-operation and Development (OECD) as a measure of international aid flows.1
Each word composing the acronym ODA contributes to building its defi-nition. Indeed, “official” means that the assistance must come from an official source, which in this case means a public institution (usually the government, central and/or local level). Therefore, ODA does not include assistance di-rectly provided by households, Non-Governmental Organizations (NGOs) or private firms. Nonetheless, these private actors could still channel ODA on
1It should be noted that assistance/aid directed to countries/territories that are on Part II (more advanced developing countries/territories) of the DAC list of aid recipients is called Official Aid (OA).
behalf of the public institutions. In other words, they act as the govern-ment’s executing agencies. Considering only public assistance is obviously restrictive but since the concept of ODA refers to the responsibility of gov-ernments, which are accountable internationally of their assistance policy, the measurement of ODA is drastically facilitated.
The word “development” refers to the primary objective ODA should achieve, namely promote economic development and welfare of the recipi-ents. More recently the DAC referred to the Sustainable Development Goals (SDGs) introduced by the United Nations. Thus, to be considered as ODA, assistance is meant to be directed to developing countries/territories.
Finally, the word “assistance” has been purposely chosen as a broad term. Indeed, to help recipients to develop, government and public agencies have a wide range of instruments at their disposal: e.g. loans (with specific con-ditions attached), grants, knowledge transfers, donations in kind, funding projects and programmes, etc. Although the DAC has defined eligible activ-ities, the list remains almost infinite. This is why the word “assistance” has been preferred to other terms, such as “donations”, “loans” or “money”. The term “aid” is frequently used instead of “assistance”.2
1.2
ODA governing bodies
Not every activity of a developed nation directed to a less-developed coun-try/territory is considered as ODA. As we just mentioned, one of the tasks of the Development Assistance Committee is to provide clear definitions of eligible activities and financial assistance that can be considered as ODA. The DAC also plays the role of coordinator between all the member coun-tries. The committee was set up in 1960, a little more than a decade after the origin of modern ODA, under the auspices of the OECD’s forerunner, the Organisation for European Economic Co-operation (OEEC) and in Septem-ber 1961 by a Ministerial Resolution of the new OECD. Data collection on ODA started in 1960.
At the national level, each contributor has its own governing body or bodies responsible of defining and implementing ODA policies. Sometimes the body is an entity in itself and sometimes a mix of different public agen-cies that collaborate to take the ODA-related decisions. The national ODA governing body usually decides how to allocate ODA to which recipient, and more importantly, what effort will be made in providing ODA. Key decisions
2This is true no matter the recipient country, that is Part I or Part II of the DAC recipients’ list.
on ODA are however, in many donor countries, subject to the approval of the state authorities, as is the case for other government expenses.
1.3
Who provides ODA, how much and why?
The term ODA refers not only to a statistical concept but also to an interna-tional system of resource transfer between donors and recipients. The donors are organized by the DAC, which is composed of 29 member countries and the European Union. Currently, the 30 DAC members are 24 European coun-tries3 (including EU), and Australia, Canada, Japan, New Zealand, South
Korea, and the United States. Most of the time total ODA figures used in reports refer to these 30 DAC members (or 29 given that the European Union is often not considered). However, ODA figures sometimes also include as-sistance reported to the DAC by non-DAC members. The countries (around 20) included in this latter group do not fulfill all the DAC requirements to be members, but still provide ODA flows on a regular basis. Sometimes those countries are referred to as the “emerging” donors, which include developed and relatively rich nations from all over the world, such as Israel, Kuwait, Malta, Russia, Thailand, Turkey and the United Arab Emirates among oth-ers.
The OECD reported that in 2017, ODA (from DAC and non-DAC mem-bers) amounted to around 178,000 million USD (current price). As we will show later, this number represents only around 0.3% of the donors’ GNI (on average), but still, about 33% of the Swiss GNI. With respect to the Least Developed Countries (LDCs), on average, ODA flows represented in 2016 around 4.6% of their GNI (World Bank database). This ratio even goes up to 10% for some LDCs recipients. The fact that total ODA represents such a large amount of money and implies so much in terms of the recipients’ budget, gives credence to the present thesis. Indeed, results found regarding the impact of ODA on the donor country’s economy, particularly Switzer-land that is a major donor as we will discover later, may impact substantially ODA provided and therefore many developing countries/territories.
The DAC members have contributed to around 92% of the 2017 total ODA amount. The top five donors are, in order, United States, Germany, United Kingdom, Japan and France. Interestingly and although in a different order, the top five donors were the same in 1960. Total ODA (from DAC and non-DAC members) in constant prices has remained roughly constant
3Austria, Belgium, Czech Republic, Denmark, Finland, France, Germany, Greece, Hungary, Iceland, Ireland, Italy, Luxembourg, The Netherlands, Norway, Poland, Portu-gal, Slovak Republic, Slovenia, Spain, Sweden, Switzerland and United Kingdom.
since the early 1970s (at around 80,000 million USD). However, since the beginning of this century, total ODA has strongly grown as table 1 shows:
Table 1: Total ODA in US dollars, millions, constant prices (2016)
2000 2005 2010 2015 2017
80,961 128,976 137,738 162,057 175,324
It should be noted that the significant growth between 2000 and 2005 is mainly driven by the important (and highest ever measured, i.e. 28%) an-nual ODA growth between 2004 and 2005. The main factors explaining this growth rate are the debt relief for Iraq and Nigeria agreed by the Paris Club (USD 19.4 billion) and ODA provided following the devastating December 2004 Indian Ocean tsunami (USD 2.2 billion).
If the focus is on the “effort” of providing ODA (i.e. ODA/GNI) rather than on the absolute amount, the picture is very different. In 2017, the country putting the highest effort in providing ODA is a non-DAC mem-ber, namely the United Arab Emirates with a ratio of ODA/GNI equal to 1.31%. The four following countries are Sweden, Luxembourg, Norway and Turkey. The average effort of all the 2017 donors is 0.38% whereas the one of the DAC members for this same year is 0.31%. Thus, emerging donors are, on average, putting relatively more effort in providing ODA than the DAC members. Figure 1 shows the DAC members’ effort (there is no sufficient data on non-DAC members to include them in the time series) in providing ODA. During the first decade, in the 1960s, the level of ODA was quite high, but declining, probably because of the phasing out post-WW2 reconstruc-tion effort. Thereafter, ODA effort of the DAC members remained roughly constant, at around 0.3%.
Note that the quantitative objective set until 1969 by the United Nations Assembly was 1% of the donors’ GNI. Todays, the objective is 0.7%, which obviously is not reached either. A working committee established by the World Bank in 1969 and led by Lester Pearson, a former Canadian prime minister, has proposed the current target.
1.4
Why ODA?
To the almost philosophical question, what are the motives of the donors to provide ODA, Charnoz and Severino (2015) propose five arguments based on the theory of international relations, namely the quest of power, the
“capital-Figure 1: ODA effort, DAC members
ist” exploitation, the quest of material welfare, the pursuit of private interests and the moral fulfillment.4
• The quest of power. As any international action, providing ODA gives the donor visibility and increases its relative power. Further-more, based upon the amount of aid, a donor country can reward, or the opposite, sanction, a specific country or region, establishing a domination-based relationship towards the recipients.
• The “capitalist” exploitation. In a context where countries are ei-ther “capitalist” or “proletarian”, exporting capital, no matter the pur-pose, strengthens the position of a capitalist country and contributes to the exploitation of the proletarian countries.
• The quest of material welfare. In this case, donors spend on aid not to gain power or to reinforce their dominance but simply because providing ODA allows recipients to be better-off which implies for the donor future potential commercial relationships with the assisted coun-tries. In other words, ODA is not a zero-sum game, it is an investment. • The pursuit of private interests. According to this line of argu-ment, the donor has no interest in the recipient’s development. ODA
4An alternative contribution on aid allocation is the one of McKinlay and Little (1977) that developed an analytic model of aid allocation (donor’s perspective). They find that imperialistic behavior of the donor is the model best explaining the allocation of aid (based on U.S. data).
is provided by governments who may encourage foreign aid for private purposes like for instance to satisfy exporters’ lobbies.
• The moral fulfillment. ODA is provided to fulfill the moral duty wealthy and developed countries have regarding their less-developed peers. This does not necessarily mean that donors admit a share of the responsibility regarding the recipients’ current economic situation. In fact, it is very difficult if not impossible to fully comprehend the donors’ motivations for providing ODA. Whatever the reasons are, it is believed that providing ODA does economically impact the donor. Martínez-Zarzoso et al. (2009) discuss three reasons why ODA may affect positively the donor’s economy, in particular its exports. First, the authors mention that ODA can be tied to the donor’s goods and services implying automatically a positive impact on its aggregate demand (even though it could be argued that some of the exports arising from tied aid would have occurred anyway with or without ODA). It should be noted at this point that untied aid can also imply a positive impact on the donor’s aggregate demand, and that together tied and untied aid may be the root of supplementary positive effects on the aggregate demand. The first chapter of the present thesis discusses this issue extensively. Second, and related to the possibility to provide ODA in the form of national goods and services, the recipient country may develop a dependence towards the donor’s goods and services. This habit-formation effect, as discussed by Djajić et al. (2004), may imply future exports from the donor to the recipient, since assistance flows can cause a gradual shift in the consumption preferences in favor of the donor’s goods and services. Finally, yet importantly, when a recipient receives assistance from a donor, this relationship may alter, in a positive way, the perception the recipient has towards the donor (goodwill effect). Thus, trade relations may emerge in either the short run or the long run because of ODA. Chapter 3 and 4 of this thesis precisely aim at, respectively, investigate the presence of a statistical causal relationship between ODA and exports and quantify the effect ODA induces on the donor’s exports.
1.5
Who receives ODA?
As for the donors, DAC decides who should belong to the list of recipi-ent countries/territories. Currrecipi-ently DAC revises the list of recipirecipi-ents ev-ery three years. The list for the period 2018-2021 comprises no less than 143 countries/territories. The criteria used to decide the status of recipient are twofold. First, are considered as recipients all the countries/territories
identified by the United Nations as Least Developed Countries, that is, 47 countries/territories for the years to come. The identification of the LDCs by the UN is based on the countries/territories’ GNI as well as on two com-posite indexes, namely the Human Asset Index that considers the coun-tries/territories’ level of nutrition, health, education and adult literacy and the Economic Vulnerability Index that takes into account eight different cri-teria.5 Second, are also listed as recipients low- and middle-income tries/territories as defined by the World Bank (respectively 2 and 94 coun-tries/territories6 for the period 2018-2021). For the World Bank, low- and
middle-income countries/territories have a GNI per capita (in US dollars and calculated using the World Bank Atlas method) below USD 12,235 (in 2016).7 It is commonly agreed that as far as possible, LDCs should be helped
in priority given that, in addition to be very poor (very low GNI per capita), they also face some other severe problems. Some of the emerging donors can potentially also be considered as recipients, like in the cases of Thailand and Turkey.
OECD data on ODA disbursements to countries/territories and regions highlight which geographical areas are receiving the highest share of ODA. Figure 2 shows that since the mid-1970s, the region receiving the highest share of ODA is the Sub-Saharan Africa.
5The eight criteria retained by the UN are: population size; remoteness; merchandise export concentration; share of agriculture, forestry and fisheries; share of population in low elevated coastal zones; instability of exports of goods and services; victims of natural disasters and instability of agricultural production.
6The middle-income group is often further divided in two, the lower and the upper middle-income groups.
7The WB thresholds are mainly based on operational thresholds. For instance, the low-income group of countries threshold has been set in 1989 relying on the operational threshold for “civil works preference”.
Figure 2: ODA by region: DAC members
According to Charnoz and Severino (2015), the poorest countries receive the highest share of ODA. This observation is in line with figure 2 above since on average the poorest countries are the sub-Saharan African countries.
1.6
Destination and forms of ODA
Despite the absolute necessity to respect the DAC requirements regarding the eligibility criteria ODA needs to fulfill, each donor still has a considerable leeway regarding the sector to which its ODA is directed as well as the form it takes.8 Indeed, regardless of the sector (with the exception of “debt
relief”), ODA can either be in the form of goods and services (G&S) or in the form of pure financial flows (with the possibility to attach “strings”, i.e. conditionalities on how to use the funds). Furthermore, ODA can be directly allocated to a country (bilateral ODA) or indirectly through international organizations (multilateral ODA) which channel the ODA collected towards recipient countries. In 2016, around 70% of ODA was bilateral. The fact that ODA can be in the form of G&S and that financial flows can be subject to conditionalities gives the possibility to donor countries to provide tied aid, that is aid provided in the form of the donor G&S (necessarily). In the early 2000s, DAC emitted recommendations to untie aid, which caused, according
8The OECD considers eight sectors, namely social infrastructure, economic infras-tructure, production, multisector, program assistance, debt relief, humanitarian aid and unspecified.
to OECD, a large drop of the share of tied aid from around 80% in the 2000s to less than 20% nowadays.9
1.7
Main criticisms addressed to the measurement of
ODA
As we have seen, DAC is the body deciding what can or cannot be considered as ODA. Thus, most of the criticisms are linked to the decisions of the DAC on including or excluding specific flows. The probably most discussed issue over the past years is the degree of concessionality a loan must show to be considered as ODA. Hynes and Scott (2013) discuss extensively this issue. The authors note that even after many years of debate, and the choice of a minimum 25% share of grant elements in a loan, it still remains a topic of discussion. The same applies to the fixed 10% discount rate which is used in calculating the grant element of a loan, determined in 1972 and never changed since. Nowadays, the 10% discount rate is obviously too high compared to market interest rates, and therefore artificially increases the grant element of a loan. This facilitates commercial loans to be considered as ODA.
A second debated example is the fact that ODA includes study and school fees for students originating from the recipient countries. However, if those students do not go back to their countries of origin, should those fees really be considered as ODA? Alternatively, even if the students go back to their country, do those expenditures really help the recipient countries to develop? In the same vein: should the expenditures on the hospitality and travel expenses of the refugees be considered as ODA? The return of refugees in their home country, after a period, will not necessarily help the recipient country to grow; on the other hand, the hosting of refugees may ease the international climate and therefore favor the development of the less developed (mainly the ones at the border of the country in conflict).
To summarize, if there are some expenditures that are globally accepted as being ODA (e.g. expenses in water supply and sanitation or disaster preven-tion among others), others cause much ink to flow. Hynes and Scott (2013) discuss the contemporary ODA concept and show its main drawbacks. In a second step, the authors propose an alternative aggregate measure, namely the Official Development Effort (ODE), which excludes some controversial expenditures such as student’s fee and spending on refugees, and include only the donation part of loans. Their contribution precedes the one by Roodman (2014) that as a first step also analyzed which current
expendi-9The fundamental reason why DAC encourages donor countries to untie their aid is that tying aid may increase the costs of a development project.
tures should not be part of ODA anymore and which ones should be included. Then, the author proposed a new method to more accurately compute the grant elements of a loan, which will in turn be accounted as ODA instead of the loan itself (as also proposed by Hynes and Scott (2013)).
2
Swiss context
With roughly eight million inhabitants, Switzerland is one of the less popu-lated DAC members but on the other hand one of the wealthiest. This latter fact allows Switzerland to be above the median DAC members’ donors in terms of ODA in US dollars (ranked 13th in 2017 and 12th in 1960). Figure 3 shows the Swiss ODA contributions since 1960. As it can be seen, it is only towards the end of the 1970s that Swiss contributions have really started to increase.10 The significant drop of Swiss ODA contributions last year (2017) is predominantly due to an important decrease of Swiss expenditures on asylum and to a lesser degree to the adjustments to DAC’s guidelines on computing asylum-related costs. For the purposes of saving money, the Swiss government has not allocated the funds saved in another form of assistance.
Figure 3: Swiss ODA disbursement
Note: The 1992 peak is due to extraordinary debt relief measures for the 700th anniver-sary of the Swiss confederation and Switzerland’s accession to the Bretton Woods institutions.
By plotting the share of ODA relative to GNI (figure 4), Switzerland shows a performance more in line with its prosperous nation status, especially since the early 1990s with a ratio above the average of all DAC members.
10Switzerland became a DAC member in 1968. The increase of ODA contributions in the late 1970s is mainly due to the incorporation of humanitarian aid as ODA in 1977.
Figure 4: Switzerland vs DAC members ODA effort
Since 2014, the Swiss effort in providing ODA oscillates around 0.5% of GNI, in accordance with the decision of the Parliament in 2011 to increase Switzerland’s contribution to 0.5% of its GNI by 2015. As it can be seen in figure 5 below, the current Swiss effort in providing ODA is among the highest.
Figure 5: DAC members ODA effort, 2017
In 2016, Switzerland provided ODA to slightly more than 100 countries and territories. Figure 6, based on OECD data, shows the geographic distri-bution of Swiss ODA across different regions of the world. As a whole, Swiss
ODA spread is similar to the global one (figure 2), the sub-Saharan Africa region being the area receiving the highest share of Swiss ODA.11
Figure 6: Swiss ODA by region
Note: On the graph, only eight regions can be distinguished because Swiss ODA con-tributions towards Oceania are very small.
Finally, one specific feature of Switzerland is the high share of untied aid it provides. The DAC/OECD started to collect data on the tying status in 1979. Figure 7 shows the average share of untied aid12 for the 27 donor
countries for which data are available.
11No evidence of ODA allocation bias, as for instance in Arvin and Drewes (1998) who analyze Canada, was found regarding Swiss ODA.
12The untied aid share is defined as the proportion of untied aid relative to total ODA excluding partially tied aid and negative commitments.
Figure 7: Untied aid share, DAC members
Switzerland stands among the top five countries, with an average share of 84%. Note that the ratio for Switzerland moved upwards to 96% for the period 2000-2016. However, as already mentioned, providing untied aid, i.e. behaving altruistically, does not mean that returns on ODA for the donor are proportionally lower. On one hand a high share could indeed lead to lower purchases of goods and services from the donor’s economy, but on the other hand, untied aid may foster (possibly more that tied aid) the so-called goodwill effect. Moreover, Arvin et al. (1996) have shown in their contribution, based on Canadian data, that untied aid does have indeed a lingering/persistent impact on exports.13 With a ratio of untied aid close to
unity, Switzerland is a very interesting country to investigate.
3
Motivation and contributions
There is a large number of academic studies on ODA. Economically, there are at least two broad research topics, namely 1) does ODA really help the recipient country to develop? and 2) does ODA imply any economic benefit for the donor? The literature on the first topic is vast and the methods and models used to answer that simple but non-trivial question are manifold. A striking observation is that no clear answer is provided by the existing lit-erature. Some authors argue that ODA helps a recipient only if the latter satisfies specific demographic and economic features; others claim that no
13In reality, the frontier between tied and untied aid can sometimes be thin. For instance, ODA in the form of technical cooperation, usually accounted as untied ODA, implies mostly purchases of goods and services from the donor country.
matter the characteristics of the recipient, ODA does help them to develop; finally, some assert that ODA has no significant impact on the recipient coun-tries’ capability to grow. Concerning the second topic, the existing literature is much more limited. Although this is understandable given the main ob-jective of ODA, at least four reasons can be given/cited for the importance of analyzing the economic impact of ODA on the donors.
First, by definition, ODA is financed by public resources and the govern-ment in democratic countries is accountable to the taxpayers who will foot the bill in the last resort. Taxpayers want to know what are the risks and gains from providing ODA and what is the true opportunity cost of ODA in terms of forgone, present and future consumption. An inspection of the economic benefits of ODA for the donor country responds to those legitimate needs.
Second, it may be crucial for a given donor country to know if ODA produces a significant impact on its economy, in particular through exports. Indeed, in open economies, exports are a major driver of income and growth. Thus, failing to measure the effect of ODA on exports would for instance underestimate the consequences of a cut in ODA.
Third, as we have seen in the previous two sections, ODA is not a marginal amount or concept. On the contrary, for some recipients ODA represents one-tenth of their budget. Even though total ODA in constant prices has more than doubled since the beginning of the century, the donors’ effort in providing ODA stagnates since more than a decade. The plan is however to increase this effort in the coming years. ODA provided is increasing in scale, and thus deserves more attention from the scientific community at large.
Last but not least, except for some donor countries, namely Luxembourg and the Scandinavian countries among a few others, the target of 0.7% of GNI has not (yet) been reached. Thus, if ODA is found to positively influence the donor’s economy, it may be a strong argument for the governments to increase their effort and reach the 0.7% share of GNI initially put forward by the Dutch economist and Nobel Prize winner Jan Tinbergen and reaffirmed by the UN within its millennium development goal target.
This thesis is composed of four chapters, each of them corresponding to an empirical contribution. The order of the chapters is basically governed by the structure (constraints) imposed on data. Chapter 2, co-authored, has already been published (Lopez and Weber (2017)). The remainder will be hopefully submitted for publication in peer-reviewed journals in due time.
Chapter 1 presents and discusses extensively a flow-of-funds approach
to quantify the impact of official development assistance on the donor coun-try’s economy. In particular, it looks at the economic impact of the different ways public resources allocated to ODA are spent in the donor’s country by
the donor itself, the recipient countries and the various partners of ODA-financed aid projects and programmes. Based on Swiss data for the year 2014, and following a simple yet rigorous methodology, the primary (imme-diate) and final impacts of Swiss ODA on the domestic aggregate-demand (GDP) are computed. In a nutshell, results show that, for each franc spent, Swiss ODA has a return lying somewhere between 0.70-0.90 Swiss franc in terms of the immediate impact and 1.19-1.56 franc by integrating the mul-tiplier effect. ODA’s effect on employment for that same year is roughly estimated at around 25,000 full-time equivalents. This chapter also provides some useful guidelines and recommendations for future implementations of the methodology in Switzerland and other donor countries.
The second and third chapters are related to each other given that the former implements and further develops the econometric techniques employed in the latter.
Chapter 2 presents the Stata user-written command xtgcause, which
implements and further develops a procedure proposed by Dumitrescu and Hurlin (2012) for detecting Granger causality in heterogeneous panel datasets. The main advantages of this procedure are twofold. First, it enables the user to conduct Granger causality tests, initially developed in a purely time series framework (Granger (1969, 1980)), within a panel involving the observation of multiple individuals (countries) over time. Second, it allows for hetero-geneity of the causal relationships. In other words, Granger causality can be found for the panel even though such causality is not present for some indi-viduals. This chapter also discusses a further salient feature of the xtgcause command that gives practitioners the possibility to select the optimal num-ber of lags to include in the models by minimizing the Akaike Information Criterion (AIC), Bayesian Information Criterion (BIC), or Hannan-Quinn Information Criterion (HQIC). The optimal lag selection is a major issue in time-series modelling since an inappropriate selection of the number of lags can lead to wrong conclusions as we show in the chapter.
Chapter 3 uses the technique discussed in chapter 2 to investigate the
direction of Granger causality (i.e. temporal precedence), if such causality there is, between Swiss bilateral official development assistance and Swiss exports for a panel of 50 recipients over the period 1974-2016. To account for possible geographical effects, three specific groups of recipient countries are considered, namely “Africa”, “Latin America” and “Asia”. To shed light on potential level effects, four other groups of countries are considered according to the relative amount of ODA, respectively exports, flows Switzerland has maintained with a given recipient country throughout the whole period. As a necessary first step, four different panel unit root tests are run on each series of all eight panels and results systematically indicate stationary series
in levels. Then, to test for Granger causality, Dumitrescu-Hurlin Granger non-causality tests are conducted. Results indicate bidirectional Granger causality in all panels. This finding augurs well for the fourth and last chapter of the thesis.
Chapter 4 estimates a structural econometric model to investigate the
relationship between Swiss bilateral ODA and exports in the recipient coun-tries based on a panel of 95 recipient councoun-tries over 51 years. More precisely, we use an augmented gravity model of trade in order to quantify the impact of Swiss bilateral ODA on Swiss exports while controlling for standard vari-ables such as exchange rate, GDP or free trade agreements. The results point towards a statistically significant relationship between the two variables. The average return on ODA (through exports) is estimated at 0.59 USD for each 1 USD donated in the short run (static model) and up to 1.73 USD in the long run (dynamic model). These effects (magnitude and significance) vary substantially when groups of recipient countries are formed based on their geographical location or the magnitude of bilateral ODA or export flows they receive from Switzerland (same criteria as in chapter 3). In particular, return on ODA turns out to be statistically significant if ODA is directed toward countries to which Switzerland exports the least but donates the most or to-ward African or Asian countries (rather than to Latin American or European countries).
To summarize, Swiss ODA does produce positive economic returns for the home country. Specifically, bilateral ODA and exports are found to be statistically linked, both in the short run and in the long run. This observation leads to some policy implications that are discussed in the general conclusion. The general conclusion also presents some general limitations of the present thesis and more importantly provides some further research ideas.
Chapter 1: Measuring the
Impact of Official Development
Assistance on the Swiss
Economy: A Flow-of-Funds
Approach
∗
1
Introduction
Official Development Assistance (ODA) has a single and outright priority, namely helping developing countries to economically progress and enhance their welfare. To be considered as ODA, assistance contributions must orig-inate from the government (central or local) and meet the eligibility criteria prescribed by the Development Assistance Committee (DAC).
ODA flows have been subject to numerous studies mostly dealing with ODA’s impact on the beneficiary countries (aid efficiency issue). A smaller number of studies have focused on the donor countries themselves. The latter topic is of primary interest in the present contribution. Although ODA is often seen as an altruistic act, i.e. a pure donation without any expected impact on the donor’s economy, the reality is different. First, ODA is not necessarily a donation. For instance, a loan to a recipient that is concessional in character with a grant element of at least 25% is considered as an ODA contribution according to DAC standards. Furthermore, assistance to recipient countries can come in the form of goods and services purchased in the donor country, thereby conveying some economic benefits to the donor. In fact, the donor government or its executing agencies have the possibility to purchase domestic goods and services to be sent to the recipient countries. In the same vein, resident experts can be mandated to contribute to ODA-related programmes and projects. Even though the experts’ findings and activities are targeted to benefit the recipients, their salaries are likely to be
∗This paper is co-authored with Alain Schönenberger. The results discussed in this chapter emanate from a study - based on 2014 data - commissioned by the Swiss Agency for Development and Cooperation (SDC) and the State Secretariat for Economic Affairs (SECO). The research project was directed by Prof. Gilles Carbonnier (Graduate Institute of International and Development Studies, Geneva) and Prof. Milad Zarin-Nejadan (Uni-versity of Neuchâtel). The project report submitted to SDC/SECO in 2015 was written by the authors of the present chapter together with Dr. Moez Ouni and Mr. Lorenzo La Spada.
at least partially spent in their home country. Thus, the question of how and where ODA is spent determines the magnitude of the economic benefits for the donor.
In addition to these direct impacts on the donor’s aggregate demand, bilateral ODA contributions from the donor government can also be the trig-gering element of supplementary aid flows activated by NGOs and other insti-tutions (i.e. the executing agencies of the government), implying a “leverage” effect on the donor’s aggregate demand for goods and services. Finally, yet importantly, multilateral ODA contributions to international organizations may give rise to an indirect effect on the donor’s economy by entailing expen-ditures from international bodies in the donor country that would otherwise not have occurred.
Considering the above-mentioned facts, a thorough examination of the spending behavior of all the actors involved, i.e. the government as the direct provider of ODA, the NGOs involved in aid and cooperation activities, as well as all other institutions, private firms and international organizations that are providing aid flows, is needed. All these ODA-related spending on goods and services of the donor (primary effect) increase the domestic GDP by more than the total value of goods and services sold. Moreover, by means of a multiplier, estimated on the basis of macroeconomic parameters, it is possible to derive an estimation of the final effect of ODA on the donor’s GDP. The number obtained can then be used to roughly evaluate the effect on employment. In the case of Switzerland and for the year 2014, we estimate the primary effect on aggregate demand for goods and services purchased in the country to be in the range of 70 to 90 centimes for each Swiss franc of ODA. The final effect on GDP ranges between 1.19 and 1.56 Swiss franc.14
As for the resulting impact on Swiss employment, it is roughly estimated at around 25,000 full-time equivalents, which represent about 0.6% of Swiss employment (full-time equivalent).
This flow-of-funds approach described above, focusing on the economic impact of procurements derived from ODA programmes and projects, has the virtue of relying on a large set of available data and transparent calcu-lations. If information is missing but needed, imputations are made based on reasonable, evidence-based hypotheses. Furthermore, the methodology used generates an estimate of the economic benefits of ODA-related spend-ing on the donor economy without the restrictions imposed by any economic model and resorting to econometric techniques. It also has the advantage of providing useful insights on the impact of ODA on the donor’s economy, which can be easily communicated to decision makers and the general
lic. On the other hand, not all effects of ODA on the donor economy can be accounted for. This is true for instance for the growth-induced imports of the recipient countries (exports for the donor) or goodwill effects on trade and direct investment. The flow-of-funds approach can at best give a lower bound estimate of the total domestic effects of ODA.
The rest of the paper is organized as follows. Section 2 provides a brief literature review. Section 3 goes through the methodology employed. Section 4 presents and discusses the results for Switzerland in 2014. Section 5 points out the limitations of the methodology and provides directions for future improvements. Section 6 concludes and mentions some policy implications.
2
Literature review
This section reviews the limited number of studies which have used the flow-of-funds methodology to compute the economic impact of ODA on the donor country. To the best of our knowledge, the first contribution on the economic “fallout” of ODA for the donor country is the study by Hyson and Strout (1968). In their contribution the authors estimate the impact of foreign aid on U.S. exports over the years 1960 to 1965 in three-steps. First, they assess the effectiveness of foreign aid on the economic growth of the recipient coun-tries. Then, based on the estimation of the growth effect of the aid flows, they calculate the increase of the demand for imports of the recipient coun-tries. Finally, using U.S. trade shares in those recipient countries, the authors quantify the impact of foreign aid on U.S. exports. The estimated impact is unsurprisingly large given the fact that “the federal government has adopted the policy of maximizing the procurement of goods in the United States for all projects financed with Official Development Assistance”. Around 60% of the total increase of U.S. commodity exports towards the analyzed set of re-cipient countries was attributed to U.S. foreign aid, of which about two thirds were the outcome of U.S. foreign assistance tying policy and one third the result of increases in income in the recipient countries generated by U.S. for-eign aid. Note however that the authors did not consider the direct spending by U.S. aid on the domestic markets of goods and services (administration, U.S. experts). Hyson and Strout are, to a certain extent, the pioneers of the empirical analysis on the existing links between foreign development aid and export performance of the donor country.
Nearly two decades later, Schumacher (1984) analyzed the impact on employment of bilateral ODA flows by studying the direct effect on Ger-man (former Federal Republic of GerGer-many) exports of goods and services purchased in relation with tied and untied aid as well as financial transfers
which cofinance local initiatives and investment projects promoting economic development of the recipient countries. As an additional beneficial impact of ODA on German employment, the author also considered technical cooper-ation consisting of employing experts with their equipment in the recipient countries and training of local staff. Furthermore, he also included the ex-ports of Germany resulting from ODA activities of multilateral institutions and the bilateral ODA by other donor countries (as well as private direct investment in developing countries). The author warns the reader about the fact that resulting economic growth of the recipient country can actually have a negative impact on employment in the donor country since more fa-vorable economic conditions in the former encourage local production and consumption, possibly provoking import substitutions.
The author used input-output modeling, thus accounting for the direct effect on the industries benefitting from ODA-related exports and the in-direct induced effect through purchases of intermediate goods and service provided by other sectors. For the year 1982, he found a return on bilateral ODA of around 32,000 full-time equivalent positions to which one could add 18,000 employments if private engagements on aid projects and programmes, not included in the official assistance figures, are taken into account. Then, he found that the contracts obtained in the international tendering proce-dure by German firms and institutions for the delivery of goods and services in relation to the aid programmes and projects financed by the multilat-eral institutions (World Bank, UNDP, European Development Fund EDF, and the regional development banks) accounted for approximatively 35,000 employments. Bilateral ODA of the other donors implied 16,000 additional employments. Last but not least, the author also considered the additional (German) exports induced by ODA flows directed to other recipient countries (not on the list of countries of cooperation) and estimated the corresponding impact on employment at around 24,000 jobs. In total, he estimated the return on ODA in terms of employment to reach 125,000 positions in 1982.
Note that using the same methodology, May et al. (1989) reported for the year 1985 an employment effect of ODA of 120,000 in Germany, which repre-sented at that time around 0.4% of the total employment. The authors also reported that the British team of the joint research project found for Great Britain an ODA return of 75,000 jobs (around 0.3% of total employment).
Fitzpatrick and Storey (1988) carried out a flow-of-funds study to mea-sure the economic benefits of ODA on Ireland as a donor country. The authors adopted a cost-benefit approach. They considered as costs total ODA contributions but also two additional elements that can be construed as opportunity costs of providing ODA. The first one is the fact that Irish workers employed as a result of bilateral or multilateral aid cannot be used
to produce goods and services to satisfy the domestic demand. Secondly, when goods and services are produced for ODA-financed purchases, physi-cal capital is used which becomes unavailable to produce other goods and services. The authors mitigate however the importance of these opportu-nity costs which greatly depend on the pre-existing degree of utilization of these resources. At the time of the study, Irish unemployment was indeed high. Unemployed resources, of the quality required by the ODA-induced production, have therefore a lower opportunity cost compared to a situation of full capacity utilization. Regarding benefits, the authors consider the ex-penses, from bilateral aid programmes, in form of purchases of Irish goods and services as well as employment opportunities for the residents. They also consider the sales of goods and services and consultancy by national firms and organizations to multilateral agencies to which the Irish govern-ment contributed (multilateral ODA). The authors further govern-mention, without being able to measure it, that the development of contacts and goodwill overseas should be considered as an additional benefit of ODA flows. They conclude however that, even if it is clear that ODA produces economic ben-efits for the donor, these effects do not outweigh the economic costs (i.e. cost-benefit ratio exceeds unity).
Recently, Schönenberger et al. (2012) estimated for the year 2010 the effect of Austrian ODA on GDP. To do so, the authors employed the same methodology as the one we discuss below (section 3), slightly modified to take into account some specific features of the Austrian ODA. The authors found a primary effect of around 53 cents for each euro of Austrian ODA and a final effect of about 66 cents. Regarding Austrian employment, the impact was roughly estimated between 8,300 and 10,600 full-time equivalent (0.2 to 0.3% of total employment).
Regarding Switzerland, the first study using the flow-of-funds approach, followed by subsequent quadrennial studies, was undertaken on behalf of the Swiss Agency for Development and Cooperation (SDC) by Forster et al. (1996). The methodology used, quite similar to the approach employed by Fitzpatrick and Storey (1988), is presented in detail in the next section based on the report for the year 2014. The authors estimated for the year 1994 the primary and final effects of ODA on the Swiss economy. They found a primary effect of ODA expenditure on aggregate demand of between 0.90 and 1.02 Swiss franc for each franc of ODA. Then, by including the impact of estimated Keynesian multipliers, the final effect i.e. increase in GDP -was estimated between 1.55 and 1.79 Swiss franc. In terms of employment, a positive impact of roughly 16,000 to 23,000 full-time equivalent positions was reported (0.5 to 0.7% of total employment).
approach, the results are not strictly comparable, not the least because of important institutional differences among the countries. Besides, differences in the composition and definition of ODA exist between the countries, partly related to the time frame. Furthermore, the methods used to estimate the economic impact (on GDP and employment) can be very different. In par-ticular, when using an input-output approach for taking into account the existing links between sectors via intermediate goods and services, results would be undoubtedly different (most probably higher) compared to those obtained by a simple multiplier. Also, the “indirect effect” induced by ODA is not comparable across studies. For instance, Schumacher (1984) includes the effect on the donor economy of bilateral ODA from other donors. Last but not least, some studies focus on the effect of ODA on employment whereas others report results in terms of aggregate demand (GDP).
3
Methodology
This section presents in detail the flow-of-funds approach used in this paper. It corresponds to the most recent quadrennial Swiss study conducted for the year 2014. In particular, we describe how total ODA flows are decomposed in two distinct categories (contrary to the three categories the DAC considers). Then, it will be explained how the two types of financial flows considered produce different effects on the donor’s aggregate demand. Finally, the Key-nesian multiplier is computed and applied to the primary effect of ODA. The multiplier serves to calculate the final effect on GDP and, by means of official figures on average labor productivity, the corresponding full-time employment generated.
Based on the nature of ODA provided by government, the flows as they appear in public accounts can be divided into three distinct categories, namely,
bilateral, multi-bilateral and multilateral15 . Bilateral ODA programmes and projects are negotiated and implemented by the recipient and the donor. Multi-bilateral ODA is spent on programmes and projects designed and ex-ecuted by international organizations but financed by the donor country in specific recipient countries. The third category of ODA refers to financial re-sources allocated to international organizations either to contribute to their overhead or to finance specific development projects but without the donor being able to decide to which recipient the funds are directed. The DAC con-siders multi-bilateral ODA as bilateral ODA because the assistance is geared to a specific recipient country. For our purposes, however, multi-bilateral
15A glossary defining the terms and ODA-related effects to which we refer is available at the end of this paper, after the appendices.
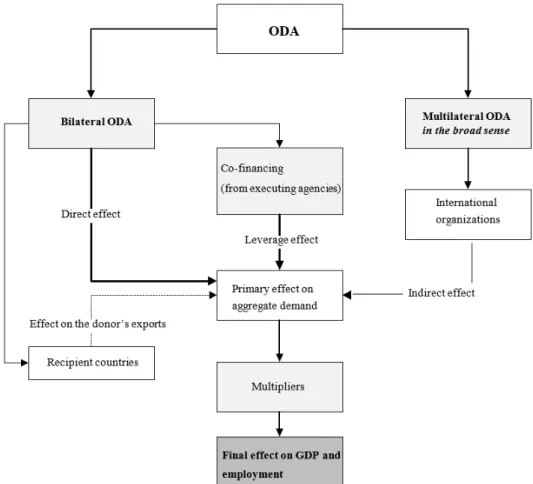
and multilateral ODA are assumed to produce the same kind of effect on the donor country’s aggregate demand. Thus, those two types of flows are therefore subsumed in one single category, namely multilateral ODA (in the broad sense). Figure 1 below exhibits the different types of ODA.
Figure 1: Total ODA decomposition
Bilateral ODA produces two distinct effects on the aggregate demand, namely a direct effect and a leverage effect.
Regardless of the donor country, the allocated resources for bilateral ODA are spent on goods and services except if they represent a pure financial flow (e.g. general contribution to the recipient’s budget and debt relief). A donor can buy goods and services (e.g. agricultural equipment) from any country in the world, and then import them into the recipient country. It is also possible that the national or foreign executing agency in charge of an ODA project decides or co-decides what to buy and from which countries. Similarly, the donor or its executing agencies may mandate experts from any country to deliver services in the recipient country. Some of the funds will be spent on goods and services emanating from the donor country even if the ODA is not tied (i.e. conditional on purchasing goods and services from the ODA provider country). This might be the case because the national producers of the goods and services needed are competitive or for reasons related to domestic policy goals. Note that the costs of administering various programmes and projects are included in the definition of ODA, so that automatically part of the budget is necessarily spent in the donor country (e.g. public administration, overhead and resident employees of executing agencies).
The part of the bilateral ODA budgetary allocation which is spent in the donor country has a direct effect on the latter’s aggregate demand for goods and services.16 The direct effects are estimated by examining how (much)
government bodies providing ODA and their executing agencies, usually a small number, spend in the donor country. Most of the executing agen-cies mandated for carrying out or supervising the programmes or projects have their headquarters in the donor countries. It is therefore necessary to look for data on how and where those organizations spend the funds which have been allocated to them. The information can be gathered by question-naire and/or personal interviews. In general, to be time and cost efficient, not all individual parties are contacted and questioned. A representative set of stakeholders should however be consulted, if possible, and the results extrapolated to the total spending of the ODA category examined. The questionnaires/interviews typically ask for information on how the project funds are spent (mainly salaries and social security contributions, purchase of goods and services, and possibly other important spending items such as direct transfers or interest charges) and of course what proportion of each item is spent in the donor country. The survey also collects information on the existence of private sources of funds, which might complement the ODA funds, in order to account for a possible leverage effect.
The leverage effect of bilateral ODA occurs when existing ODA donations attract matching funds. Indeed, available ODA financing is often comple-mented by private (or even some foreign public) sources.17 A share of these
additional funds, like the bilateral ODA funds themselves, are spent on the donor’s goods and services (including work remuneration). Thus, bilateral ODA, but not exclusively, is prone to entail, through additional contribu-tions, a leverage effect on the donor’s aggregate demand. For the ODA financed projects and programmes, the executing agencies, private or public, must keep an exact record of the spending and its allocation. However, addi-tional private funding, not necessarily included in the official project request, is unfortunately not subject to the same scrutiny by the public or govern-ment. This complicates the approximation of the so-called leverage effect. In
16Providing ODA in the form of national goods and services does not mean that aid is tied. Indeed, tied aid is defined as an aid provided under the explicit condition that it will be used to purchase goods or services from the donor country. Switzerland, compared to other countries, has traditionally had a relatively low proportion of tied programmes and projects (see for instance Berthélemy (2006) who categorizes Switzerland as the most altru-istic donor of the panel due to the low share of tied aid the country provides). Presently, in most OECD countries, only a small part of ODA is conditional in terms of the destination of the funds.
17It is assumed that government contributions attract additional donations and not the other way around.
the earlier Swiss studies, no limit on the possible leverage effect of bilateral ODA was set. Because the data collected and subsequently used regard-ing the leverage effect were not always representative (enough) and reliable (e.g. not necessarily closely connected to the ODA-financed programmes and projects), for the 2010 study, a 50% ceiling was set for the leverage effect (un-less detailed recent reliable information were available). We kept the same leverage effect ceiling for the 2014 report. In other words, it is assumed that bilateral ODA of 1,000 CHF enabled the mobilization of private funds of up to 500 CHF. Alternatively, one can also include all purely private funded projects in the estimations (in the same vein as Schumacher (1984)), but with the risk of overestimating the leverage effect.
Multilateral ODA comprises contributions by national governments to the financing of aid projects and programmes promoted by international or-ganizations. Typically, a programme might be financed by several donors. In general, goods and services of some importance (i.e. beyond a certain thresh-old) are spent following a tendering procedure at the international level. If firms and organizations in the donor country win the tender, then the funds spent have a greater likelihood to benefit the donor’s economy. This effect is called indirect since the purchases in the donor country are in principle, by regulation and contracts, not linked to the individual contributions to international organizations. However, it is true that only contributing coun-tries can participate in the tendering process. Likewise, it is also possible that donor countries may preferably fund programmes within international organizations from which they are most likely to benefit.
In practice, most of the important international organizations receiving multilateral ODA, e.g. the UN, or the regional Development Banks, keep a database on their contracts and can provide a list of organizations and firms which provided goods and services co-financed by ODA funds. It should be noted that if the beneficiaries are internationally active Swiss NGOs or Swiss multinational firms (as opposed to national), the impact of their contracts on the aggregate demand (primary effect) is expected to be smaller. In the ex-treme case, a contract given to a very large international corporation whose headquarters are located in the donor country might be executed entirely abroad with no significant impact on the donor’s economy. Acknowledging this fact, and based on data collected on ODA co-financed contracts, two vari-ants for the indirect effect have been considered and computed. The lower bound (LB) comprises expenditures made to Swiss-based companies produc-ing in Switzerland (territorial criterion) whereas the upper bound (UB) also includes expenditures directed overseas to the subsidiaries of the Swiss com-panies (national criterion). Also note that many contracts run over several years, and only the disbursements during the year of interest should of course
be retained.
The primary effect of ODA mentioned above on the aggregate demand is the sum of the three types of aid spending effects, namely the direct, leverage and indirect effects (figure 2).
Figure 2: ODA types of aid spending effects
Put differently, the primary effect is the measure of the immediate impact of ODA on the donor’s aggregate demand for goods and services. According to the well-known Keynesian multiplier process, the primary effect gives rise to a second round of expenditures on the donor country goods and services, then a third round, and so forth thereby increasing aggregate demand and GDP. The size of the multiplier effect depends, for a given primary effect, on the behavior of households and firms, represented by macroeconomic param-eters determining consumption (i.e. marginal propensity to consume out of disposable income) and imports (i.e. marginal propensity to import).18 The marginal propensities to consume and to import we used in the 2014 Swiss re-port are derived from the econometric equations for private consumption and
18Note that large purchases might increase investment demand thereby, everything being equal, enhancing the multiplier effect (“accelerator principle”). For a simple but thorough exposition of the multiplier, see Peacock and Shaw (1976). A discussion of the “crowding out” effect of an increase of aggregate demand, mentioned in the section below on the limitation of the Keynesian multiplier linked to an increase in public spending (e.g. in ODA expenditure), can be found in Shaw (1971).
imports estimated by Mattei (2007) in the framework of his macroeconomic model of the Swiss economy.
Since ODA impacts the economic circuit differently in terms of value added (primary effect) depending on the nature of the spending, a different multiplier is computed to obtain the direct, indirect and leverage final effects. For instance, the purchase of goods has a smaller multiplier effect compared to the payment of consultancy fees. Indeed, for an equal initial sum, the former has a lower percentage of value added (salaries). Typically, the esti-mated value of the short-run multiplier could be smaller than one in the case of purchases of consumption goods, but higher than one for salaries which represent a larger direct contribution to value-added. Large differences in the percentage of value added in turnover exist even within the manufacturing industry.
Consequently, three multipliers depending on the nature of the primary impact of spending on the economic circuit are used to calculate the GDP impact of ODA (see diagrams in appendix A). The algebraic expressions of these multipliers (k1, k2, k3) are reported in appendix B.19
The sum of the primary effect of ODA and the multiplier effect constitutes the final effect of ODA on the donor’s GDP (figure 3). The time necessary for the whole multiplier process to be completed depends mainly on the economic agents’ behavior and reaction.
Figure 3: ODA final effect
Algebraically, the final effect (F E) of ODA is given by:
F E = k1BODA + k2LF + k3IO
where BODA, LF and IO stand for, respectively, bilateral ODA, levied funds (thanks to bilateral ODA contributions) and multilateral ODA-related aid expenditures from international organizations towards Switzerland (two bounds are considered as discussed above). The terms k1BODA, k2LF and
k3IO therefore represent, respectively, the direct, leverage and indirect final
effects.
Given the estimated increase of GDP, the impact on employment (cor-responding to full-time equivalent employment) can be roughly computed