Publisher’s version / Version de l'éditeur:
Metrologia, 54, 1, pp. 129-140, 2017-01-25
READ THESE TERMS AND CONDITIONS CAREFULLY BEFORE USING THIS WEBSITE.
https://nrc-publications.canada.ca/eng/copyright
Vous avez des questions? Nous pouvons vous aider. Pour communiquer directement avec un auteur, consultez la
première page de la revue dans laquelle son article a été publié afin de trouver ses coordonnées. Si vous n’arrivez
Questions? Contact the NRC Publications Archive team at
PublicationsArchive-ArchivesPublications@nrc-cnrc.gc.ca. If you wish to email the authors directly, please see the first page of the publication for their contact information.
NRC Publications Archive
Archives des publications du CNRC
This publication could be one of several versions: author’s original, accepted manuscript or the publisher’s version. / La version de cette publication peut être l’une des suivantes : la version prépublication de l’auteur, la version acceptée du manuscrit ou la version de l’éditeur.
For the publisher’s version, please access the DOI link below./ Pour consulter la version de l’éditeur, utilisez le lien DOI ci-dessous.
https://doi.org/10.1088/1681-7575/aa56d5
Access and use of this website and the material on it are subject to the Terms and Conditions set forth at
Characterization of a versatile reference instrument for traceable
fluorescence measurements using different illumination and viewing
geometries specified in practical colorimetry. Part 2: sphere geometry
(8:d)
Zwinkels, Joanne; Neil, William; Noël, Mario; Côté, Eric
https://publications-cnrc.canada.ca/fra/droits
L’accès à ce site Web et l’utilisation de son contenu sont assujettis aux conditions présentées dans le site LISEZ CES CONDITIONS ATTENTIVEMENT AVANT D’UTILISER CE SITE WEB.
NRC Publications Record / Notice d'Archives des publications de CNRC: https://nrc-publications.canada.ca/eng/view/object/?id=d9682c21-38af-4e8e-8896-f53b13c69d2a https://publications-cnrc.canada.ca/fra/voir/objet/?id=d9682c21-38af-4e8e-8896-f53b13c69d2a
Characterization of a Versatile Reference Instrument for
Traceable Fluorescence Measurements using Different Illumination and
Viewing Geometries Specified in Practical Colorimetry
- Part 2: Sphere Geometry (8:d)
Joanne Zwinkels, William Neil, Mario Noël and Eric Côté Measurement Science and Standards,
National Research Council of Canada Ottawa, Ontario, Canada K1A 0R6
Abstract
In the second part of this two-part series on the development of a versatile reference instrument at the National Research Council of Canada (NRC), we have extended the characterization of the NRC Reference Goniospectrofluorimeter to high-accuracy fluorescence measurements in a sphere geometry (8:d) that is specified in standard test methods for many practical applications in colorimetry. This builds upon the work reported in part-one of this series which described in detail the design, characterization and validation of this new instrument for realizing a total spectral radiance factor scale in a bidirectional (45a:0) geometry. To extend the measurement capabilities to a sphere geometry, it was configured with a large diameter integrating sphere accessory. Preliminary results using a substitution-mode operating procedure showed large sphere errors that were characterized and corrected for. To improve this traceability, the sphere was modified to operate in comparison-mode and this effectively eliminated many of the sphere-related errors that typically limit the accuracy of sphere-based fluorescence
measurements. The performance of the instrument configured for a sphere geometry (8:d) with this modified sphere design has been validated by means of comparison measurements of both non-fluorescent and fluorescent artifacts. The reflectance component has been validated using non-fluorescent comparison samples that have been calibrated under the same geometric conditions with traceability to the NRC Absolute Reflectometer (d:0 geometry). The fluorescent-only component has been validated using near-Lambertian fluorescent reflecting materials with traceability to the NRC Reference Spectrofluorimeter (45:0 geometry), under the assumption that this component is nearly the same for these two geometries.. This work has enabled NRC to provide an uninterrupted link for improved traceability of fluorescence calibrations that specify a sphere geometry. These calibration requests include many important commercial applications, such as whiteness specification of fluorescently whitened paper and textile samples and color specification of fluorescent safety goods.
………..
Keywords: fluorescence colorimetry, total radiance factors, goniospectrofluorimeter,
traceability, fluorescent reflecting materials, bispectral measurements, sphere geometry
1. Introduction
1.1 Sphere-based Measurements – Background
One of the primary objectives of this work was to develop a new reference instrument to improve the traceability for calibrating fluorescent transfer standards for
many practical applications in colorimetry where the measurement geometry specified in the standard test method is different from that of currently available fixed-geometry reference instruments. As discussed in part 1 of this series of papers [1], for many practical applications of fluorescence colorimetry the recommended measurement geometry is hemispherical using an integrating sphere. This includes the colorimetric characterization of a wide variety of manufactured fluorescent goods (e.g. from paper, textiles, plastics) which exhibit directionality, texture, surface roughness or other types of sample non-uniformity. For these colorimetric applications, the traceability of fluorescent paper and textile transfer standards that are calibrated on reference instruments using a bidirectional geometry and then used in turn, to calibrate sphere-based standard test instruments, has come into question.
These reference instruments for fluorescence colorimetry typically employ a 45 degree fixed or 45 degree annular geometry [2,3], where the latter annular geometry reduces the effects of sample directionality or texture. This illuminating and viewing geometry of 45 incidence and directional viewing (45:0), or the reverse configuration (0:45) is the referee geometry for the color measurement of fluorescent samples as recommended by standardizing organizations such as the International Commission on Illumination (CIE) [4,5] and the American Society for Testing and Materials (ASTM) [6]. As discussed in part-one of this two part series of papers, the relevant measurement quantity for fluorescent materials is the total spectral radiance factor which is the sum of the source-independent reflected component and the source-dependent fluorescent component [4]. The use of an integrating sphere geometry is not recommended because
the reflecting and fluorescent properties of the fluorescent sample modify the spectral power distribution (SPD) of the irradiating system, which includes the sphere [7].
By contrast, for many practical applications in colorimetry, the test methods, specified by industry-specific standards, such as the International Standards Organization (ISO) Technical Committee TC6 for Paper, board pulps, specify a measuring instrument with a sphere geometry for the measurement of various optical properties, such as color, whiteness and brightness [8-11]. For these applications, the measurement procedure including instrument geometry is standardized to optimize the precision of the measurements. For many manufactured materials, such as paper and textiles, which exhibit a pronounced directionality, measurement reproducibility is significantly improved using a sphere geometry rather than a bidirectional geometry.
1.2 Sphere-based Measurements – Theory
An integrating sphere is defined as a hollow spherical enclosure whose interior walls are constructed of a material that diffusely reflects radiation of all wavelengths of interest with high reflecting power [12]. The theory of the integrating sphere and its application to surface reflectance measurements was first described by Jacquez and Kuppenheim [13]. This theory calculates the sphere efficiency at the detector port, ϵ, as the ratio of the radiant flux received by the detector to the initial flux incident on the sample. This sphere efficiency depends upon the fractional area of the detector surface,
fd, the diffuse reflectance of the sample, s, and the average reflectance of the sphere wall,
w, according to the following equation:
The main advantages of using an integrating sphere for diffuse reflectance or diffuse transmittance measurements is that the multiple reflections within the sphere cavity produce a uniform, Lambertian radiation. Thus, a sphere instrument is relatively insensitive to polarization effects or to sample surface effects. To optimize the measurement accuracy, a large diameter sphere is recommended since this will reduce the impact of unavoidable deviations in a real sphere from the design principles and theory of operation of an ideal integrating sphere. These perturbations include the influence of baffles, sample and detector apertures. On the other hand, to optimize the measurement sensitivity, i.e. efficiency, a small diameter sphere is preferable since it will minimize sphere absorption errors and, as indicated by Equation (1), a high sphere wall reflectance and large detecting area are needed to maximize the radiation transfer to the detection system.
For the above reasons, integrating spheres are now widely used for measurement applications in photometry, radiometry and spectrophotometry. This section describes the current situation with regard to the design of reference instruments for fluorescence colorimetry and the errors associated with the use of integrating-sphere instruments for measurements of both non-fluorescent and fluorescent surface colors.
The dual-monochromator arrangement for highest accuracy measurement of fluorescent materials was first introduced by Donaldson of NPL in the early 1950s [14]. At that time, for most colorimetric applications, the use of an integrating sphere with diffuse illumination and normal detection, or d:0 geometry was recommended because of the advantages listed above; notably its insensitivity to polarization effects due to the multiple reflections of the reflected and emitted radiation before detection, [15] and its
insensitivity to surface structure effects [16]. For these reasons, the first reference spectrofluorimeters that were developed for colorimetric applications used a two-monochromator arrangement and an integrating sphere geometry [17]. It is notable that the preliminary design of the reference spectrofluorimeter that was developed at NPL in the mid-1970s by Clarke allowed for the interchange of sampling accessories between a small integrating sphere used in a Cary Model 1411 reflectance attachment providing d:0 geometry and an annular 0:45 ring collector unit accessory providing 0:45 geometry [18]. This original design recognized the value of being able to carry out calibrations of fluorescent transfer standards under different specified geometries of irradiation and viewing. However, this approach was abandoned in the final version of this reference instrument which included only a well-characterized bidirectional (0:45) measurement geometry [19].
As already introduced in the first paper in this series [1], Alman and Billmeyer carried out a detailed study of problems in the color measurement of fluorescent materials using a sphere geometry [7]. The most serious of these sources of error, already mentioned above, was the fact that the spectral total radiance factors of the fluorescent sample, which occupies a port of the sphere, modifies the relative spectral power distribution (SPD) of the irradiating sphere-source system. This total spectral radiance factor comprises the sum of the reflected and fluorescent radiance factors and the impact on the color measurements needs to be considered separately for these two components.. For the reflected component, it is fairly straightforward to measure and correct for its effect on the average sphere wall reflectance and resultant change in sphere efficiency, according to Equation (1). This is not the case for the fluorescent component, where the
measurement and correction of its effect are much more complicated, depending upon the details of the sphere-source irradiating system and its interaction with the specific sample under test.
Thus, the reference spectrofluorimeters that have been developed since the early 1990s have used a two-monochromator arrangement with a bidirectional geometry (45:0 or 0:45) [2,3]. However, in recent years, there has been increased interest in performing high accuracy angularly-resolved fluorescence measurements, for selectable angles of illumination and viewing. A reference goniofluorometer has been developed at MIKES-Aalto (Finland) [20,21] and the reference goniospectrophotometer at IO-CSIC (Spain) has been recently upgraded to include the capability for goniofluorescence measurements [22]. In principle, it is possible to obtain the hemispherical total radiance factors from these angularly-resolved goniofluorescence measurements in the same way that an absolute diffuse reflectance scale can be realized using goniophotometric methods, from an integral calculation of the measured bidirectional reflectance distribution function (BRDF) data [23]. However, this is a very time-consuming procedure requiring dense spatial sampling of the sample’s BRDF to precisely calculate its hemispherical reflectance factor. It also does not accurately simulate how these fluorescent transfer standards are typically used to calibrate instruments in accordance with industry-specific sphere-based test methods.
The demand for traceability to sphere-based fluorescence measurements has also increased due to the growing interest in absolute quantum efficiency measurements. Goniometrical measurements have been used for these fluorescence efficiency measurements [24]. However, current international standards for absolute measurements
of quantum efficiency for photoluminescent materials, such as quantum dots, for lighting and display applications, recommend the use of integrating-sphere-based methods [25].
2. Sources of error in sphere instruments
To the best of our knowledge, there is no standardizing laboratory that is providing traceable fluorescence calibration services for a sphere geometry. This situation is largely due to the fact that the use of integrating spheres for fluorescence measurements introduces several sources of error that are not encountered in a bidirectional geometry. Some of these sources of error are common to the measurement of both non-fluorescent and fluorescent materials. These common sources of error include: single-beam substitution error, sample-recess error, and sphere asymmetry errors, which are discussed below.
Single-beam substitution error arises if the sphere has a single removable sampling aperture where the reference standard and subsequently the test sample are substituted. This type of measurement is referred to as single-beam substitution mode. If the sample and standard have different spectral and gonioreflectance properties, which is generally the case, this will alter the sphere efficiency and the magnitude of this error depends upon their differences in reflectance level. This error will exist whether or not the sample is fluorescent and for high-accuracy diffuse reflectance/transmittance or fluorescence measurements, this change in sphere efficiency needs to be measured and accounted for.
Sample recess error arises because the coating of the integrating sphere has a finite thickness and, therefore the sample and standard that are mounted at a sphere aperture are necessarily positioned with a recess compared with the interior reflecting
surface of the sphere. For highest accuracy, the sample and standard should be flush with this interior sphere surface. Integrating spheres for reflectance colorimetry are generally coated with a white reflectance coating made of barium sulphate paint in a binder or with a machined form of sintered polytetrafluoroethylene (PTFE) powder. Since barium sulphate paint is optically opaque, only a thin coating (~1 mm) is typically needed which results in an insignificant sample recess error. However, sintered PTFE is quite translucent and a coating of several mm is typically required to achieve an optically opaque reflecting surface. This can result in a significant sample recess error, whose magnitude depends largely upon the type of sample and photometric level and has no significant dependence on wavelength.
The third common integrating sphere error is a general integration error due to sphere asymmetry. This is due to the non-ideal design of most integrating spheres and is difficult to quantify. Contributing factors include the non-symmetrical positioning of internal baffles, gloss trap, other sphere plugs, the sensitive area of the photodetector, or other features that are not symmetrically located with respect to the sample and reference ports. This can also include ageing or contamination of the sphere coating which produces a nonuniform distribution of the radiation either incident on the sample or collected by the detector. Ideally, the sphere is designed to minimize this sphere asymmetry error but it is now common practice to map this spatial nonuniformity of the sphere and correct for its effects [29].
Other sources of errors that occur in diffuse reflectance and transmittance measurements using an integrating sphere include: sample internal diffuse error, diffuse reflectance screening error, detector (or polychromatic source) recess error, dark sample
reading error, gloss trap inadequacy, regular reflectance coating uniformity error, and regular reflectance screening error. A detailed investigation of all these common sources of error in sphere-based reflectance measurements was carried out at NPL by Clarke and Compton who also recommended procedures for correcting for these effects[30].
In addition to these systematic errors that are commonly encountered in sphere instruments for measurements of both total and diffuse-only reflectance and transmittance, there are other significant sources of integrating sphere error that are peculiar to their use in fluorescence measurements. Because the measured sample fluorescence depends critically upon the properties of the source, in an instrument with a sphere geometry, the properties of the sphere itself modify the spectral power distribution (SPD) of the radiation incident on the sample. This modified SPD of the sphere-source combination, which includes the properties of the fluorescent sample or non-fluorescent standard at the sphere port, also needs to be characterized and corrected for.
In a bidirectional instrument, it is fairly straightforward to measure this modified source SPD incident at the sample position by using a reference detector mounted at the sample position to calibrate the monitor detector that is fixed in the excitation beam path. The reference detector needs to have been calibrated under the same spectral, geometric and polarization conditions as the excitation system in the bidirectional instrument. This ensures traceability to the bidirectional geometry specified in a given standard test method; the monitor detector is then used to dynamically measure and correct for any temporal changes in the SPD at the time of the fluorescence measurements.
This procedure is not valid for a sphere instrument. Because the fluorescent sample and non-fluorescent reflectance standard are located at a sphere port, they
contribute not only to the average sphere wall reflectance but the differences in their respective reflected and fluorescent components modify both the SPD and the sphere efficiency in a complicated way, dependent upon how the optical properties of the sphere-source influence the measured optical properties of the sample and standard. In the case of fluorescent samples, there is an additional complication due to the emission from the sample that changes the spectral distribution of the secondary radiation incident on the sample. As we have discussed above, the fluorescent spectrum of the sample depends critically upon the spectral distribution of the sphere-source illuminating the sample; this latter error is referred to as a spectral sphere re-emission error and is present in both single-beam and double-beam sphere designs.
In the case where there is considerable overlap of the sample’s excitation and emission spectra, it is possible for the emitted radiation to be re-absorbed and re-emitted. Depending upon the time constant of the detection system, the collected secondary emission or re-radiation can be included in the measured signal. The magnitude of this effect is also not easy to predict and depends upon several factors, including the source intensity, instrument bandpass, and the sample’s absorbance and quantum efficiency for wavelengths in the excitation/emission overlap region. To reduce the impact of this sphere re-emission error, the instrument bandpass can be narrowed for wavelengths in this region, but this also reduces the measurement sensitivity.
3. Methodology for Improving NRC Traceability for Measurements in a Sphere Geometry
As discussed in the introduction, the methodology that has been used to improve traceability of NRC fluorescence measurements to other illuminating and viewing
geometries, such as a sphere geometry, is to carry out this characterization in a step-wise fashion. The validation is then carried out by comparison with measurement results using other well-characterized NRC reference instruments for absolute spectral radiance factor measurements of fluorescent samples and absolute diffuse reflectance factors of non-fluorescent samples. In part 1 of this series of papers [1], it has been shown that the NRC Reference Goniospectrofluorimeter, configured for a bidirectional geometry (45a:0) gives good inter-instrument agreement with the well-established NRC Reference Spectrofluorimeter and provides a reliable alternate traceability chain for calibration of fluorescent transfer standards for this particular measurement geometry.
In this section we report on the characterization and validation of this new reference instrument’s measurement capabilities, when configured in a sphere geometry.
It is assumed that the fluorescent component of the total spectral radiance factor is largely insensitive to changes in geometry whereas the reflected component is sensitive to geometric effects and needs to be directly validated for the appropriate measurement geometry. As mentioned in the introduction, this assumption is not valid for all types of samples [20,21] and needs to be independently verified for the selected comparison samples. The details of the characterization and validation procedure and results are reported below.
The integrating sphere accessory employed with the Reference Goniospectrofluorimeter is a 300 mm diameter integrating sphere coated with a propriety barium sulphate paint (®Spectraflect) to enable measurements of the hemispherical reflectance factors for an 8 degree: diffuse geometry, with the specular component either included (8°:di or 8:t) or excluded (8°:de or 8:d).
This characterization and validation for measurements in a sphere geometry has also been carried out in a step-wise fashion. First the instrument’s spectral characteristics were calibrated with the sphere accessory in place. The characterization and validation of the total hemispherical reflectance factor scale was then carried out by considering separately the reflected and fluorescent components For the characterization of the reflected component, we also report below the results with the original and modified sphere design. Figure 1 shows a schematic of the GSF configured with the modified sphere accessory. The entrance and exit apertures and the specular port on the sphere are all 37.6 mm in diameter, where the latter port has an aluminium flange and a removable white cap coated with the same material as the sphere wall which is installed for measurements in the 8:t geometry. The original sphere accessory had a single sample port of 37.6 mm diameter with a plastic flange and removable sample mount where the test sample or reference standard were positioned so that it operated in substitution mode. The modified sphere accessory has a second compensation or “dummy” port of 37.8 mm diameter so that it can be operated in comparison mode. This dummy port is positioned in the upper hemisphere at an angle of 60 degrees to the plane formed by the sample and exit ports, so that it is symmetrically located with respect to these ports and is only irradiated by the light reflected at the sphere wall and not directly by the incident beam.
3.1 Calibration of Spectral Characteristics – Sphere Geometry
As described in part 1 of this series of papers [1], to correct measured fluorescence data to standardized source conditions, it is necessary to measure and correct for the relative spectral distribution of the instrument source under the same geometric conditions as used for irradiation of the fluorescent sample. In the case of a sphere instrument, the
fluorescent sample is mounted at the sample aperture of the sphere and is illuminated at near-normal incidence and with no polarizer in the beam. Thus, the reference detector, a silicon photodiode (HMT S1227-1010BQ), was calibrated for absolute spectral responsivity over the spectral range 250 nm to 1000 nm for normal incidence (unpolarised conditions). The standard uncertainty for the NRC calibration of this standard detector under these conditions is given in Table 1. At the same time that the GSF excitation unit was calibrated for a sphere geometry, the monitor detector (EG&G HTE-2100) was also calibrated by comparison with the signal from the reference detector signal under these same spectral, geometric and polarization conditions.
The emission unit spectral calibration for a sphere geometry was performed using the calibrated detector, CD method which was already described in part 1 of this series of papers [1] and well-validated in the previously reported extension of the spectral range of the NRC Reference Spectrofluorimeter to the NIR region [31]. Thus, after calibration of the instrument’s excitation unit including the sphere accessory, as described above, it was then used to calibrate the spectral responsivity of the detection system by placing a white diffuse reflectance standard at the sphere sample port to provide a known spectral radiance at the sample position. The white reflectance standard was a freshly prepared pressed tablet of PTFE (1.0 ±0.1 gm/cm3), whose absolute 8:d diffuse spectral reflectance
factors are traceable to the NRC Absolute Reflectometer.
The advantage of this CD approach is even greater for sphere-based measurements than for bidirectional measurements, since the uncertainties of the reference detector are much lower for NRC calibrations at normal incidence, unpolarized conditions compared with the 45 degree incidence, s- and p-polarized conditions. As can
be seen from Table 1 and compared with the corresponding Table reported in the first paper of this series for the GSF in a bidirectional geometry (45a:0), [1] the uncertainties for the reference detector calibrated at normal incidence for the GSF in a sphere geometry are lower by a factor of 2 to 5.
3.2 Validation of Reflected Component – Original sphere design
For NRC diffuse reflectance measurements in the UV and visible spectral range, the traceability for the calibration of non-fluorescent materials is to the NRC Absolute Reflectometer [27]. This well-characterized reference instrument is used to realize an absolute hemispherical reflectance factor scale for both d:0 and 0:d geometry using an integrating sphere method, known as the Modified Sharp-Little method [27,32]. The metrological equivalence of the NRC absolute diffuse reflectance scale with that of other NMIs has been demonstrated by the results of international measurement comparisons [33,34].
The actual calibrations are typically carried out using transfer spectrophotometers that are research-grade commercial UV-visible-NIR double-beam spectrophotometers equipped with an integrating sphere accessory and a calibrated NRC white reflectance standard traceable to the NRC Absolute Reflectometer. The reference standard is typically a pressed tablet of PTFE powder using a standardized pressing procedure and a controlled density of 1.0 ± 0.1 gm/cm3[35]. The integrating sphere accessories that are
used with these transfer spectrophotometers are of different designs and different coating materials. As discussed in the previous section, this difference in thickness of sphere wall coating can introduce a significant sample recess error. For a given type of sample, such as glossy ceramic tiles or diffuse grey reflectance standards, the correction factor
due to sample recess for a given sphere instrument can be determined by the relative difference in the measured reflectance compared with a reference measurement employing an integrating sphere with a thin opaque coating, such as barium sulphate paint. At NRC, for a given sphere configuration, the sample recess correction factor that is used to scale the measured reflectance data and its associated standard uncertainty are determined, respectively, from the average relative difference with the reference measurements over a broad spectral range (typically spanning 400 - 600 nm) and its associated standard deviation.
The validation of the reflected-only component of the GSF for a sphere geometry has been carried out by comparison of measurements with one of NRC’s transfer spectrophotometers, a Perkin-Elmer Lambda 19 spectrophotometer equipped with a 150-mm diameter integrating sphere accessory coated with barium sulphate paint, that is operated in double-beam mode. This transfer spectrophotometer has been well-characterized using this sphere accessory and calibrated to give good agreement with the NRC Absolute Reflectometer with a standard uncertainty of better than 0.08% from 400 to 830 nm. In both cases, the measurement geometry is 8 degrees incidence and diffuse collection with the specular component excluded (8:d) and the non-fluorescent white reflectance standard was a freshly pressed tablet of PTFE powder, prepared according to an NRC quality system procedure. The absolute hemispherical reflectance factors of these NRC diffuse reflectance standards are traceable to the NRC Absolute Reflectometer. The associated standard uncertainties are based upon direct calibrations of representative reflectance standards on the NRC Absolute Reflectometer and the reproducibility of preparing these pressed tablets. These uncertainties for the transfer of
this NRC absolute diffuse reflectance scale using these reflection standards are given in Table 1 for the wavelength range of 250 nm to 1000 nm. The comparison samples used for validation of the performance of the GSF in a sphere geometry for the reflected component, included both non-fluorescent and fluorescent samples.
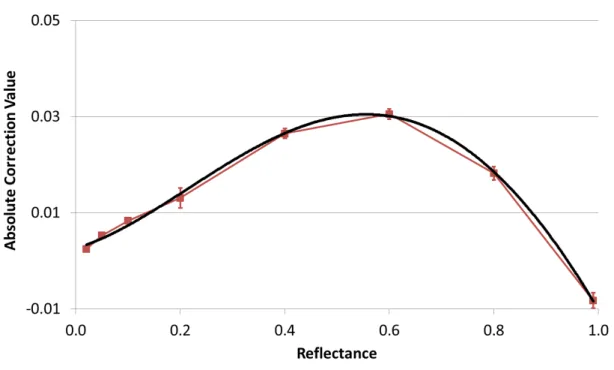
The non-fluorescent comparison samples were a series of eight grey Spectralon samples, ranging in nominal diffuse reflectance from 99% to 2%, that were measured over the spectral range 400 nm to 800 nm. It was found that there were significant differences between the measurements on the GSF and the PE19 that were insensitive to wavelength and only dependent upon reflectance level. Thus, for this comparison spectral range, the average calculated difference between these two sets of measurements for each grey Spectralon standard is plotted in Figure 2 against the average value of their absolute diffuse reflectance determined on the transfer spectrophotometer. It can be seen that this difference varies smoothly with a maximum value found with the nominally 60% reflectance Spectralon standard. A 3rd order polynomial fit was used to determine the associated correction function for this type of diffusely reflecting sample, which is known to be quite translucent [36]. The error bars are the expanded (k=2) uncertainty of the measurements performed on the PE19, so this absolute difference greatly exceeds the measurement uncertainty. However, the general shape of this error with reflectance level is very similar to that observed when measuring diffusely reflecting samples on the PE19 transfer spectrophotometer equipped with a sphere accessory that has a thick sintered PTFE coating, although the precise shape and absolute magnitude depend upon sample-induced effects, notably sample translucency [28]. In this case, the sphere error has largely been ascribed to sample recess, which was described in Section 2.
Based upon considerable experience at NRC measuring the optical properties of non-fluorescent paper standards, it is observed that they exhibit sample translucency effects very similar to Spectralon-based materials. Here we want to test the hypothesis that the correction function determined for the set of grey Spectralon standards measured on the GSF with sphere accessory can then be used to correct the measured reflectance of fluorescent paper standards on the GSF using a sphere geometry.
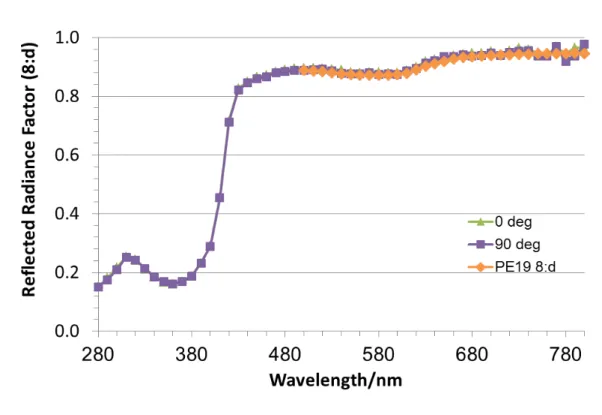
This test is illustrated in Figure 3, which shows measurements of the reflected-only component of the 8:d hemispherical reflectance factors of a fluorescent paper sample measured on the GSF in synchronous mode with, and without, applying the sphere correction function that is given in Figure 2. It can be seen that there is a significant difference between these two measurements. Also shown are the hemispherical reflectance factors in an 8:d geometry measured on the NRC transfer spectrophotometer, PE19 equipped with a 150 mm diameter integrating sphere reflectance accessory coated with barium sulphate that is operated in double-beam mode. These latter measurements were only recorded in the wavelength range from 500 nm to 800 nm which is not influenced by the excitation and emission characteristics of the sample and where a meaningful reflectance measurement can be performed. It can be seen that when the GSF measurements are corrected for the sphere error determined using the series of grey Spectralon samples, it gives good agreement with the NRC transfer spectrophotometer calibration results. This indicates that this type of sphere error which is independent of wavelength and dependent only on reflectance level is largely responsible for this discrepancy in the reflectance measurements.
However, the maximum sphere correction error of 3.0% at a nominal reflectance level of 60% that was observed with the GSF using this sphere accessory (see Figure 2) is much larger than that observed with the sphere accessories used with our transfer spectrophotometers, which typically give a maximum error of 0.6% [28]. It is considered that the larger error observed here is due not only to sample recess error but also the fact that the original sphere accessory used on the GSF was based on a substitution mode operation, whereas the sphere accessories used with our transfer spectrophotometers employ a double-beam comparison mode operation. As discussed in the Introduction, a single-beam sphere design can introduce a significant single-beam sample absorption substitution error. To reduce this additional source of sphere errors, the integrating sphere accessory was modified, as shown in Figure 1, with a second compensation or “dummy” port machined in the sphere wall. It was located well outside the field of view of the detector and of the incident beam so that it would only receive secondary-reflected radiation and was symmetrically positioned with respect to the entrance port and original sample port to reduce sphere asymmetry effects. This allowed the insertion of a second removable sample or standard so that the accessory could be operated in comparison-mode. In this mode of operation, the reference measurements are made with the white reflectance standard at the usual sample port, and the fluorescent sample under test placed at the “dummy” port. For the sample measurements, the white reflectance standard and the fluorescent sample are interchanged. Using this procedure, the average sphere efficiency should remain unchanged when measuring the fluorescent sample or standard.
The validation of the reflected component with the modified sphere design was carried out by repeating the validation procedures that were carried out in Section 3.2. The repeat measurements on the set of grey Spectralon samples using the re-designed sphere accessory and the absolute differences with the measurements on the PE19 are shown in Figure 4. The error bars are the expanded (k=-2) uncertainties for these diffuse reflectance measurements on the PE19. By comparison with Figure 2, it can be seen that the general shape of the error is still a smoothly varying function with reflectance level, but the nature of the difference is in the opposite direction and the absolute magnitude is a factor of 5 smaller. This result indicates that the significant sources of sphere-related errors have been effectively compensated using this modified sphere design. This finding was confirmed by carrying out repeat measurements on the fluorescent paper sample using the re-designed sphere accessory. These results are shown in Figure 5 and again compared with the results on the transfer spectrophotometer equipped with the 150-mm integrating sphere accessory coated with barium sulphate. For these repeat measurements, a Glan-Thompson polarizing prism was inserted in the collimated incident beam path of the GSF and the diffuse reflectance was measured for both s- and p-polarized conditions in order to experimentally check the polarization error introduced by a slightly oblique beam of 8 degrees. It can be seen that both these polarization results are in good agreement confirming that polarization effects are negligible. These results on the GSF using the modified sphere are also in very good agreement with the results on the transfer spectrophotometer. These good comparison results indicate that the single-beam substitution and sample recess errors have been effectively eliminated in this modified sphere design.
3.4 Validation of Fluorescent Component – Modified Sphere Design
The validation of the fluorescent component has been carried by comparison of measurements with the NRC Reference Spectrofluorimeter using fluorescent white paper and colored PTFE-based plastic fluorescent artifacts that are used by these industries as fluorescence transfer standards and require traceability to a sphere geometry. The selected fluorescent paper and plastic comparison artifacts also have very different spectral excitation and emission characteristics to provide a more critical test of possible sphere errors.
If the fluorescent particles are uniformly spread in these diffusely reflecting materials and relatively close to the surface, they exhibit isotropic emission which is close to ideally Lambertian, i.e. with a bispectral fluorescent radiance that is uniform in all viewing directions and, therefore independent of instrument measurement geometry [37]. The reflectance component of the paper and sintered PTFE substrates for these fluorescent materials is also generally assumed to be Lambertian. However, we have observed that the reflected component of these materials depends upon the instrument geometry. This is because the reflected component depends more on the surface properties and differences in surface roughness can give rise to geometry-dependence.
Recently it has been reported that if the fluorophore is incorporated in the bulk of the material rather than concentrated on the surface, which is the case for PTFE-based samples, it can result in non-isotropic effects that are equally large for the reflectance and the fluorescence emission [39]. However, when analysing the impact of using single geometry measurements to estimate 0:d reflectance factors for typical PTFE-based fluorescent diffuse reflectance standards, these authors found that these errors are
minimal at bidirectional geometries of 45:0 and 0:45 [39]. Thus, the approach used here of using near-Lambertian fluorescent reflecting materials for validating fluorescence component measurements using the GSF for a sphere geometry (8:d) by comparison with results obtained using a 45:0 geometry, remains valid. For estimation of the fluorescent component for other bidirectional geometries, an alternative approach may be required.
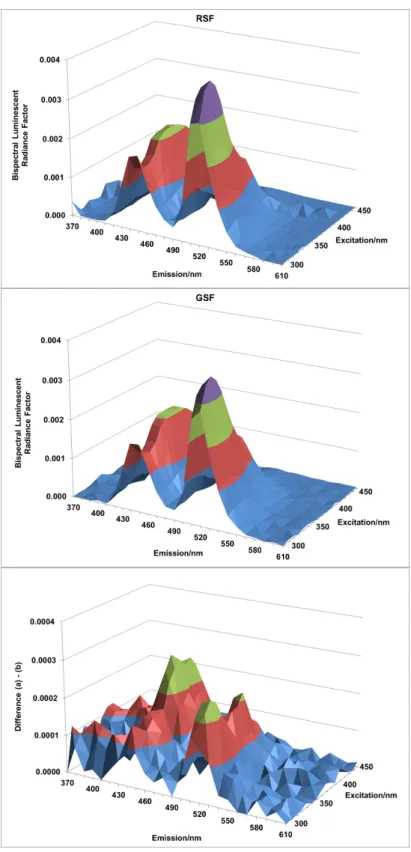
The fluorescent paper comparison artifact was selected from a stock of fluorescent paper pads currently used by the authorized labs for the paper industry as international reference standards for calibration of ISO 2469-conforming sphere-based instruments, for optical property measurements of paper, pulp and board samples [8]. As in the first-part of this series of papers, the bispectral fluorescence measurements on this paper pad were performed over an excitation range of 280 nm to 400 nm and an emission range of 370 nm to 620 nm at 10 nm intervals and then using a cubic spline interpolation function to provide data at 5 nm intervals. The normalized bispectral fluorescence results are shown in Figure 6 (top) and compared with the corresponding results on the NRC RSF in Figure 6 (centre). The absolute difference plot is shown in Figure 6 (bottom) on an expanded scale and shows that these differences are essentially at the noise-level, being about 3% of the maximum signal.
The fluorescent plastic comparison artefact was a blue-green plastic sample that is commercially available from Avian Technologies. As in the first-part of this series of papers [1], the bispectral fluorescence measurements on this plastic standard were performed over an excitation range of 300 nm to 450 nm and an emission range of 370 nm to 630 nm at 10 nm intervals and interpolating these data to 5 nm intervals. These results are shown in Figures 7 (top) and 7 (centre), respectively and Figure 7 (bottom)
shows the difference plot on an expanded scale. In this case, the difference also appears to be noise-limited. These comparison results for the fluorescent paper and plastic samples confirm our assumption of geometric dependence for the fluorescent component at least for these types of samples. This also validates our approach to achieving traceability of the fluorescent component for a sphere geometry by direct comparison to the fluorescence scale established using the higher accuracy bidirectional 45:0 geometry.
4. Uncertainty budget for sphere geometry
The main uncertainty components for fluorescence measurements using a
two-monochromator method and physical transfer standards are described in detail in several references [3,4,39,40]. The uncertainty budget for the new NRC Reference
Goniospectrofluorimeter configured for bidirectional 45a:0 geometry was presented in part 1 of this two part series of papers [1]. In both bidirectional and sphere geometries, the dominant sources of uncertainty are the uncertainties in the physical transfer standards calibrated under these same conditions.
In the case of fluorescence measurements on the GSF in a sphere geometry, the physical transfer standards have been calibrated for normal incidence and unpolarised radiation and their Type B uncertainties for these geometric conditions are given in Table 1. Although this is not strictly the same geometry as used in the modified sphere design (8:d or 8:t), the effect of such obliquity, for angles of incidence less than 15 degrees is generally ignored [41]. As experimentally confirmed in Section 3.3, the polarization effects for 8 degrees incidence are negligible.. The analysis of the Type B uncertainty components due to wavelength scale, spectral bandpass, and detector nonlinearity were described in part 1 of this series of papers [1]. The primary Type A uncertainty
components are the reproducibility of the reflectance and of the bispectral luminescent radiance factor measurements. These components were evaluated by three replicate measurements of a typical fluorescent paper pad standard with repositioning of the sample between repeat runs. These Type A and Type B uncertainty components and their contribution to fluorescence measurements in a sphere geometry are summarized in Table 2. The overall uncertainties for total spectral radiance factor measurements on the GSF in a sphere geometry were calculated according to the methods described in the Guide to the Expression of Uncertainty in Measurement [42]. The estimate for the residual sphere error with the modified sphere design was determined according to the procedure described in Section 3.3 using a set of grey Spectralon samples that had been calibrated on the NRC transfer spectrophotometer for an 8:d geometry. This uncertainty analysis gives state-of-the-art accuracies for fluorescence measurements in a sphere geometry (8:d) in the visible range of 0.9%. This compares extremely well with the state-of-the-art accuracy of 0.8% in the visible range that was achieved with this instrument when configured in the referee bidirectional geometry (45:0). [1]
5. Conclusion
In conclusion, a new reference goniospectrofluorimeter has been characterized at NRC for total spectral radiance factor calibration of fluorescent reflecting materials in the spectral range 230 nm to 800 nm. In part 1 of this series of papers [1], we validated its performance for the referee geometry for highest accuracy colorimetric applications - a bidirectional geometry (45a:0) that is employed in all current reference instruments for fluorescence colorimetry. In part 2 of this series, we extended this characterization to a sphere geometry (8:d) with a well-characterized uncertainty to provide an uninterrupted
link for improved traceability. This provides an extension in scope of NRC primary-level fluorescence measurement capabilities to different illuminating and viewing geometries, which includes a sphere geometry. This development of a new versatile reference instrument for fluorescence measurements in a sphere geometry is important to meeting client needs for improved traceability for this measurement geometry which is often specified in practical colorimetric applications, such as the calibration of fluorescent reference standards for the paper and textile industries for whiteness specifications.
Compared with the well-established NRC Reference Spectrofluorimeter, the new fluorescent reference instrument also offers several other advantages, including the ability to measure the gonioreflectance properties of both non-fluorescent and fluorescent reflecting materials. This will be the focus of future work to further extend NRC color measurement capabilities to meet the emerging challenges of accurately measuring the color appearance of special effect colored materials used in automotive paints, security coatings and in the cosmetics industry.
Acknowledgements
The authors acknowledge 3M Company in St. Paul, MN for their generous donation to NRC of the original instrument and to student Colin Brennan for upgrading the original LabView software.
References:
[1] Joanne Zwinkels, William Neil, Mario Noël, “Characterization of a Versatile Reference Instrument for Traceable Measurements using Different Illumination
and Viewing Geometries Specified in Practical Colorimetry – Part 1: Bidirectional Geometry (45:0)”, Metrologia, 53, 1215-1230 (2016)
[2] Michael J. Shaw, Peter J. Clarke and Timothy A. Burnin, “The design of the new NPL reference spectrofluorimeter”, Proc. of SPIE, 5192, 30-35 (2003).
[3] J.C. Zwinkels, D.S. Gignac, M. Nevins, I. Powell, and A. Bewsher, “Design and testing of a two-monochromator reference spectrofluorimeter for high-accuracy total radiance factor measurements”, Applied Optics, 36, 892-902 (1997).
[4] CIE 182:2007 Calibration Methods and Photoluminescent Standards for Total
Radiance Factor Measurements (CIE Central Bureau, Vienna, 2007)
[5] CIE 15:2004, Colorimetry, 3rded. (CIE Central Bureau, Vienna, 2004)
[6] ASTM E2153 Obtaining Bispectral Photometric Data for Evaluation of
Fluorescent Color
[7] D.H. Alman and F.W. Billmeyer, Jr., “Integrating-sphere errors in the colorimetry of fluorescent materials”, Color Res. Appl., 1, 141-145 (1976)
[8] International Standard ISO 2469:2014 Paper, board and pulps – Measurement of
diffuse radiance factor (diffuse reflectance factor) (ISO CS, Geneva, 2014)
[9] International Standard ISO 2470-1:2009 Paper, board and pulps – Measurement
of diffuse blue reflectance factor – Part 1: Indoor daylight conditions (ISO brightness) (ISO CS, Geneva, 2009)
[10] International Standard ISO 11476-2:2010 Paper and board – Determination of
CIE whiteness, C/2 degrees (indoor illumination conditions), (ISO CS, Geneva,
2010)
colour by diffuse reflectance – Part 3: Indoor illumination conditions (D50/2 degrees)
[12] W. Wm. Wendlandt and H.G. Hecht, in Reflectance Spectroscopy (Interscience Publishers, New York, 1966), 253-274.
[13] J.A. Jacquez and H.F. Kuppenheim, “Theory of the integrating sphere”, J. Opt.
Soc. Am., 45, 460-470 (1955).
[14] R. Donaldson, “Spectrophotometry of fluorescent pigments”, Brit. J. Appl. Phys.,
5, 310-224 (1954).
[15] F. Grum, “Colorimetry of fluorescent materials”, in Optical Radiation
Measurements, Volume 2: Color Measurement (Academic Press, New York,
1980)
[16] F. Grum, “Instrumentation in fluorescence measurements”, J. Color Appear., 1, 18-27 (1972)
[17] D. Gundlach and H. Terstiege, “Problems in measurement of fluorescent materials”, Color Res. Appl., 19, 427-436 (1994)
[18] F.J.J.Clarke, “Problems of spectrofluorimetric standards for reflection and colorimetric use”, NPL Report MOM12, August 1975.
[19] Rona A. McKinnon, “Solid standards in fluorescence spectrometry”, in Advances
in Standards and Methodology in Spectrophotometry (edited by C. Burgess and
K.D. Mielenz, Elsevier Science Publishers, Amsterdam, 1987) [20] S. Holopainen, F. Manoocheri, and E. Ikonen, “Goniofluorometer for
characterization of fluorescent materials,” Appl. Opt. 47, 835–842 (2008).
characterization of fluorescent materials: erratum”, Appl. Opt. 47, 6880 (2008). [22] Berta Bernad, Alejandro Ferrero, Alicia Pons, M.L. Hernanz, Joaquin Campos,
“Upgrade of goniospectrophotometer GEFE for near-field scattering and fluorescence radiance measurements”, Proc. SPIE, 9398 (2015).
[23] CIE Publication No. 44 (TC 2-3), 1979, “Absolute methods for reflection measurements”, CIE, Paris, France
[24] Silja Holopainen, Farshid Manoocheri, Marko Laurila and Erkki Ikonen, “Goniofluorometer for spectral quantum yield measurements”, Appl. Opt., 47, 835-42 (2008)
[25] IEC 62607-3-1. Nanomanufacturing – key control characteristics of luminescent nanomaterials, part 1: quantum efficiency
[26] J.C. Zwinkels and C.X. Dodd, “Errors and accuracies in integrating sphere measurements on diffuse reflectance and transmittance”, Non-Nuclear Energies
Workshop on Optical Property Measurement Techniques, Ispra, Italy, (27-29
October 1997), EUR 11607, 43-51 (1988).
[27] W. Budde and C.X. Dodd, “Absolute Reflectance Measurements in the d/o Geometry”, Die Farbe, 19, 94-102 (1970)
[28] Réjean Baribeau and Joanne Zwinkels, “Comparison of NRC goniometric and integrating sphere methods for realizing an absolute diffuse reflectance scale”,
Proc. SPIE, Vol. 8495, A1-A10 (2012)
[29] P. Corredera, M.L. Hernanz, M. Gonz´alez-Herr´aez and J.Campos, “Anomalous non-linear behaviour of InGaAs photodiodes with overfilled illumination”,
[30] F.J.J. Clarke and J.Anne Compton, “Correction methods for integrating sphere measurement of hemispherical reflectance”, Color Res. Appl., 11, 253-262 (1986) [31] J.C. Zwinkels, M. Noël, and S. Hillman, “Near-infrared photoluminescence of orange color standards – then and now”, J. Mod. Opt., 60, 1115-1123 (2013) [32] C.H. Sharp and F.W. Little, “Measurement of reflection factor”, Trans. Illum.
Eng. Soc. (London), 15, 802-910 (1920).
[33] M. Nadal, K.L. Eckerle and Y. Ohno, “Final report on the key comparison CCPR-K5: spectral diffuse reflectance”, Metrologia, 50, Tech. Suppl., Issue 1A, 02003 (2013)
[34] J.C. Zwinkels and W. Erb, "Comparison of absolute d/0 diffuse reflectance factor
scales of the NRC and the PTB", Metrologia, 34, 357-363 (1997). [35] V.R. Weidner and J.J. Hsia, “Reflection properties of powdered
polytetrafluoroethylene powder”, J. Opt. Soc. Am., 71, 856-861 (1981) [36] Spectralon ® Design Guidelines - Labsphere
[37] T. Treibitz, Z. Muez, B.G. Mitchell and D. Kriegman, “Shape from Fluorescence” in Proceedings Part VII, ECCV 2012: 12thEuropean Conference on Computer
Vision, Florence, Italy, 7-13 October 2012, pp. 292-306 (Springer, Cambridge,
2012)
[38] P. Jaanson, T. Pulli, F. Manoocheri and E. Ikonen, “A reference material with close to Lambertian reflectance and fluorescence emission profiles”, Metrologia,
53, 1330-1338 (2016)
at the National Research Council of Canada for High-accuracy Fluorescence Measurements", Analytica Chimica Acta, 380, 193-209 (1999).
[40] J. Zwinkels, P. DeRose and J. Leland, “Chapter 7: Fluorescence Measurements”, in Spectrophotometry: Accurate Measurement of Optical Properties of Materials (Academic Press, 2014)
[41] D.W. Berreman, “Kramers-Kronig Analysis of Reflectance Measured at Oblique Incidence”, Appl. Opt., 6, 1519-1521 (1967)
[42] JCGM 100:2008 “Evaluation of measurement data – Guide to the expression of uncertainty in measurement (GUM 1995 with minor corrections)”
List of Tables
Table 1. Uncertainties in Reference Standards Used with the NRC
Reference Goniospectrofluorimeter for Sphere-based (8:d) Fluorescence Measurements (k=1)
Standard, (Quantity) Type Range (nm)Spectral Standard Uncertainty (%) Standard detector unit, (Rref)
Normal incidence, unpolarized B
250 - 295 1.25
300 - 440 0.30
445 - 945 0.13
950 - 1000 0.25
Monitor detector unit (Rrmon)
Normal incidence, unpolarized A
250 - 300 0.01
300 - 400 0.003
400-850 0.01
Fluorescent validation standard A 300 - 850 0.20
Non-fluorescent reflecting standard, () B
250 - 270 0.31 275 - 295 0.26 300 - 320 0.21 325 - 345 0.16 350 - 390 0.11 400 - 830 0.08
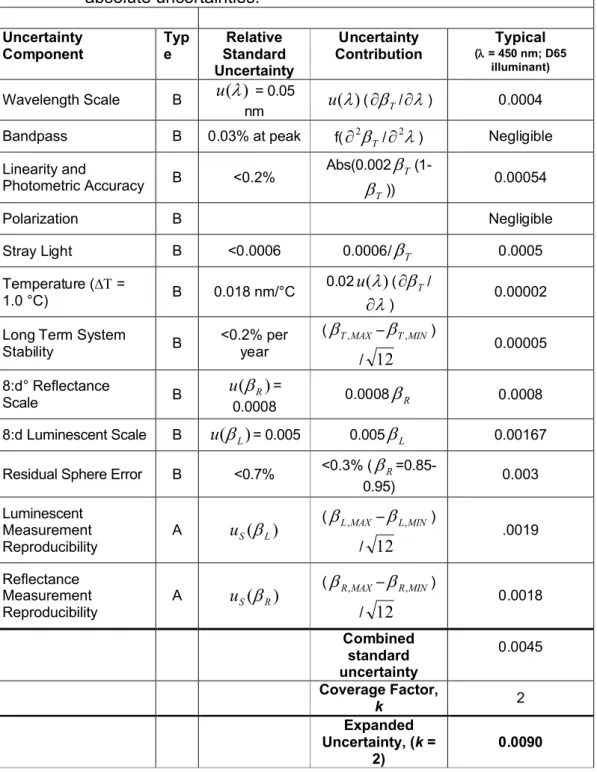
Table 2. Representative Uncertainty Budget for the Total Radiance
Factors of a Fluorescent Paper Pad Standard Measured on NRC Reference Goniospectrofluorimeter (GSF) using a Sphere Geometry (8:d) in the Visible Range. Typical uncertainties are absolute uncertainties. Uncertainty Component Typ e Relative Standard Uncertainty Uncertainty Contribution Typical ( = 450 nm; D65 illuminant) Wavelength Scale B u() = 0.05 nm u()(T/) 0.0004
Bandpass B 0.03% at peak f(2T/2) Negligible
Linearity and Photometric Accuracy B <0.2% Abs(0.002T (1-T )) 0.00054 Polarization B Negligible Stray Light B <0.0006 0.0006/T 0.0005 Temperature ( = 1.0 °C) B 0.018 nm/°C 0.02u()(T/ ) 0.00002
Long Term System
Stability B <0.2% per year (T ,MAX–T ,MIN) / 12 0.00005 8:d° Reflectance Scale B ) ( R u = 0.0008 0.0008R 0.0008 8:d Luminescent Scale B u(L)= 0.005 0.005L 0.00167 Residual Sphere Error B <0.7% <0.3% (R
=0.85-0.95) 0.003 Luminescent Measurement Reproducibility A uS(L) (L,MAX–L,MIN) / 12 .0019 Reflectance Measurement Reproducibility A uS(R) (R,MAX–R,MIN) / 12 0.0018 Combined standard uncertainty 0.0045 Coverage Factor, k 2 Expanded Uncertainty, (k = 2) 0.0090
List of Figures
Figure 1: Schematic of NRC reference goniospectrofluorimeter (GSF) equipped with the
re-designed 300 mm diameter integrating sphere accessory (8:d and 8:t) geometry, operated in comparison-mode.
Figure 2. Single-beam substitution error for GSF for hemispherical reflectance measurements (8:d) with original sphere design operated in substitution-mode; error was determined using a series of grey Spectralon standards calibrated on the NRC transfer spectrophotometer that is traceable to NRC Absolute Reflectometer. The solid line is a 3rddegree polynomial fit to these data and the uncertainty bars are the expanded (k=2) uncertainties for these measurements on the NRC transfer spectrophotometer.
Figure 3. Validation of performance of GSF for diffuse reflectance measurements in a sphere geometry (8:d) using a fluorescent paper pad as a comparison sample and comparing results with the NRC transfer spectrophotometer equipped with a 150-mm integrating sphere accessory; the GSF results shown by the green curve were after correction for the single-beam substitution error shown in Figure 2.
Figure 4. Double-beam substitution error for GSF for hemispherical reflectance measurements (8:d) with modified sphere design operated in comparison-mode; error was determined using a series of grey Spectralon standards calibrated on the NRC transfer spectrophotometer that is traceable to NRC Absolute Reflectometer. The solid line is a 3rddegree polynomial fit to these data and the uncertainty bars are the expanded (k=2) uncertainties for these measurements on the NRC transfer spectrophotometer.
Figure 5. Validation of performance of GSF for diffuse reflectance measurements (8:d geometry) with the re-designed sphere accessory operated in comparison mode using a fluorescent paper pad as a comparison sample and comparing results with the NRC transfer spectrophotometer (PE-19) equipped with a 150-mm integrating sphere accessory in 8:d geometry; the GSF measurements were performed for s- and p-polarised incident radiation and show no polarization-dependence or need for sphere correction to give excellent agreement with transfer instrument results.
Figure 6. Validation of GSF for bispectral fluorescence measurements in a sphere (8:d) geometry using a fluorescent white paper pad as comparison sample with results on NRC Reference Spectrofluorimeter in a bidirectional (45a:0) geometry (RSF). 6 top) Measurement result on GSP; 6 centre) Measurement result on RSF; 6 bottom) Difference plot of RSF-GSF (expanded scale).
re-comparison sample with results on NRC Reference Spectrofluorimeter (RSF) in a bidirectional (45a:0) geometry. 7 top: Measurement result on GSP; 7 centre: Measurement result on RSF; 7 bottom: Difference plot of RSF-GSF (expanded scale).