A Contact Force Sensor for Medical Jet Injection ARCHINES
by
MASSACHUSES INSTITUTEOF TECHNOLOGYNickolas Peter Demas
OCT 0 12015
B.S. Mechanical Engineering, Yale University (2013)
LIBRARIES
Submitted to the Department of Mechanical Engineering
in partial fulfillment of the requirements for the degree of
Master of Science in Mechanical Engineering
at the
MASSACHUSETTS INSTITUTE OF TECHNOLOGY
September 2015
@
Massachusetts Institute of Technology 2015. All rights reserved.
Signature redacted
A uthor
...
...
Department of Mechanical Engineering
August 8, 2015
Signature redacted
Certified by...
...
...
Ian W. Hunter
Hatsopoulos Professor of Mechanical Engineering
Thesis Supervisor
Accepted by
...
Signature redacted
Darid E. Hardt
Chairman, Department Committee on Graduate Theses
A Contact Force Sensor for Medical Jet Injection
by
Nickolas Peter Demas
Submitted to the Department of Mechanical Engineering on August 8, 2015, in partial fulfillment of the
requirements for the degree of
Master of Science in Mechanical Engineering
Abstract
Medical jet injection, in which a narrow fluid drug stream is propelled into the skin without a needle, was first conceived in the 1940s [1]. However, a major drawback of most injectors is the lack of controllability of jet parameters. Recent work at the BioInstrumentation Laboratory at MIT has resulted in a tunable, high-performance linear Lorentz-force jet injector which allows for careful control of many injection variables. The sensor presented in this thesis further improves the ability to quantify and control contact forces between the injection nozzle and tissue. This sensor uses a three-spoke flexure system with full-bridge strain gauge assemblies mounted on each flexural arm to measure both normal and lateral forces applied to the nozzle. The design, fabrication, calibration, and validation for the sensor are detailed along with results for preliminary tissue injections into ex vivo porcine tissue. These preliminary tests showed higher percent volume delivery to the tissue with an elevated normal force. Under normal forces of 4 to 8 N, the BioInstrumentation Lab's jet injector achieved percent volume delivery of 89.1 5.1%, whereas with normal forces of 0 to
4 N, the percent volume delivery was 68.9 t 12.7%.
Thesis Supervisor: Ian W. Hunter
Acknowledgments
I would like to thank Professor Ian Hunter for the opportunity to work in his group.
The resources available at the BioInstrumentation Laboratory have been absolutely outstanding. His encouragement and guidance have helped me mature as an engineer and I am sincerely grateful to be a member of the lab.
My colleagues and good friends in the BioInstrumentation Laboratory have been
incredibly helpful in my pursuits at MIT. Dr. Brian Hemond and Mike Nawrot, co-inventors on the provisional patent filed for the force sensor developed in this thesis, both acted as great sounding boards for my ideas and helped many times with
debugging and troubleshooting. Dr. Yi (Ellen) Chen, Dr. Jean Chang, and Dr. Eli
Paster were always willing to take a pause in their own work to to discuss my research questions, for which I am extremely appreciative. Thanks to the current lab gang including Dr. Cathy Hogan, Ashley Brown, Craig Cheney, John Liu, Kate Melvin, Seyed Mirvakili, Ashin Modak, Geehoon Park, and Anshul Singhal who make work in the lab fun, fast-paced, and intellectually stimulating and are always willing to lend a helping hand or offer advice. A special thanks to Ian, Cathy, John, and Ashin for reviewing and providing feedback on this thesis.
I am grateful to my parents and brother for their never-ending encouragement and love. I do not know the words to express how lucky I am to have Dad, Mom and Christopher. I would also like to thank all of the members of my extended family. I am so fortunate to have their love and support as well. I love you all.
I would like to thank Jerry Wang, my roommate, co-conspirator, and best friend. Thanks to him, the time during our master's degrees has been filled with great mem-ories, gut-hurting laughter, a pinch of ridiculousness (actually, make that eleven fully filled canisters), and a very needed dose of sanity every now and again. I am so lucky to have a best bud like him.
I finally would like to thank my girlfriend, Nozomi Nakajima. Her encouragement, kindness, and love help me to excel and I am eternally grateful to her for getting me through the tough times and putting up with my nonsense. I love you, Mimi.
Contents
Abstract 3 Acknowledgments 5 Contents 7 List of Figures 11 List of Tables 15 1 Introduction 171.1 Brief History of Medical Injection . . . . 17
1.2 M edical Jet Injection . . . . 18
1.3 Lorentz-Force Actuated Jet Injector . . . . 19
1.4 Effect of Contact Force Variation . . . . 22
1.5 Contact Force Application Scenarios . . . . 24
1.6 Previous Methods of Measuring and Controlling Contact Force . . . . 26
1.7 Aim s of this Thesis . . . . 28
2 Design 31 2.1 Overview and FRDPARRC Table . . . . 31
2.2 Functional Requirements . . . . 32
2.3 Design Parameters and Associated Analysis and Research . . . . 34
2.3.1 Sensor Location . . . . 34
2.3.3 Flexure N um ber . . . .
2.4 Further Analysis and Research . . . . 45
2.4.1 Gauge Configuration . . . . 45
2.4.2 Flexure Design . . . . 45
2.4.3 Static FEA . . . . 56
2.4.4 Dynamic FEA . . . . 60
2.4.5 Sensor M odel . . . . 60
2.5 Risks and Countermeasures . . . . 65
2.5.1 Sensor Location . . . . 65 2.5.2 Sensor Type . . . . 68 2.5.3 Gauge Configuration . . . . 69 2.5.4 Sensor M odel . . . . 70 2.5.5 Flexure Design . . . . 70 2.6 Summ ary . . . . 70
3 Prototype and Revised Sensor 71 3.1 Bench-Level Prototype . . . . 71
3.1.1 Flexure . . . . 72
3.1.2 Adapter . . . . 72
3.1.3 Surface Preparation and Gauge Mounting . . . . 73
3.1.4 Strain Relief . . . . 75
3.1.5 Assembly . . . . 75
3.1.6 DAQ System . . . . 77
3.1.7 Software . . . . 77
3.1.8 Preliminary Qualitative Testing . . . . 77
3.2 Revised Force Sensor . . . . 80
3.2.1 Prototype Shortcomings and Additional Requirements . . . . 80
3.2.2 New Design . . . . 84
3.3 Summ ary . . . . 93 8
4 Calibration and Validation
4.1 Normal Force Calibration ... 4.2 Lateral Force Calibration ...
4.3 Bandwidth Validation . . . . 4.4 Ejected Volume . . . . 4.5 Sum m ary . . . .
5 Tissue Testing
5.1 Preliminary Skin Analog Injections . . . . .
5.2 Experimental Setup and Procedure . . . . .
5.3 R esults . . . . 5.4 Summ ary . . . . 6 Future Work 6.1 Design Improvements . . . . 6.1.1 Force Sensor . . . . 6.1.2 DAQ . . . . 6.1.3 Force Display... 6.2 Interlock . . . .
6.3 Real-time Monitoring of Velocity 6.4 Further Animal Tissue Testing .
6.5 Human Trials . . . . 6.6 Summary . . . . 7 Conclusion Bibliography 95 95 99 99 102 105 109 109 111 114 114 117 117 119 121 122 123 123 126 126 127 129 131 . . . . . . . .
List of Figures
. . . . 20 . . . . 21 . . . . 22 . . . . 23 . . . . 25 . . . . 27 . . . . 28Selection of JIs, sorted by energy source. . . . . Depth and volume delivery in needle injection. . . . . . Depth and volume delivery in jet injection. . . . . Jet velocity profile. . . . . Orthogonal loads on nozzle. . . . . Possible nozzle loading conditions. . . . . Current commercial JI application. . . . . Induced volume error. . . . . Potential sensor locations. . . . . Strain gauge, FSR, and piezo electric sensing elements. Michelson laser interferometer. . . . . Wheatstone full-bridge configuration. . . . . Wheatstone full-bridge sensitivity to applied loads. . . 33 36 41 42 45 46 2-7 Fixed/Guided and Fixed/Free flexure configurations and analysis. . . 48
2-8 Proposed Fixed/Quasi-Free flexure configuration. . . . . 49
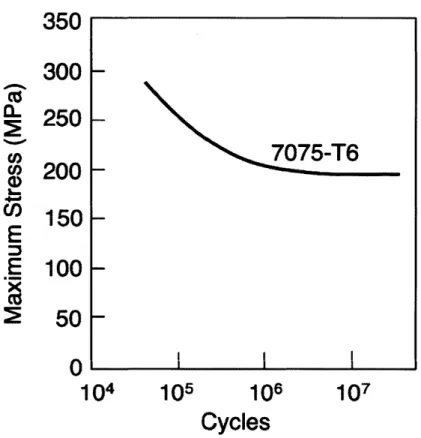
2-9 S-N curve for 7075 aluminum. . . . . 50
2-10 2D beam bending superposition plots . . . . 53
2-11 Normalized minimum optimal flexure length versus normalized cutout height for Fixed/Quasi-Free flexure. . . . . 54
2-12 Strain at selected locations versus normalized cutout height for Fixed/Quasi-Free flexures. . . . . 55
2-13 FEA displacement results due to 300 N axial load. . . . . 57 1-1 1-2 1-3 1-4 1-5 1-6 1-7 2-1 2-2 2-3 2-4 2-5 2-6
2-14 2-15 2-16 2-17 2-18 2-19
FEA stress results due to 300 N axial load. . . . . FEA percent strain results due to 300 N axial load. . . . .
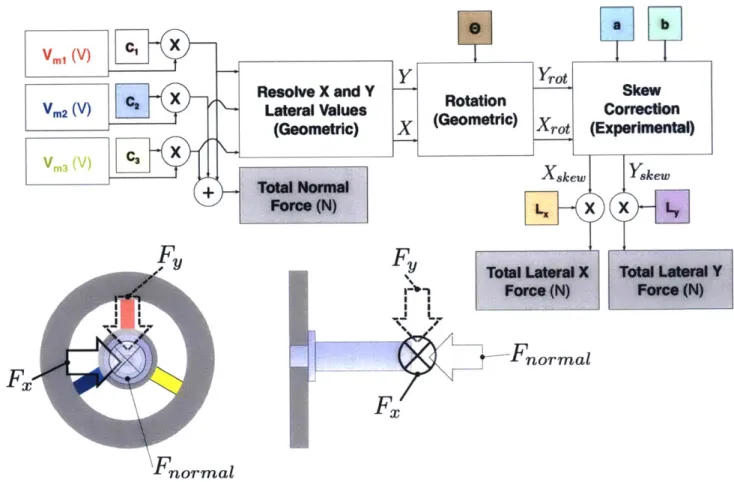
OMEGA® SGD-2/350-DY41 dual grid strain gauge package. . . . . . Strain distribution due to 300 N axial load with gauge overlaid. . . . . Preliminary dynamic FEA results. . . . . Full sensor model for deriving normal and lateral forces applied to the tip of the nozzle. . . . .
2-20 Rotation and skew of measured lateral forces.
Fabricated prototype flexure system. . . . .
Fabricated prototype adapter. . . . . Gauge mounting intermediate step. . . . . Gauge and strain relief pad mounted. . . . . Assembled prototype sensor top view. . . . . Assembled prototype sensor with ampoule. . . . . Prototype LabVIEW6 front panel. . . . . Normal and lateral force application on nozzle with prototype Annotated assembled prototype with ampoule. . . . . Sensor and cable connection locations. . . . .
Michael Nawrot's quick-release adapter. . . . . Revised sensor preliminary CAD. . . . .
Ribbon cables .. . . . . Handle connection evolution. . . . . Components and assembly steps for the revised sensor. . . Improved strain relief. . . . .
Modified rotating ring actuator assembled on new adapter. Preliminary splashguard concept. . . . .
Final splashguard flexure profile. . . . .
Final splashguard. . . . .
LabVIEW9 integration with the JI for human injection. .
. . . . 72 . . . . 73 . . . . 74 . . . . 75 . . . . 76 . . . . 78 . . . . 79 instrument. 81 . . . . 82 . . . . 83 . . . . 83 . . . . 85 . . . . 86 . . . . 87 . . . . 88 . . . . 89 . . . . 90 . . . . 91 . . . . 92 . . . . 93 . . . . 94 12 58 58 59 60 61 63 66 3-1 3-2 3-3 3-4 3-5 3-6 3-7 3-8 3-9 3-10 3-11 3-12 3-13 3-14 3-15 3-16 3-17 3-18 3-19 3-20 3-21
4-1 Normal force calibration jig illustration . . . . 96
4-2 Normal force calibration jig. . . . . 97
4-3 Measured bridge voltage versus flexure load. . . . . 98
4-4 Lateral force calibration jig with lateral calibrator plate detail. . . . . 100
4-5 Lateral force calibration validation plot. . . . . 101
4-6 Revised sensor simplified dynamic FEA geometry. . . . . 103
4-7 Revised sensor dynamic FEA experimental setup graphic. . . . . 105
4-8 Bode plot results. . . . . 106
4-9 Coherence squared results. . . . . 107
4-10 Volume validation results. . . . . 108
5-1 Injections into skin analog with varied contact force. . . . . 110
5-2 Porcine tissue block injection sites, top view. . . . . 112
5-3 Porcine tissue block injection sites, representative sections. . . . . 113
5-4 Porcine tissue injected volume versus normal force. . . . . 115
5-5 Porcine tissue penetration depth versus normal force. . . . . 115
6-1 Proposed next revision with updated systems. . . . . 118
6-2 One piece PCB concept sketch. . . . . 119
6-3 Various PCB cross-section concepts. . . . . 120
6-4 Applied lateral force with resolved phantom normal force. . . . . 121
6-5 Current and desired display paradigms. . . . . 122
6-6 Forces on ampoule during firing. . . . . 124
6-7 Comparison of potentiometer and force sensor derived velocities versus prescribed velocity. . . . . 125
List of Tables
2.1 FRDPARRC design outline. ... 32
2.2 Sensor location Pugh chart. . . . . 37
2.3 Sensor type Pugh chart. ... ... 39
2.4 Flexure arm number benefits and drawbacks. . . . . 44
2.5 Instrument lateral model outputs given vertical bending assumptions. 64 2.6 Risks and countermeasures with force sensor at post-actuator location. 67 2.7 Risks and countermeasures with foil strain gauge sensor type. .... 68
2.8 Risks and countermeasures with gauge configuration. . . . . 69
Chapter 1
Introduction
"I have injected Wine and Ale in a living Dog into the Mass of Blood by a Veine, in good Quantities, till I have made him extremely drunk"
- Sir Christopher Wren, early pioneer of intravenous injection, in an undated letter to associate William Petty describing one of his first injections, 1656-8 [2]
1.1
Brief History of Medical Injection
Medical injection is a particularly attractive administration route for many treatments given some unique benefits. Injection offers a viable method of drug administration for drugs that are poorly absorbed or ineffective when given by other methods [3].
Additionally, both rapid and delayed responses can be achieved with injections to
particular tissue structures [4].
Hypodermic needles are the oldest method for injecting substances into living creatures. One of the earliest injections on record was by a British scientist, math-ematician, and architect by the name of Sir Christopher Wren [5]. With a needle, Wren set out to introduce liquid poison into an animal's bloodstream by mimicking the bite of a viper. Around 1655, in the presence of various physicians and virtuosi, Wren performed an intravenous injection of warm opium and white wine with a nar-row pipe into the rump of a canine. Once released, the dog immediately began to
stagger around. With a comical disregard for the scientific and medical magnitude of the accomplishment, those in attendance began to offer bets as to whether the animal would perish. However, Robert Boyle (the dog's owner and colleague of Wren) was anxious to keep his dog for further observation and had him whipped around the lawn until he came out of his drunken stupor [2].
From its use by Wren in the 1600s, hypodermic injection by needle has unarguably advanced significantly and represents the current standard of care for nearly all in-jected medicines. It is not, however, without deficits. From the patient's perspective,
pain is a common complaint [4]. Additionally, over 20% of individuals suffer from some degree of hypodermic needle fear
16].
Pain and the associated fear of needles can cause noncompliance with prescribed treatment or avoidance of medical care al-together [6]. When administering treatment via needle, caregivers also are exposed to risk of injury or infection from a needlestick (or a break in the skin caused by a needle). In the U.S. annually, estimates put the risk of needlestick at approximately one in seven healthcare workers [7]. This can lead to the transmission of HIV, hepati-tis C and B, TB, syphilis, malaria, herpes, diphtheria, gonorrhea, typhus, and Rocky Mountain spotted fever [7].1.2
Medical Jet Injection
Jet injection is the process by which a very narrow, high-velocity stream of fluid pen-etrates tissue without a hypodermic needle. The first patent to apply this principle to the injection of medicine was filed in 1943 [1] and since the inception of this injec-tion paradigm, the varieties of commercially available jet injectors (JIs) have grown substantially. While mass-campaign JIs with multi-use nozzles were deployed suc-cessfully to eradicate diseases such as smallpox in the 1970s [8], cross-contamination issues [91 prevented widespread adoption and caused multi-use nozzle JIs to fall out of favor [10]. JIs with single-use nozzles do not suffer from cross-contamination issues and have emerged as viable methods for delivering insulin, anesthetics, and other transdermal treatments [11, 12, 13, 14, 15, 16]. A selection of these JIs are shown in
Figure 1-1, sorted by energy source.
Single-use nozzle Js offer benefits over traditional hypodermics. As compared to needle injection, pain sensation with jet injection is likely be reduced due to the small liquid jet diameter [17]. Additionally, many of the issues associated with needle fear and needlestick injuries are eliminated with jet injection. But for JIs to compete with traditional needles, injection precision and accuracy with delivered depth and volume is critical. Treatments prescribed in a specific dose for a particular tissue layer must be administered properly. In needle injection, the delivery depth is determined by the depth to which the needle is inserted (d in Figure 1-2) and the delivery volume is determined by the volume of liquid drug dispensed by the syringe (V in Figure 1-2). However, the mechanism by which a liquid jet penetrates tissue is much more complicated and is highly dependent on the velocity of the fluid stream [181 .
The commercially available Js shown in Figure 1-1 are powered by a range of energy sources including springs, compressed gasses, and explosive chemicals. The majority of these injectors have little control in the release of their stored energy. As such, particular velocity profiles are difficult to set before injection, achieve during injection, and confirm post injection even if the desired parameters are known for a specific fluid and injection site. While there has been development in academic research settings of piezoelectric stack actuated Js, which have the capabilities to control for specific parameters of the injection, they are limited in the total volume that can be delivered; Piezoelectric stack actuated JIs have reported injection volumes of less than 10 pL [20] whereas a single treatment of insulin can be as large as 1 mL
[21].
1.3
Lorentz-Force Actuated Jet Injector
The BioInstrumentation Lab has developed a novel jet injector which overcomes the limitations of available Js to control the velocity of the fluid jet using a linear Lorentz-force actuator [22, 18, 23]. Linear Lorentz-Lorentz-force actuators (also known as voice-coil actuators given their prevalence in loudspeaker systems) pass electric current through
Spring
Chemical
Explosive
I
Compressed Gas
I
Electric
50 mm
Figure 1-1: Selection of JIs, sorted by energy source. Spring actuated injectors in-clude the (from left to right) Injex [11], Zo8 [12], and ZetaJeto [19]; compressed gas actuated injectors include the Dosepro® [13] and J-Tip [14]; chemical explosive actu-ated injectors include the Crossjectg [15]; electric actuactu-ated injectors include the MIT BioInstrumentation Lab's linear Lorentz-force injector [18]. Images reproduced from [11, 12, 13, 14, 15, 18, 191.
20
d
Figure 1-2: (Left) d represents the depth to which the needle is inserted, which determines the tissue layer to which the drug is delivered. (Right) V represents the volume dispensed by the syringe, which is the total volume delivered to the particular depth specified by d. Figure adapted from [8].
a conductive coil. This current interacts with a orthogonal, static magnetic field (produced by a permanent Neodymium Iron Boron magnet in the BioInstrumentation Lab's actuator) to exert a force. This force can be modulated by varying the electric current delivered to the coil. As such, a Lorentz-force actuator can attain high-bandwidth closed loop control on coil position with a long stroke of 30 mm [18]. With the BioInstrumentation Lab's injector, a particular velocity profile can be set
before injection, achieved during injection, and confirmed after injection. Even more importantly, these parameters can be easily tuned for particular individuals, injection sites, or medications for personalized delivery of injected treatment.
The literature [181 reports four variables critical for drug delivery via jet injection during the breaching and filling phases of an injection. Viet and tet represent the fluid
stream velocity and associated duration (respectively) during the tissue breaching phase of the injection. These two "jet" variables control the depth to which the drug penetrates. Once the hole is formed, the jet speed decelerates to Vf allow which
is maintained until the total volume V is delivered during the filling phase. These two variables control the fill rate and volume (respectively) delivered to the tissue at the depth determined by Vjet and tjet. Published work from the BioInstrumentation
Lab on a linear Lorentz-force jet injector has demonstrated good control of Vjet, tjet, Vfollm, and V in real time [18]. vjet is typically greater than
vfll.
[18] as shown inBreaching
Filling
Vjet tjet VfoIOw,
V
Figure 1-3: vjet and tjet represent the jet velocity and time (respectively) during the
tissue breaching phase of the injection (shown on the Left) and determine depth to which the drug penetrates. Once the hole is formed, the jet speed decelerates to
vfollo which is maintained until the total volume V is delivered during the filling phase [181 (shown on the Right). Figure adapted from [8].
Figure 1-4. Additionally, with the stroke of the current device and an Injex U-100 ampoule, fluid volumes up to 300 11L [181 can be delivered in a single injection, making
it appropriate for a much wider range of treatments than volume-limited piezoelectric stack actuated J1s 120].
1.4
Effect of Contact Force Variation
While the parameters Vjet, tjet, vfolow, and V have been well documented as key vari-ables affecting the depth and volume delivered, an interest developed in how contact force influenced delivery. It was hypothesized that the direction and magnitude of contact force applied to the nozzle would impact the quality of the circumferential seal formed around the nozzle, affecting delivery volume. Additionally, it was hy-pothesized that these contact forces could also govern the penetrability of the tissue layers by changing the pretension and thickness of the tissue layers, affecting delivery depth. It was further hypothesized that the addition of a sensor to quantify and control contact forces between the nozzle and tissue would improve the precision and accuracy of the delivery so that a high percentage of the volume initially contained
200
vjet
150-C4)
--
100
' 50-
vfOIIO,
tjet
0
0
0.01
0.02
0.03
0.04
0.05
0.06
0.07
Time (s)
Figure 1-4: Velocity profile in time showing vjet and tjet during the breaching phase and vofllo during the filling phase. Note that the area under this curve represents the total distance the piston has traveled. The total volume V ejected is simply this area multiplied by the interior cross-sectional area of the nozzle.
in the ampoule could be delivered to the tissue at a more tightly controlled depth. Wet injections are a common problem with JIs [241, whereby a portion of the fluid drug (mixed with, potentially, biological contaminant) remains on the skin surface after the injection. Instructions provided with commercial JIs typically instruct the user to wipe the area after injection. However, drugs are prescribed in particular doses and the prospect of a sizable and variable fraction of the prescribed dose failing to penetrate the tissue is deficient from a clinical perspective. Additionally, drugs can be extremely expensive. Prevnar 13, a drug delivered by needle injection to prevent pneumococcal bacterial infections in infants, costs upwards of $152.01 for a single 500 pL dose [25], making wet injection deficient from a cost perspective as well.
Controlling the contact forces between the tip of the nozzle and the tissue could help improve percent volume delivery by making a repeatable circumferential seal between the nozzle and tissue allowing for the full dose to be delivered.
Furthermore from the clinical perspective, doses are prescribed for particular tis-sue layers typically based on the release rate desired and specific treatment being administered [26]. Therefore, reliably reaching a particular tissue layer is important for proper treatment. Controlling the contact force would also improve the delivery depth repeatability if the penetrability of the target during the breaching phase varied with contact force as well as vjet and tjet.
1.5
Contact Force Application Scenarios
Three orthogonal forces that could be applied to the nozzle were identified, as shown in Figure 1-5. These forces include the normal force Fnormai and two lateral forces F, and Fy.
The expected desirable loading condition was one where lateral forces F, and Fy were minimized and normal force Fnormal was applied in some ideal range as shown in (a) of Figure 1-6. It was hypothesized that a circumferential seal sufficient to prevent leaking would be made allowing for high volume delivery and/or minimal delivery depth variation could be achieved, making these loading conditions ideal. However,
nor mal
FQ
Figure 1-5: Normal force Fnormat and two lateral forces Fx and Fy were identified as the orthogonal loads that could be exerted on the nozzle.
there existed many other loading conditions for which negative effects were hypoth-esized. Under load could occur when the normal force level is too low, potentially causing poor percent volume delivery and/or significant delivery depth variation, as shown in (b) of Figure 1-6. Over load could occur when the normal force level is too high, potentially causing pain for the patient, as shown in (c) of Figure 1-6. Non-zero lateral forces could also be applied to the nozzle as shown in (d) of Figure 1-6. These lateral forces could be applied in combination with normal forces as shown in (e) of Figure 1-6. However, neither of the cases (d) or (e) were desirable as it was hypothe-sized that lateral forces should be minimized to ensure a good quality circumferential seal between the nozzle and the tissue. Commercial devices such as the Injex [11] and J-tip [14] injectors seek to minimize lateral forces by specifying that the the injector should be held at a 900 angle to the skin when force is applied as shown in Figure 1-7.
1.6
Previous Methods of Measuring and Controlling
Contact Force
Many commercially available JI devices, like those in Figure 1-7, simply rely on written instructions, using words like "firmly" [11] or "slight skin contact" [14] to indicate to the user the appropriate level of normal force [11, 14, 15, 19]. Further, commercial JI instructions also commonly request that the device be held at a 90' angle to the skin surface [11, 14] presumably to minimize lateral forces and ensure an adequate seal between the nozzle and tissue around the circumference of the nozzle as discussed in Section 1.5. One commercially available JI capable of measuring and controlling for normal force between the nozzle and tissue is the Dosepro® [27]. This
JI utilizes a force sensitive mechanical trigger which fires the device when a preset
normal force is achieved [13]. While the Dosepro® [27] is much more capable of quantitative control than other Js relying on written instructions, the Doseprog is non-adjustable and gives no indication of the lateral forces applied to the tip of
~1~
(a)
Key
-
Fappuied
Mapplied
-+
Fnormai -> FiateralTissue Structure
Epidermis
Dermis
Subcutaneous Fat
Muscle
(b)
(C)
(d)
(e)
Figure 1-6: This diagram shows a variety of possible loading conditions. (a) indicates a desired loading condition where normal force is applied in a proper range and lateral forces are minimized. (b-e) indicate non-ideal loading conditions where inappropriate levels of normal or lateral force are applied to the nozzle. Fapplied (in solid red) represents an applied force on the rear of the ampoule by the user. Mapplied (in dashed red) represents an applied moment on the rear of the ampoule by the user. Fnormal (in solid black) represents the normal force applied to the tip of the nozzle along the central axis of the ampoule. Faterai (in solid green) represents the lateral force (either
F,, Fy, or a combination of both) applied to the tip of the nozzle perpendicular to
Figure 1-7: (Left [11]) The user of the Injex JI is instructed to "place the injector firmly and at a 90 degree angle on the skin" [11]. (Right [141) The user of the J-Tip JI is instructed to hold the device "at a 90 degree angle to the skin, with slight skin contact" [141.
the nozzle. Critically in cases where an individual does not use a JI under direct supervision of a health care worker, the ability to measure, guide and record correct loading conditions on the nozzle would be helpful in achieving proper delivery and reducing noncompliance.
1.7
Aims of this Thesis
In this thesis, a new electronic sensor is presented for the measurement and monitoring of normal and lateral forces on the tip of the BioInstrumentation Lab's JI nozzle.
Chapter 2 presents how the device was designed to meet functional requirements identified from clinical, controls, usability, integration, and cost perspectives.
Chapter 3 discusses hardware and software found in both a bench-level prototype as well as a revised sensor version. The hardware was largely built in-house in the BioInstrumentation Lab's fabrication facilities. The software was built in LabVIEWO [28].
Chapter 4 details how the system was validated to meet all functional require-ments.
Chapter 5 describes preliminary tissue injections into ex-vivo porcine tissue. These 28
tests indicated a positive correlation between normal force and percent volume deliv-ered, which has important clinical and cost implications.
Chapter 6 explores future work.
Throughout this thesis, note that " " indicates the standard deviation unless otherwise specified.
With this force sensor, the BioInstrumentation Lab's jet injector system was ca-pable of guiding the user to properly apply contact force before injection.
Chapter 2
Design
"Keep it simple, stupid"
- Clarence Leonard (Kelly) Johnson, founder of Lockheed's Skunk Works [29]
2.1
Overview and FRDPARRC Table
While design is a process that requires chaotic, non-linear inspiration, it is beneficial to structure the process in a way that organizes the design approach, allowing for both creative insight and thoughtful engineering analysis to guide the journey. In this thesis, the FRDPARRC approach [30] is used, which encompasses Functional Requirements, Design Parameters, Analysis, Research, Risk, and Countermeasures, all of which are crucial components to a successful design. Functional Requirements outline the fundamental constraints imposed by the designer, user, desired perfor-mance characteristics, the environment, and other factors. Design Parameters are particular approaches and schemes to meet the functional requirements. Analysis, in-cluding both qualitative design insight and quantitative engineering analysis, as well as Research, including literature and patent review and bench level experimentation, informs the designer on the benefits and drawbacks of particular design parameters. Risk identification requires that the designer contemplate all of the deficiencies of
Performance Requirements
& Constraints
40Mi-Force Sensor Location
Volume Error Usability Connectivity Analysis Small Size Flex Ribbons Sensitivity Analysis Temperature Sensor Layout
Force Sensor Type Cost PCB
Mouning Dual Gauge
Snaii Technique &
Gauge Configuration Materials
Sensor Model Idealized Enhanced Model Number Flexure Design 2D vs. 3D FEA Iteration
Table 2.1: Outline of critical design components organized in the FRDPARRC frame-work that are discussed in Chapter 2. Force sensing resistor, strain gauge, and piezo element images reproduced from [31, 32, 331 respectively.
the design parameters (and/or analysis, and/or research) which could impact a de-sign's performance and Countermeasures generation ensures that a plan is in place to overcome associated risks. The remainder of this chapter will discuss in detail each column of the FRDPARRC outline for the contact force sensor design approach shown in Table 2.1.
2.2
Functional Requirements
Obviously, the device needed to measure both normal and lateral forces on the tip of the nozzle to fully characterize the contact forces with the tissue. Beyond that, there were a number of functional requirements that were relevant to designing a successful sensor system.
First, the range and resolution needed to be specified. In terms of range, the BioInstrumentation Lab's JI could exert a maximum force of 200 N when fired [181. It was therefore desired that the sensor would measure forces and exhibit repeatable elastic behavior under loads up to 300 N. In terms of resolution, it has been found
32
F0
A
L
*Verror
Figure 2-1: The volume error Verro, is induced by a displacement from the force sensor. Assuming the piston is held stationary, this will result in a movement of the ampoule by length AL. The volume error is given by Equation 2.1 where d is the inside diameter of the ampoule. Minimizing AL caused by the force sensor to limit
Verro, while maintaining the desired resolution was the goal.
in the BioInstrumentation lab that an individual can sustain a force within a range of ~10 N at +0.5 N. Ideally the sensor would be able to resolve forces far below this variation.
Second, there needed to exist a maximum volume error, shown in Figure 2-1, that could be caused during the injection if the force sensor was located within the structural loop. All methods of measuring forces require displacement of an element. While this element can be made very stiff, some displacement is still required. Given results from previous ejections from the BioInstrumentation Lab's JI {18], 100 PL ejections resulted in a standard deviation of 1.271iL on average. Any error due to
implementing the force sensor needed to be far below that variability so as to not have a negative impact on performance. Therefore, it was determined that the sensor should induce a volume error of no more than 0.25 1iL. Given the cross-sectional area
of the current ampoule, the maximum allowable axial displacement was no more than
25 lim with the ampoule inside diameter of 3.5 mm and the Equation 2.1,
lr&AL = Verror. (2.1)
4
Third, a bandwidth specification was needed. It was desired that any resonances induced or shifted by the addition of the sensor would be greater than 5 kHz. This
fell far above the fundamental mechanical resonance of the JI at 400 Hz [18].
Fourth, there existed a number of qualitative functional requirements that needed to be met. The sensor needed to be shielded from spurious measurements, noise, and electrical interference caused by the device. The device needed to reliably measure forces regardless of JI orientation or ambient temperature. Given that the BioIn-strumentation Lab's device was pre-existing, the force sensing solution needed to be readily integrated with the device, which imposed design restrictions on size and ge-ometry. The solution also needed to be actuator-agnostic, such that if the actuator was redesigned, the force sensor would not also require a complete redesign. Finally, it was desirable for the sensor to have a low manufacturing cost when produced in volume.
With these requirements and constraints set, it was appropriate to move to the design parameters where particular solutions would be laid out.
2.3
Design Parameters and Associated Analysis and
Research
2.3.1
Sensor Location
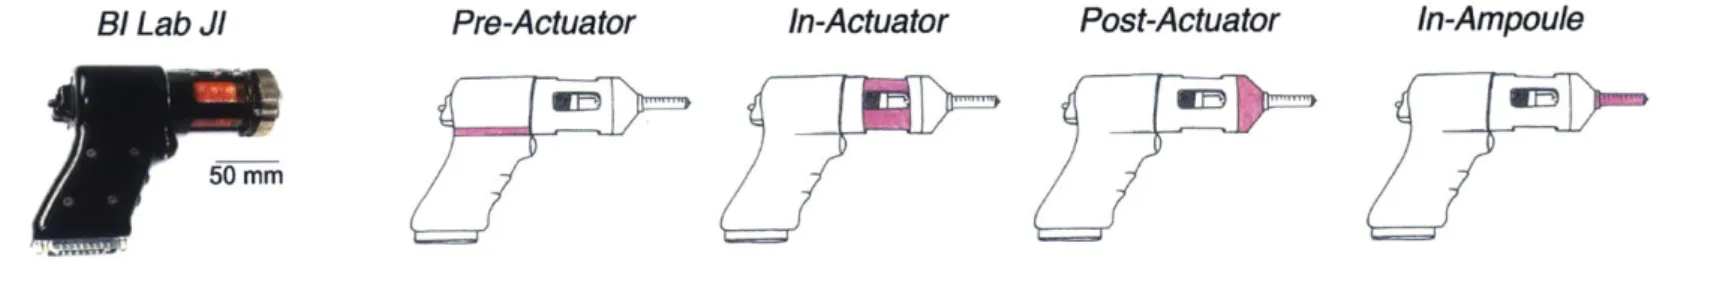
The BioInstrumentation Lab's JI (before modifications were made to implement the force sensor) is shown on the left in Figure 2-2. The four sketches directly to the right show potential locations for the force sensor, highlighted in pink, including pre-actuator, in-actuator, post-actuator, and in-ampoule. Each location had its own benefits and drawbacks, which were explored in the Pugh chart shown in Table 2.2 and are detailed in the subsequent paragraphs.
For low induced volume error, the pre-actuator and in-ampoule locations could perform quite well given that the measurement point was outside the structural loop encompassing the actuator, housing, ampoule base, and piston. The in-actuator and post-actuator locations would induce a volume error given that the sensor was placed in the structural loop. However, this error could be limited with proper attention
paid to the design.
To achieve an appropriate flat-response bandwidth, it was expected that the fun-damental oscillation frequency would decrease as the mass suspended from the sensor increased. Given the simplifying assumption that the system would behave like an undamped mechanical oscillator, = , where k is the spring constant (in N/m),
m is the mass (in kg), and w is the resonant frequency (in rad/s). m increases when
moving from right to left in Table 2.2 (from the in-ampoule to pre-actuator locations). Assuming this model is accurate for the sensor structure, increasing m decreases w given a constant k. While theoretically k could also be increased, this would prac-tically be difficult to implement after some point. Smaller displacements for a given load (caused by increased k) would result in poorer resolution and eventually, with a high enough k, the system would fall out of resolution specification for the chosen sensor type.
Shielding the sensor from measuring undesired loads was deemed easiest to im-plement in the post-actuator location since only forces applied to the ampoule would be measured. The in-actuator location would be less ideal, as measurement errors would be caused by the application of forces to the front of the actuator housing. The pre-actuator location would be very difficult to shield as the device would be prone to inaccurate measurements caused by the application of forces to any portion of the actuator housing. The in-ampoule location would also be very difficult to protect with a structural shroud while still allowing access to mount and remove the ampoule.
Building a robust and reliable device was also important. The post-actuator location appeared to be most ideal as the ampoule could be detached, removing the possibility for overload, and the sensitive force sensing elements could be shrouded in a protective structure, which would protect the sensor from a jostle or drop. The remaining locations would all be deficient. The pre-actuator and in-actuator would be continually exposed to external forces which would make them potentially prone to an overload condition. The in-ampoule location could easily sustain damage when the user mounted the ampoule before injection.
Pre-Actuator
In-Actuator
Post-Actuator
In-Ampoule
Figure 2-2: The BioInstrumentation Lab's JI is shown on the left, before modifications to implement the force sensor commenced. The four sketches directly to the right show potential locations for the force sensor, highlighted in pink, including pre-actuator, in-actuator, post-actuator, and in-ampoule.
0
-+0 +
Table 2.2: Pugh chart evaluating sensor locations presented in Figure 2-2 against relevant functional requirements identified in Section 2.2.
The post-actuator location would be best as it would give a significant amount of flexibility with the geometry allowing for relatively easy implementation. The pre-actuator would be second best, as integration at this location would only require a redesign of the handle ergonomics. The in-actuator location would be extremely deficient as the sensor would need to be integrated into the actuator housing. This would mean that not only would the sensor need to be designed and implemented but the structural mechanics, electromagnetic characteristics, and overall actuator performance of the actuator would need to be monitored and maintained as well. The in-ampoule location was also extremely deficient. While all other locations could be readily hard-wired to the data acquisition hardware, a repeatable but removable electrical interface would need to be created between the ampoule and the rest of the device. Given the limited real-estate on the current Injex [11] ampoules used in the device, this could prove difficult from an integration perspective. Additionally, the prospect of mounting the sensor on a disposable part of the device would be extremely problematic.
The associated costs with implementing the sensor at each of these locations would be closely related to integration challenges.
Finally, the pre-actuator and in-ampoule locations could be quite ideal from an actuator-agnostic perspective. Given that the force measurement would occur outside
the structural loop in both cases, the components of the actuator could all be modified without requiring significant redesign of the sensor. The post-actuator location would be moderately agnostic given that the interface between the force sensor and actuator housing would be the only part requiring modification in the event of a change in the actuation method. The in-actuator location would be very deficient. Since the force sensor and actuator would be one unit, changing the actuator would render the previous in-actuator force sensor implementation useless.
The Pugh chart in Table 2.2 outlines the the results from the analysis and research for the sensor location and indicated that the post-actuator location was most ideal for this device.
2.3.2
Sensor Type
A number of physical paradigms exist through which force could be measured and
recorded including electrical, optical, and mechanical methods. These can be broken down into particular implementations. First, with electrical methods, sensing imple-mentations include metal foil gauges, force sensitive resistors (FSRs), and piezoelectric transducers to measure strain on or within a substrate. This strain can be related to applied force. With optical methods, laser/photodiode or interferometry setups are potential options to very accurately quantify the movement of a reflector whose displacement can be related to applied force. Lastly, forces can also be measured using mechanical means. One method is through a fluid system using pneumatics or hydraulics to transfer an applied force to a pressure, which can be recorded elsewhere in the fluid. This selection of sensor types, while not exhaustive, represented a rea-sonable spread for determining an optimal candidate. Each type had its own benefits and drawbacks, which are explored in the Pugh chart shown in Table 2.3 and detailed in the subsequent paragraphs.
Strain gauges rely on a linear elastic behavior of a substrate to repeatably produce a measurable strain given some force. Foil strain gauges are the most widely used and consist of a metal foil (2 to 5 lim thick) on an insulating backing (10 to 30 Jim thick) made of epoxy, polyamide, or glass-reinforced epoxy phenolic resin. This assembly is
+ ++ + +
-- 0 ++ +
++ ++
++ 0
0---Table 2.3: Pugh chart evaluating possible sensor types against relevant functional requirements identified in Section 2.2.
mounted on a structure to measure local strain. To achieve a very high sensitivity in a small package, the measurement grid pattern and terminal junctions are produced by photo-etching [341.
Given the high bit depth of readily available analog to digital converters (ADC) and particular strain gauge layouts, minute strains can be detected. This means that very small deflections and induced volume errors could be realized while maintaining relatively good resolution. The bandwidth would be dependent on the structural design but could be tuned for the desired performance. Foil strain gauges are very commonly used in the measurement of force and, as such, are commercially available and would be very reliable. Structures can easily be made to produce localized strains and very small foil strain gauge packages can be sourced, making this sensor type a very attractive option from an integration perspective. Foil strain gauges are mass manufactured by the printed circuit industry and therefore could be produced at relatively low unit cost [34].
FSRs are sensors which change resistance based on the applied force. In an FSR, two electrodes are separated by a conductive polymer. When the conductive polymer is compressed, the resistance between the electrodes decreases in a nonlinear fashion. While they are very thin (typically less than 0.5 mm), sensors which have the proper
force range (such as 0 -440 N found in Sensitronics 1 Inch ShuntMode FSR [35]) have switch travels on the order of 120 pm, far above the maximum specified in the functional requirements of 25 llm. Typical FSRs also have force resolutions on the order of 1% of their full scale level, meaning an FSR designed for a 300 N max force could only resolve to 3 N, which also does not meet the required specification
[35]. FSRs have relatively fast rise times (typically below 100 ps) [35]. However, the
measurements from FSRs currently available are very unrepeatable (+5% between measurements on the same sensor) causing poor reliability [35]. Size issues would be present with commercial available FSRs but would not be impossible to overcome. FSRs are very low cost (near $5 in bulk) due to their ability to be screen printed in large volumes [35]. While currently available FSRs may have a place in toys and some industrial applications requiring a binary measure or very rough numeric force value, they should be avoided at all costs in precision measurement equipment.
Piezoelectric force sensors are active elements, meaning that no power supply to the sensor is needed (although amplification of the signal is common). They make use of the piezoelectric effect, which is a phenomenon in some materials where a voltage is generated in proportion to how much the material compressed. Quartz is a common material that exhibits piezoelectric behavior. Piezoelectric sensors are commercially available and very robust (they typically can withstand very high overload forces). However, they are brittle and proper loading conditions are critical to their longevity
[34].
Piezoelectric force sensors are very rigid, meaning that the displacement they in-duce in the force measuring path is very small when loaded. Therefore the error volume induced can also be quite small. Resolution is related to the particular sub-strate's piezoelectric properties and the ADC. Bandwidth, however, is a particular problem with piezoelectric force sensors. While excellent for fast changing transient forces, a piezoelectric sensor is typically unable to measure static forces due to charge leakage [34]. This is a significant drawback given the force application that the instru-ment will measure is near steady. Given this fact, the reliability of force measureinstru-ments for this application would be called into serious question. One issue with commercial
25 mm
Figure 2-3: Electrical paradigms for measuring force including a representative strain gauge (Left) [32], FSR (Center) [31], and piezoelectric transducer (Right) [331.
devices is that they are typically quite large as compared to the real-estate afforded at the front of the BioInstrumentation Lab's JI. System cost is moderate. Images of a strain gauge, FSR, and piezo transducer are shown in Figure 2-3.
Laser interferometry is traditionally more of a displacement measurement method rather than a force measurement method. However, given knowledge of the rela-tionship between applied force and resultant displacement, a laser interferometer is capable of measuring forces. A laser interferometer is an optical system that utilizes the interference intensity between two coherent light sources where one path is fixed and one path is variable. This method can be used to measure distances at resolutions smaller than the wavelength of the coherent light utilized. Hence, very small defor-mations can be detected and a high stiffness sensor could be realized, allowing for low induced volumetric errors. Rigid structures allow for higher bandwidth, making it easier to attain the specified requirement. However, laser interferometers are delicate optical instruments that can be damaged in a jostle or drop, hurting their reliability. Given the need for a laser source and desire for quality optical components in a small package, integration is a potential difficulty and cost may be high. A Michelson laser interferometer schematic is shown for reference in Figure 2-4.
Laser/photodiode systems are, like laser interferometers, more of a displacement measurement method rather than a force measurement method. However, given knowledge of the relationship between applied force and resultant displacement (or in this case, the rotation of the reflective element), a laser/photodiode system is also capable of measuring forces. A laser/photodiode system is a setup whereby a laser
fixed mirror
source
translating
soure
mirror
beamsplitter
7-
+
detector
Figure 2-4: A simplified schematic for a Michelson laser interferometer where the translating mirror's movement modifies the light path length and allows for relative displacement to be detected. Given a structure where the elastic deformation proper-ties are known, displacement can be related to applied force. Cycles in the intensity that are detected must be counted and interpolated in addition to the wavelength being known to measure the relative displacement from an initial position. Figure reproduced from [361.
spot is reflected off a surface onto an array of photodiodes. Based on rotation of the reflective surface, the laser spot will activate different photodiodes. This is a common method by which an atomic force microscope measures surface profiles. Resolution would be dependent on the distance of the photodiode from the point of reflection, so achieving extremely high resolution in a small device may prove difficult to achieve. However, laser/photodiode systems are still quite high resolution and would result in low induced volume error. Bandwidth performance would be very good due to the high structural stiffness that could be achieved. Laser/photodiode systems however also contain delicate optical elements that could be damaged in a jostle or drop, hurt-ing their reliability. Due to similar challenges that the laser interferometer would face in requiring small, high quality optical components, integration could also be difficult and cost could be high.
Hydraulic and pneumatic systems utilize a fluid (in hydraulic systems a liquid and in pneumatic systems a gas) to transmit forces applied to a loading surface to a pressure transducer. While liquids (such as oil) are relatively incompressible resulting in very high stiffnesses [34], all other characteristics of these two systems
perform poorly across the relevant functional requirements. Pneumatic systems, due to compressibility of the gas, would result in high volume error. These systems are relatively inaccurate (uncertainties of 1% full scale are common [34]) and the bandwidth in systems with fluid-filled lines would be poor. Any leaks would cause reliability problems and the ability to implement this force measurement paradigm in a small package would prove difficult. While the final system manufacturing cost could be tenable, the calibration and monitoring of such a system could prove cumbersome. Given the results from this analysis and research, the Pugh chart in Table 2.3 indicated that the foil strain gauge was most ideal for this device. With the decision to utilize this sensor type, it was necessary to create localized areas of strain that would vary linearly with the applied load. Flexural members were an excellent candidate to accomplish this.
2.3.3
Flexure Number
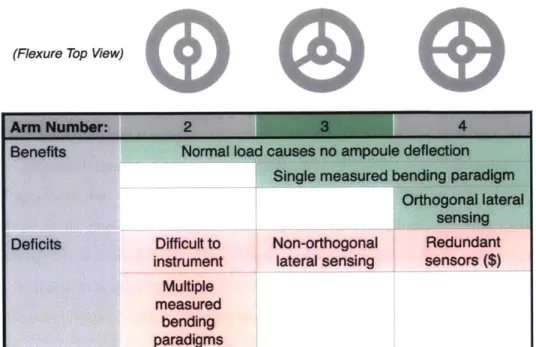
Given the decisions to pursue the use of strain gauge elements at the post-ampoule location, it was now necessary to formulate a design that generated localized areas of strain which could be measured by the sensing elements. Flexural elements formed in a metal substrate were identified as a good candidate to produce near-linear deflection for applied loads when loaded within the elastic limits of the geometry and material. These flexural elements could be analyzed with both 2D beam bending theory as well as finite element analysis (FEA) to optimize performance. Additionally, flexures could be manufactured in-house in the BioInstrumentation Lab's machine shop. As shown in Table 2.4, the number of arms to be utilized in the design was a design parameter that needed to be evaluated, as each had associated benefits and deficits.
In the two-arm design, both vertical bending (in and out of the page in Table 2.4) and torsion of the flexures (along the flexures' long axis) would need to be quantified to measure both normal and lateral forces applied to the tip of the nozzle. While it is relatively straightforward to mount strain gauges on the top and bottom surfaces, reliably mounting sensing elements on the sides of the flexures could prove very cumbersome from a manufacturing standpoint.
(Flexure Top View)
Benwft
Normal load causes no ampoule defloiscm Single measured bending psArwigmOrthogonal lateral sensing Deficits Difficult to Non-orthogonal Redundant
Instrument
lateral sensing
sensors
($)
Multiple measured
bending
paradigms
Table 2.4: Benefits and drawbacks for possible flexure systems including two, three, and four-arm configurations.
In the three-arm design, only vertical bending on each flexure would need to be quantified to measure both normal and lateral forces applied to the tip of the nozzle. A potential downside of this design would be that, because the flexures are not orthogonal to one another, sensing lateral forces could prove more difficult.
In the four-arm design, again only vertical bending on each flexure would need to be quantified to measure both normal and lateral forces applied to the tip of the nozzle. Additionally, the flexures are orthogonal, which would make it more straightforward to relate vertical bending to the applied lateral force. However, since three flexural arms potentially could resolve normal and lateral forces, the four flexural arm design could prove to be more costly from a materials and assembly standpoint.
With all of these designs, a normal load on the tip of the nozzle causes only a deflection in the normal direction and no lateral deflections. Given that lateral forces will be minimized, this means that the axis of the ampoule always will remain parallel to the axis of the piston, keeping friction and wear to a minimum.
Given further work on the sensor model presented in Section 2.4.5, it was deter-mined that the lack of orthogonality could be overcome with a proper model. As
R4
V ex -O- m+Figure 2-5: This Wheatstone full bridge configuration was identified as an excellent candidate for the strain gauge layout. It is insensitive to temperature variation and very sensitive to vertical bending. Adapted from [371.
such, the design with three flexural arms was determined to be optimal.
2.4
Further Analysis and Research
2.4.1
Gauge Configuration
A strain gauge configuration needed to be identified that was very sensitive to
ver-tical bending and insensitive to all other loading paradigms as well as temperature fluctuations. A particular configuration of the Wheatstone full bridge was identified, as shown in Figure 2-5. As shown in Figure 2-6, the configuration is indeed very sen-sitive to vertical bending and rejects all other loading paradigms including horizontal bending, axial loading, and torsion. Additionally, as long as temperature variations affect all gauges in the same way, Vm (the measured voltage) will not change.
2.4.2
Flexure Design
Strain gauges integrate the total strain beneath them. This means that whether a strain gauge straddles a compressive and tensile zone equally or is exposed to constant, zero strain, the voltage measurement will be the same. However, a gauge fully in the tensile or compressive zone alone will output a nonzero strain. Therefore to maximize the measurement output, a strain gauge must be mounted in a purely tensile or compressive zone.
Vertical Bending
Horizontal Bending
Axial Loading
To
rsion
Strain
Detected
Strain
Rejected
Strain
Rejected
Strain
Rejected
R
' R4 VexM ex -R2". 3R R1 ,RV..
ex R2D',Vex
-'
-,,R
R2 3Figure 2-6: The Wheatstone full bridge configuration shown in Figure 2-5 is very sensitive to vertical bending and (ideally) completely rejects all other loads (adapted from [37]). Red indicates compression and a decrease in gauge resistance, green indicates tension and an increase in gauge resistance.
and Fixed/Free), red shading represents surface compression zones and green shad-ing represents surface tensile zones. Given a particular strain gauge length A, which occupies fully a purely compressive or tensile zone, the minimum flexure length LFG
possible in the Fixed/Guided flexure is 2A whereas the minimum flexure length LFF
possible in the Fixed/Free flexure is A. Therefore from a size perspective, instrument-ing a Fixed/Free flexure configuration would result in a device nearly half the size of another employing Fixed/Guided flexures.
Additionally, given the appropriate equations for beam deflections in 2D and the same load W, Young's modulus E, and second moment of area I, as well as the strain gauge length A, the maximum displacement at the moving end is half for the Fixed/Free than it is for the Fixed/Guided. This difference in displacement directly influences total induced volume error.
While the Fixed/Free is better from both a size and maximum displacement per-spective, the obvious deficiency is that there is no connection point to a central hub, which is necessary to hold the ampoule.
A new configuration was devised that borrowed from both of the flexure
con-figurations shown in Figure 2-7. This Fixed/Quasi-Free design, as shown in Figure
2-8, borrows from the Fixed/Free configuration to realize a smaller device size and
induced volume error while allowing for a connection to the central hub as with the Fixed/Guided configuration.
To analyze this design initially, a simplified geometry was developed and two-dimensional (2D) beam bending analysis was employed. While this approach did have its limitations (detailed later in this subsection) it did provide interesting insight to the approximate behavior of a 2D flexure with a representative geometry for the Fixed/Quasi-Free design.
The maximum stress in a loaded 2D beam can be described given Equation 2.2,
Umax = M .ax (2.2)
![Figure 1-1: Selection of JIs, sorted by energy source. Spring actuated injectors in- in-clude the (from left to right) Injex [11], Zo8 [12], and ZetaJeto [19]; compressed gas actuated injectors include the Dosepro® [13] and](https://thumb-eu.123doks.com/thumbv2/123doknet/14466452.521451/20.918.160.724.166.802/selection-actuated-injectors-zetajeto-compressed-actuated-injectors-dosepro.webp)
![Figure 1-7: (Left [11]) The user of the Injex JI is instructed to "place the injector firmly and at a 90 degree angle on the skin" [11]](https://thumb-eu.123doks.com/thumbv2/123doknet/14466452.521451/28.918.178.751.138.363/figure-left-injex-instructed-place-injector-firmly-degree.webp)


![Figure 2-18: This sequence of simulation results, performed in Solidworks@ 143], shows the first five resonant modes of the isolated flexure system](https://thumb-eu.123doks.com/thumbv2/123doknet/14466452.521451/61.1187.225.945.221.611/figure-sequence-simulation-results-performed-solidworks-resonant-isolated.webp)