Characteristics of Pine Needle Combustion in a Semi-Gasifier Burner by
Liane Jessica Fang and
Caroline M. Hane-Weijman
Submitted to the Department of Mechanical Engineering in Partial Fulfillment of the Requirements for the Degree of
ARCHIVES
Bachelor of Science MAsSis-FrS INSTITUTE
OFTECHNOLOGY
at theOCT
2 0 2011
Massachusetts Institute of Technology
June 2011
LIBRARIES
© 2010 Massachusetts Institute of Technology. All rights reserved.
Signature of A uthor ... ... . . . . . Department of Mecl ni cal* Engineer~ji
December 9, 21619/ Signature of A uthor... ....
Department of Mechanical Engineering December 9, 2010 C ertified by ...
Wai K. Cheng Professor of Mechanical Engineering Thesis Supervisor
Accepted by...
...
....
.
...
N
John H. Lienhard V$amiReTC. Collins Professor of Mechanical Engineering Undergraduate Officer
Characteristics of Pine Needle Combustion in a Semi-Gasifier Burner by
Liane Jessica Fang and
Caroline Hane-Weijman
Submitted to the Department of Mechanical Engineering on December 09, 2010 in Partial Fulfillment of the Requirements for the Degree of Bachelor of Science in
Mechanical Engineering
Abstract
The motivation behind this report was to develop a stronger understanding of pine needle combustion behavior in a semi-gasifier, in order to ultimately design an effective pine needle cook stove for people in the developing world. Pine needles are a cheap, energy-dense fuel source that can be harnessed for cooking purposes, but they are often physically or chemically altered prior to being used as a fuel. The challenge remains to develop a stove that uses unprocessed pine needles. Using principles of a semi-gasification biomass stove, this paper explores the combustion and burn characteristics of unprocessed pine needles by measuring the effects of temperature in a configured burner when altering primary and secondary airflow into the burner. Experiments showed that pine needles in a semi-gasifier combust in two regimes-one characterized by secondary combustion of volatiles released from the primary burn of raw pine needles, and another characterized by the smoldering of pine needle charcoal. Each regime needed unique balances between primary air and secondary airflow. The first regime required a relatively low primary airflow with a high secondary airflow, while the second regime needed a high primary airflow to maintain charring and low or no secondary airflow. The balance of airflow in the first regime was crucial in determining whether the volatiles combusted or were released as plumes of smoke. The findings of this report can be used as an initial benchmark and resource in the further development of an existing proof-of-concept prototype, which was built by the authors with a team of MIT students and affiliates and a community partner in
Uttarakhand, India.
Thesis Supervisor: Wai K. Cheng
1. Introduction
In Uttarakhand, India, wood fuel is a scarce commodity, as it is illegal to cut branches from the government-owned pine trees. Furthermore, the large volume of needles fallen from the pine trees currently present large environmental hazards. They increase the risk of forest fires and prevent vegetation growth due to soil acidification as they decay. Similar situations may be found in many developing countries. However, these pine needles have great potential as a highly combustible alternative fuel due to their high resin content. Pine needles are notoriously known to ignite easily, to have difficult to manipulate burns, and to release large amounts of volatiles during combustion. Little scientific research has been done on the combustion of unprocessed pine needles since they are often physically or chemically altered prior to being used as a fuel. Current stoves that use pine needles as an alternative fuel source either char and process them into charcoal briquettes or gasify them and use the energy to generate electricity. The latter is currently being used at Avani NGO in Uttarakhand.
A lot of work has been done to address the health and economic issues regarding cooking stoves worldwide. More than 3 billion people are currently exposed to indoor air pollution due to inefficient biomass stoves and poorly ventilated houses. This can lead to health risks such as pneumonia-the number one killer of children worldwide. It is crucial that the design of a cooking stove is governed by fuel efficiency and minimal harmful emissions.
India's Avani NGO presented D-Lab with the challenge of designing a practical stove that uses pine needles as its fuel source. The goal of this report is therefore to develop a cook stove that uses unprocessed pine needles as an alternative fuel in developing nations, while providing a systematic solution to the environmental hazard they pose. The authors of this report, with a team of fellow undergraduates and MIT mentors in Spring 2010, developed a proof-of-concept stove involving a unique spiral design. This paper explores the combustion and burn characteristics of unprocessed pine needles in a stove system by altering key combustion factors in a controlled configuration. A semi-gasifier system was used to test the effect of primary and secondary airflow rates on the burn history of a constant mass of pine needles. This paper aims to provide a clearer understanding of the stove conditions needed to use unprocessed pine needles as a fuel, and will serve as a guide in the next prototype iteration of a pine needle cook stove.
Section 2 provides background information prevalent to this project-key factors for the successful combustion of biomass fuels, previous cook stove designs, and the first developed pine needle stove prototype. Section 3 explains the test apparatus and testing methods. Thereafter, Section 4 and 5 present and discuss the test results, and the Conclusion explains how these results will guide the next prototype of the pine needle stove.
2. Background: Combustion and Stove Principles
The pine needle testing configuration explored in this paper is based on combustion theories of wood, research and observation of pine needle combustion, current wood stove designs, and work done on the previous proof-of-concept prototype of the pine needle cook stove.
2.1 Combustion
2.1.1 Combustion of wood'
As little research has been done on the combustion of pine needles, major principles of wood combustion were explored to provide better context for understanding pine needles. Combustion occurs as fuel chemically reacts with oxygen in air. In the case of complete combustion, fuel (wood is represented as cellulose in the following equation) is converted into carbon dioxide and water, releasing heat in the process.
(C6H1o05O)n+ 6n 02 -> 6nCO2 + 5n H20 + energy (1)
The energy released depends on the type of biomass; the value of wood is 15.8 MJ/kg2. Complete combustion is almost impossible to achieve, and efficiency is determined by the balanced ratio between fuel, air, and temperature. Air is 20.9% oxygen, 78% nitrogen, and 1% argon, by mass. Oxygen is the only chemically active element in air. Nitrogen and argon are inactive and actually counterproductive to combustion, serving only to cool and thus hinder the combustion process. Impurities in the fuel, such as sulfur and nitrogen, will react with oxygen and emit toxic SO2 and NO gases.
Wood combusts in a several stages-moisture is first evaporated from the fuel; then primary combustion releases volatile gases from the fuel; those volatile gases undergo secondary combustion; the aforementioned primary combustion turns the fuel bed into charcoal, and that charcoal is burned as well; the overall combustion process ends when the all of the fuel has been converted to ash.
First, heat is brought into contact with the wood, penetrating it and raising the temperature. As the temperature approaches 100 'C, any water contained in the fuel will evaporate. The temperature of the fuel will not increase during this evaporation stage, as energy is going towards this phase change. Other volatiles such as carbon dioxide, carbon monoxide, and acetic and formic acids are released at temperatures of 232 'C (450 'F) but will not yet ignite since moisture is still present.
The next stage, primary combustion, occurs when the temperatures reach 282 'C to 482 'C (540 'F to 900 'F). The fuel is oxidized and releases volatiles such as methane and other organics, methanol, acid, water vapor, carbon dioxide, and carbon monoxide, as well as a large amount of heat. It is important to note that 60% of wood's potential heat is contained in these volatile gases; therefore, stove efficiencies depend on the ability to burn these gases. There exists too little air and heat near the fuel for the volatiles to combust since these are consumed by primary combustion. Therefore, more air and temperatures above 593 'C (1100 'F) need to be introduced for secondary combustion of the volatiles to occur. The introduction of excessive air however, will only serve in cooling the system since only 20.9% of air (the oxygen) is an active
combustion ingredient.
After the volatiles have been released from the fuel, carbon chains of cellulose and lignin molecules-also known as charcoal-remain. This charcoal releases additional heat over a long period of time. If left to burn out, the charcoal will convert to ash as its final state. If additional
fuel is added to the system, the charcoal can help heat the new fuel and reinitiate the bum cycle Pine needles can be seen to have a similar combustion cycle, but because the fuel's makeup differs from that of wood, the types and volumes of volatiles differ; consequently, the ratio of air and the temperatures needed to complete the combustion cycle also differ. There has been little
research done in this field, with the exceptions of a paper written by Safi, et al. (2003), and qualitative combustion characteristics gathered during the construction of the first pine needle stove prototype.
2.1.2 Combustion of Pine Needles
2.1.2.1 Literature on Pine Needle Combustion
There is little information available concerning combustion characteristics for pine needles. Global degradation kinetics of pine needles (Safi, et al. (2003))2 is one of the few existing papers that explore combustion characteristics in the context of fuel use for pyrolysis and gasification systems. The report reconfirms the lack of available information by stating "no study has reported the thermal degradation characteristics and kinetics of pine needles in an oxidizing environment." The report also supports the case for using pine needles as a fuel source with the following arguments: pine needles are a clean fuel; pine needles have a higher heating value per unit mass and higher combustion efficiency, as compared to wood; and using pine needles reduces the serious threat of forest fires. The report simulates the conditions of a combustor/gasifier to test for thermal degradation characteristics and kinetics of pine needles. Thermogravimetric analysis (TGA), Differential thermogravimetric (DTG), and Differential thermal analysis (DTA) methods were used in a temperature range from room temperature to 900 'C in air atmosphere with varying heating rates. It was found that the heating value of pine needles is 18.0 to 20.0 MJ/kg; this is comparable to that of sawdust and fuel oil but higher than that of wood, which is 15.8 MJ/kg. It has a similar volatile content to saw dust (74.2%, compared to 76.0% of mass) but a higher fixed carbon content (24.1%, compared to 1.7% of mass) and lower ash content (20.4%, compared to 3.6% of mass). The energy stored in pine needle volatiles are 74.2% of the total potential pine needle energy and is much larger than the approximate 60% of potential wood energy stored in wood volatiles. The heating rate was concluded to have "tremendous influence on the thermal degradation characteristics of biomass components."
2.1.2.2 Observations from the Pine Needle Stove, Prototype I
Through the building and development of the first pine needle stove prototype, qualitative data was gathered. In the controlled environment of a fireplace, pine needles were packed and burned in different ways: small, tangled, piles of pine needles; pine needle "logs" tied together with string; pine needles packed in a pipe; chopped pine needles sitting on a mesh grate, with varying airflow and volume. The fire was tended to stay located (i.e. did not spread across the volume of the pine needles), especially with more densely packed needles. The higher the density of pine needles, the more concentrated an airflow was required to maintain the fire. The pine needles released a lot of gas in all cases, especially as the fire died and began smoldering. The pine needles caught fire quickly, but also lost its heat very rapidly. The fire needed to be tended to continuously, and for the loose pine needles, constant feeding was required.
2.2 Biomass stove design principles
2.2.1 Combustion Efficiency v. Fuel Efficiency3
Biomass cook stoves must optimize two types of efficiencies: combustion efficiency, which pertains to minimizing harmful gas emissions, and fuel efficiency, which pertains to minimizing heat transfer losses. Optimizing combustion efficiency does not imply fuel efficiency since
thermodynamic laws and losses in heat transfer limit the heating of cooking pans and food. However, increasing combustion efficiency does decrease the emission of harmful volatiles. Stoves are designed to balance these parameters in their geometries while accounting for cost, access to materials, and manufacturability. The stove geometry governs the key components of combustion-fuel volume, air exchange, and temperature. A successful stove is quick to start, needs little tending, can meet specific needs to cook, is affordable, uses minimal fuel, is easy to clean and maintain, and uses local resources to manufacture.
In order to improve combustion efficiency, the stove needs to address the major components as mentioned in the combustion section above: air, temperature, and fuel. The stove needs to have good draft through the stove and maintain the correct ratio of air to fuel (explained above). The draft can be increased through an increase in height of the fire chamber (chimney above the fire). This increased height also retains and burns released volatiles better and therefore reduces emissions. This chimney chamber should have a height three times larger than the diameter, tall enough to allow volatiles to burn but short enough to bring hotter gases to the pot. Concerning temperature, it is valuable to preheat the secondary air, so as not to cool down the system and inhibit combustion. The stove should also be well insulated with light, heat-resistant material to retain the temperature of the fire.
Regarding fuel efficiency, it is important to minimize the heat transfer losses from the stove to the pot. The stove should not be too high in mass, as more mass draws more energy from the pot and acts like a heat sink. Adding a pot skirt can reduce the channel gap between the pot and the chamber, directing heat to the surface area of the pot. Furthermore, increasing the speed in which the fire "hits" the pot removes slow, cool gases that hinder heat transfer. The amount of fuel used in the fire determines the heat and therefore the stove should be able to easily adjust for fuel volume so as not to waste unnecessary fuel if high heat is not required.
2.2.2 Existing Wood Stoves
Currently used wood stoves in the developing world were explored to provide a foundation for the pine needle design.
2.2.2.1 Rocket Stoves3
The rocket stove is a wood stove invented by Dr. Larry Winiarksi at the Aprovecho Research center in 1980; it is a simple stove that uses basic stove design principles to increase efficiency and burn cleanliness. Referring to Figure 1, wood is placed in a small feed chamber, called a magazine, to meter the amount of fuel fed to the system; only the tips of the wood sticks are exposed to combustion. Airflow is controlled through the magazine and preheated as it passes under the fuel shelf. The fuel shelf acts as a "grate" that ensures a better fuel to air ratio. The heated, insulated "rocket chimney" induces a draft and provides a "burn path" for the volatiles, where they combust before escaping as pollution. A pot skirt around the pot minimizes the gap that causes heat transfer losses.
Full assembly Pot
Stove elbow
Figure 1: Winiarski/Aprovecho rocket stove4 2.2.2.2 Semi-Gasifiers
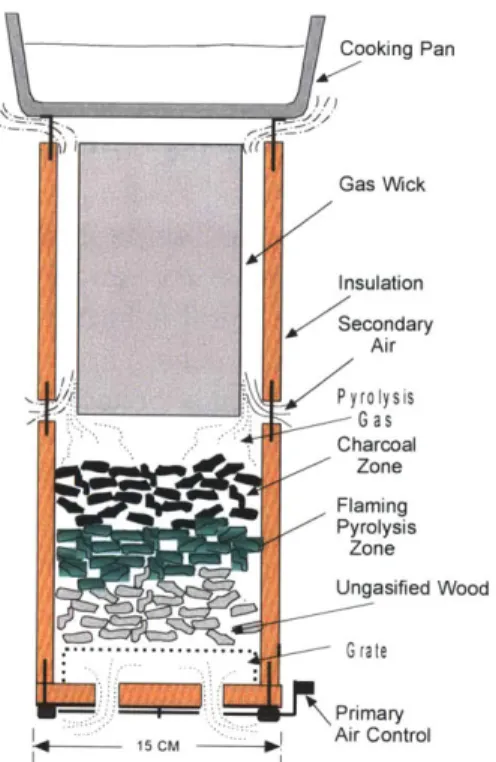
Semi-gasifiers are another category of wood stoves and were used as a base design for this thesis project. In these stoves (Figure 2), fuel is packed into a combustion chamber on a batch-basis and the lit from above. Primary combustion occurs on the top layer, converting it to char and generating heat; that initiates pyrolysis in the fuel zone beneath and releases volatiles. Primary airflow enters from the bottom of the system to facilitate primary combustion, while secondary airflow enters the chamber above the fuel bed to facilitate secondary combustion of the released volatiles. This bums the fuel more efficiently and more cleanly by optimally consuming the released gases. The following figure shows a stove designed by T.B. Reed and R. Larson5, and illustrates the principles of semi-gasifiers.
shelf
Cooking Pan Gas Wick Insulation Secondary Air Pyrolysis G as Charcoal Zone Flaming Pyrolysis Zone Ungasified Wood L- G rate Primary Air Control
Figure 2: Wood-gas cooking stove showing lower gasifier section, upper burner section and pan heating. The gas wick refers to the zone or area in which the gases combust.'
One specific semi-gasifier is the Philips stove6, which inspired the test apparatus for this project. It uses a double-walled cylinder to preheat secondary air. Secondary air gets heated as it travels up the sheath portion of the double-walled combustion chamber; consequently, when it exits the secondary air holes, it is more likely to combust the gases. Philips produces two versions of the stove-one operates solely using natural draft, while the other uses an electrical fan powered by a thermoelectric generator to create forced draft. The later is depicted in Figure 3.
6
Figure 3.a: Schematic of the Philips Wood stove.
2.3 Prototype I: Spiral Pine Needle Stove
In the first pine needle stove prototype, the design was mainly governed by the principles of direct fuel woodstoves such as the rocket stove. A periodic feed of compressed, unprocessed pine needles enters an insulated firebox via the fuel shoot. Air flows into the firebox via adjustable air inlets, drawn by a chimney- induced draft, and insulated walls keep the temperatures high within the firebox. The firebox is made out of firebricks, held together by threaded rod and nuts. The volatiles released are drawn around a spiral geometry above the firebox to increase the burn path. Since the spiral is heated from the firebox below, the volatiles ignite within the spiral and a secondary burn occurs before exiting through the chimney. This results in a clean burn with heat generated directly beneath the cook pot. The motivations behind this spiral design were to (1) elongate the burn path to retain the volatiles, (2) reheat the volatiles enough to cause a secondary burn, and (3) distribute high-velocity hot burned gas evenly under the cook pot. Figures 4 depicts the major components of the stoves and in a state of use, and Figures 5 shows more clearly the spiral geometry above the firebox that is used for an increased secondary burn.
Primary Bura
Mir Ilet
Fuel Shoot
Figure 4.a: Prototype I: Spiral Pine Needle Stove, and its major components. Figure 4.b:This shows the stove in use, covered with thermally resistive glass.
Figure 5.a: Top view of the spiral geometry above the firebox where volatiles undergo secondary combustion through an elongated bum path and high heat from firebox below.
AIR
Figure 6: Diagram of the Spiral Pine Needle Stove prototype to demonstrate the interaction between air, fuel, and heat in the system.
Figure 6 shows how the interaction of airflow, fuel, and heat released in the Spiral Pine Needle stove. The design incorporates an ashtray for ash that forms in the last stage of combustion.
3. Experimental Design
The experimental set up, shown in Figure 7, was based on semi-gasifier stove systems-in particular, the Philips stove. The set-up was designed to better understand the combustion cycle of unprocessed pine needles. Temperatures were measured temperatures at seven different locations in the system while altering primary and secondary airflow. A 3x3 test matrix of primary and secondary airflow rates-9 configurations in total-was tested; 3 trials were performed on each configuration. Air was pumped into the system with via an air compressor, and the flow rates were controlled using rotameters. Temperature readings were gathered using 8 thermocouples (7 going to the system, 1 to ambient) connected to LabPro tools and software.
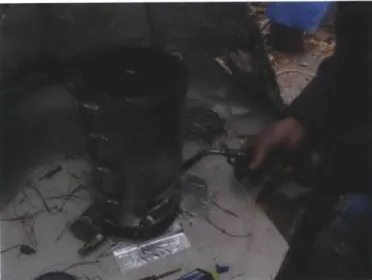
Figure 7: Experimental Set-up in Carlisle, Massachusetts, November 2010 3.1 Apparatus
The semi-gasifier system that was built for testing purposes is shown in Figure 8 and Figure 9 shows in detail the design components in a schematic.
Figure 8: The testing unit underneath a hood. The gas torch was used to light the pine needles.
4" Cover
- I nlermocouple t
- Thermocouple 8
7"
Figure 9: Dimensioned diagram of testing system built from 1/32" sheet metal. and secondary air flows into the system through air inlets.
Approximate height of 100 g
of pine needles '3",
Circular tube with air inlet holes
Primary
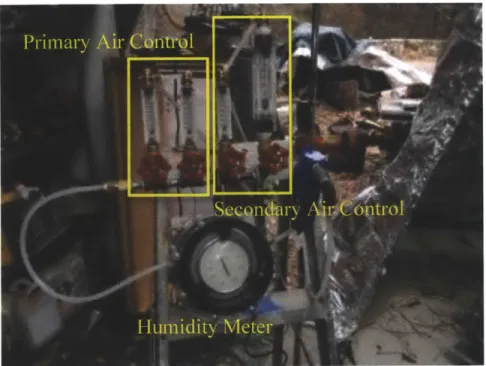
An inner cylinder (6" diameter) was placed inside a larger cylinder (7" diameter), replicating the double-walled concept found in the Philips stove. The sheath compartment was partitioned from the primary inlet in order to make the two systems independent of each other. The primary air was introduced through a circular tube perforated with 13 holes of diameter 3/32" directed slightly inwards. The secondary air was introduced through two rows of 25 holes with diameter 1/8". Air was pumped via an air compressor, and the humidity was monitored. Four vertical
mount rotameters controlled the primary and secondary airflow rates. The flowmeters used were: one Flowmeter 6-70 scfh with PVC fittings, one Flowmeter 2-20 sfcm, and two Flowmeter 10-180 scfh. For the primary air the 6-70 scfh and the 10-10-180 scfh were connected in series, whereas for secondary airflow one 10-180 scfh and one 2-20 scfm were connected (originally assumed that the secondary airflow needed to be higher and therefore increased the potential flow with this configuration). The larger flowmeter (2-20 scfm) was, however, never used except for the purpose of cooling down the system in between the trials. Figure 10 below is a picture of the valve set-up used.
Figure 10: Valves placed in series for control of primary and secondary airflow sourced from an air compressor
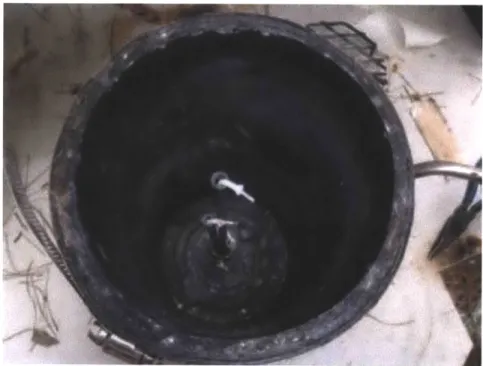
Eight thermocouples were used to measure temperatures at different locations in the system. Thermocouples 1-4 were positioned inside the combustion chamber at different heights. Thermocouple 6 was positioned at the primary air inlet. Thermocouple 7 was positioned at the secondary air inlets. The remaining two were controls-Thermocouple 8 measured the ambient temperature and Thermocouple 5 measured the temperature in the compressed air lines. The thermocouples that measured the chamber temperatures were introduced through narrow cylindrical tubes from the bottom of the system; the tubes shielded the thermocouples from excessive heat damage and can be seen in Figure 11. Thermocouple 1 was level with grate, Thermocouple 2 was 4 inches above the grate, Thermocouple 3 was 8 inches above the grate, and Thermocouple 4 was 12 inches above the grate (level with opening of the system). These Type-K thermocouple wires had an operating range of -200 to 1400 'C, with a typical accuracy of ± 5 degrees when operating between 0 and 900 'C. They interfaced with two LabPros, which connected to a MacBook Pro to collect temperature versus time data for each trial. This equipment can be seen in Figure 12.
Figure 11: Four thermocouples placed at different heights in the burn chamber
Figure 12: Setup for data collection. Temperatures from eight locations were collected
with eight thermocouples connected to two LabPros (four thermocouples each). LoggerPro software on a MacBook Pro interfaced with LabPros, collecting temperature readings every second and plotting temperature against time on one graph.
Furthermore, a cylindrical cover was placed on top of the burner, shown in Figure 13, in order to restrict the draft slightly and control the burn flames in the chamber.
Figure 13: Testing unit as it is being filled with pine needles before cylindrical cover was placed over the opening to restrict the draft slightly.
a trial. The
3.2 Methods
The pine needles used were collected from the forests of Carlisle, Massachusetts, and spread out in a thin layer indoors for at least 24 hours to decrease their moisture content. It is important to note that the material was not homogeneous; leaves and twigs remained within the material. Larger branches and pinecones were removed, but as testing wanted to replicate the combustion of unprocessed pine needles for practical cooking purposes, the pine needle material was not homogenized.
Before each trial, 100 grams of unprocessed pine needles were measured using a digital scale and placed within the burn chamber. The pine needles filled up to an approximate height of 6 inches above the grate in the combustion chamber in each trial. The rotameters were set to correct flow rates for both the secondary and primary air. A gas torch was used to start the trials, heating the pine needles for approximately 3 seconds, until the top surface of the fuel bed had caught fire. Data collection from the thermocouples to the LoggerPro software started simultaneously. The system was left to run independently for 15 minutes. Thereafter, data collection ceased and the hot ash was removed from the system with a vacuum. Primary and secondary airlines were open to their maximum flow rates, as a means of quickly cooling down the system between trials. When the temperature at the bottom of the burn chamber (Temperature 1) had reached below 50 'C, the system was ready to be reloaded with a new 100 gram sample of pine needles for testing.
Primary airflow was set to 20, 40, and 60 scfh using the flowmeters. For each of these primary airflows, secondary airflow was set to 30, 60, 90 scfh. Each combination underwent three trials of testing, totaling 27 tests for the experiment. This is shown in Figure 14.
Secondary Air Flow Rate (scfm) 30 60 90 20 A B C 40 D E F E 60 G H I
Figure 14: The Nine Test Configurations. A 3x3 matrix of configurations was
tested-each configuration was named alphabetically according to the matrix above.
4. Results
By controlling the airflow of primary and secondary air in the experimental setup, useful combustion characteristics for pine needles were derived. Testing found that pine needles burnt in a semi-gasification burner combust in two consecutive regimes. Regime 1 is characterized by the secondary burn of gases released from the primary burn of raw pine needles, whereas Regime 2 is characterized by the smoldering of pine needle charcoal. In Regime 1, the supply of secondary air decided whether the burner yielded powerful flames, yielded toxic plumes of smoke, or oscillated between the two. More primary air sped up and intensified the burn process; this affected the balance between how hot the fire burnt (amplitude) and its ability to sustain high temperatures over time (bandwidth). In Regime 2, if the primary air supply was inadequate, the fuel did not burn to completion. Testing proved that Regime 1 needed a relatively small flow of primary air, sufficient to release volatiles from the pine needle mass and a relatively large flow of secondary air to combust these gases, Regime 2 needed a relatively large flow of primary to maintain combustion of the charcoal and an insignificant amount of secondary air so as not too cool the burner. These general principles will be taken into consideration when designing for a practical pine needle-fueled semi-gasification stove.
This report collected both quantitative thermocouple data and qualitative observations of pine needle burn behavior. Measurements for temperature versus time are summarized graphically in Figure 15. Three trials were performed for each configuration, and Figure 15 shows the average results for each of the nine configurations. Graphs for each trial, as well as qualitative summaries for each configuration, can be found in the Appendix.
Section 4.1 will summarize the observed pine needle burn behavior. Section 4.2 will explain possible sources of variation in the data. Sections 4.3-4.5 will explain in greater detail the trends seen when varying airflow rates. Lastly, Section 4.6 will present future testing opportunities.
Figure 15: Temperature (C) v. Time (s). Thermocouple data for each configurations; each graph is the average taken from three trials.
4.1 Burn Cycles: Regime 1 and Regime 2
of the nine test
Based on observations made in all 27 trials, the combustion of pine needles operates in two regimes. The behavior of the system is very different depending on which regime is in full effect. In Regime 1, primary and secondary combustion may occur simultaneously; raw pine needles undergo primary combustion, and as a consequence, gases are released, thus enabling secondary combustion. When this happens, the result looks like Figure 16.a. It is possible, though, for those gases to not ignite. In such a situation, primary burning occurs without secondary burning, and plumes of white gases/smoke pour out of the system. When this happens, the result looks like Figure 16.b.
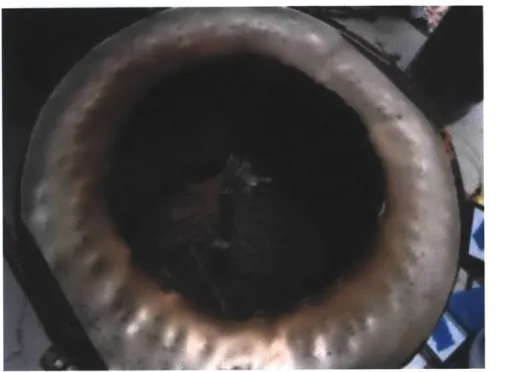
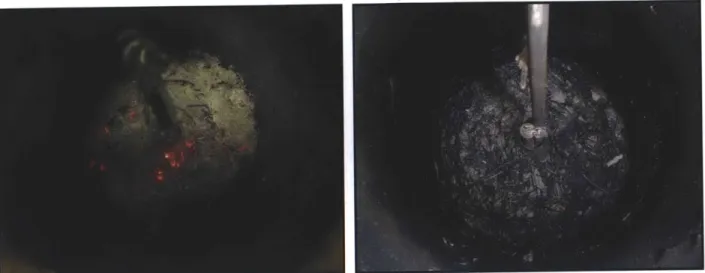
Regime 1 ends and Regime 2 begins once all the volatiles have been exhausted from the needles; at this point the fuel has been converted to charcoal. Regime 2 involves neither primary nor secondary combustion but has entered the charcoal burning stage, as described in Section 2.1.1. This charcoal retains smoldering heat until it burns to completion, at which point only ash remains and no more energy can be extracted from the fuel. If the correct amounts of air are delivered at the correct locations, Regime 2 look like Figure 17.a; if not, the charcoal may cool and not burn completely, thus resembling Figure 17.b. If burned to completion, the fuel bed will ultimately comprise of ash and will resemble Figure 18.a; if not, the process may end in the charcoal phase, including some raw pine needles, and resemble Figure 18.b.
Secondary Air Flow Rate (sdh)
30 60 90
/
-- Thermocouple 1 - Thermocuple 2 - Thenocouple 3 -- Thermouple 4 - Thermocouple 5 - Thermoouple 6 - Thermocouple 7 -- Thermocouple 8
Figure 16.a: Flames. Photo of secondary burning during the testing of Configuration C. Figure 16.b: White Gases. Photo of the plumes of gases released during the testing of
Configuration D.
Figure 17.a: Hot Charcoal Bed. In Regime 2, charcoal may bum red hot if under the
correct conditions. Photo taken after testing Configuration I.
Figure 17.b: Cool Charcoal Bed. In Regime 2, if under with the wrong conditions, the charcoal will cool and not burn. Photo taken after testing Configuration A.
Figure 18.a: Ash Fuel Bed. Photo of the fuel bed after testing Configuration D. Ultimately, all the fuel coverts to ash.
Figure 18.b: Charcoal Fuel Bed. Photo of the fuel bed after testing Configuration C. The fuel bed has some ash, but is primarily comprised of black charcoal.
Table I lists the positions of all the thermocouples and Figure 19 shows a standard graph broken up into Regime I and Regime 2, followed by the cooling down of ashes. Thermocouples 3 and 4-which are graphed in green and purple, respectively-are of greatest interest because they are located closest to where a pot would be located. In Regime 1, a peak and a bandwidth characterize the graphed shapes of thermocouples 3 and 4; their temperature readings drop drastically when transitioning to Regime 2. This is because for these sets of tests, the air flow rates were fixed throughout the trials; less secondary air is needed upon entering Regime 2, but since the secondary air remained fixed, it only served to cool the system down. Upon entering Regime 2, thermocouples 1 and 2-which are graphed in red are blue-rise in temperature. This makes sense; as the system transitions from secondary burning to charcoal burning, the
concentration of heat will increase at the base of the apparatus.
Table 1: Description of Thermocouple Locations
Thermocouple Location
I Bottom of Combustion Chamber
2 + 4" in Combustion Chamber
3 + 8" in Combustion Chamber
4 + 12" in Combustion Chamber
5 Air Compressor Line (Control)
6 Primary Air Inlet
7 Secondary Air Inlet
High Temperature Bandwidth
I
I
Thermocouple 4 Peak Temperature Regime 1: Secondary Burning Regime 2: Charcoal Burning Burn Completed: Ash Cooling 0 100 200 300 400 '00 600 700 800 900 Tew (s)-Thermocouple 1 -Thermocouple 2 -Thermocouple 3 -Thermocouple 4 -Thermocouple 5 -Thermocouple 6 -- Thermocouple 7 -Thermocouple 8
Figure 19: Typical Graph. A graph of thermocouple data broken up into regimes. Graph is of Trial 2 of Configuration F (i.e primary airflow is 40 scth and secondary airflow is 90 scfh)
4.2 Test Variability
The results were generally consistent, with each configuration having unique, observable behaviors and trends. However, some configurations had more variation than others between trials, and several factors may have contributed toward these discrepancies.
4.2.1 Moisture Content
The effects of moisture content on the combustion of pine needles have yet to be explored. The pine needles used for experimentation in this report were not tested for moisture content. The pine needles used from trial to trial felt approximately the same to the human tough in term of moisture; however, it is fair to assume that there was some variation. During testing, the ambient air moisture content ranged from 27-35%.
4.2.2 Pine Needle Packing Density
Each test used 100g of pine needles. However, batches of pine needles never pack exactly the same, and it is important to note that short or crushed pine needles will pack more densely than long pine needles. Efforts were made to pack the pine needles to the same height level in the bum chamber, to achieve a consistent packing volume and thus density; however, it is reasonable to assume some variation. It is also noteworthy that the height of the secondary air inlets relative to the top of the fuel bed-in this case, approximately 1 inch-may have some impact on secondary combustion; it has been set to 1 inch for these tests.
4.2.3 Fuel Homogeneity
The pine needles used for experimentation were collected off the floor of a pine needle forest. In addition to pine needles, small bits of twigs, tree bark, dried moss, pinecones, and dirt were inevitably collected. Since real use scenarios for burning pine needles always involve small amounts of foreign debris, it was decided that these bits of debris should not be separated from the test fuel. This lack of 100% homogeneity may have contributed to variation, even though each batch was given equal treatment in terms of containing small amounts of foreign material.
4.2.4 Igniting Techniques
A propane torch was used to light the top of the fuel bed at the start of each test. It was fired for approximately 3 seconds, but was not an automated process. Furthermore, the person facilitating this ignition process differed between trials; this adds a human variable, since people having slightly different lighting behaviors.
4.2.5 Apparatus Start Temperature
High velocity air was pumped through the apparatus to cool it down between trials. A trial was never started unless the system had been cooled to below 50C. It is reasonable to assume, though, that from trial to trial, there was variation in the system's starting point.
4.3 Trends Influenced by Primary Air 4.3.1 Burn Completion
Configurations A, B, and C, which had primary airflow rates of 20 scfh, failed to bum pine needles to completion. The end state of the fuel was primarily charcoal, with small amounts of ash and raw pine needles. This is illustrated in Figure 18.b. Thus, instead of burning in Regime 1 and then proceeding to Regime 2, the system burned in Regime 1 and then burned out. In contrast, Configurations D-I, which had primary airflow rates of 40 or 60 scfh, all successfully burned pine needles to ash and thus completion. This is illustrated in Figure 18.a. This occurred independently of changes made to secondary airflow rate. This indicates that in order to bum pine needle charcoal, the system needs a higher flow of primary air relative to what is needed to burn raw pine needles. Or conversely, one could state that raw pine needles bum with relatively little primary air, compared to pine needle charcoal.
4.3.2 Burn Rate
These tests indicate that increasing primary airflow rate increases the rate at which fuel is consumed. This is well illustrated by comparing Configurations C, F, and I, which all had secondary airflow rates of 90 scfh and each had a different primary flow rate (20 scfh, 40 scfh, and 60 scfh, respectively). Thermocouple 4 is the thermocouple of greatest interest, because it is positioned closest to where a cook pot would ultimately be placed; consequently, Figure 20 shows only the readings for thermocouple 4. Looking at the third matrix column in Figure 20 and examining the amplitudes and bandwidths of the temperature spikes, one can see that as primary airflow rate increases, the spikes extend higher but have narrower bandwidths. This indicates that for a relatively high primary airflow rate, the pine needles are consumed and heat is released in a hot fashion over a short period; for a relatively low flow rate, the process is slowed-heat is released over a longer duration of time, but consequently, does not reach as hot of a peak. It was also seen that Configuration I burned to completion (ash) more quickly than Configuration F, and Configuration C never even reached completion. Bandwidths were approximately 1 to 7 minutes. Thus, increasing the primary airflow rate increases the rate at which fuel is consumed, at least in the range of flow rates studied in this experiment.
This makes sense; one could predict that increasing the flow rate of primary air would facilitate a stronger primary burn, and a stronger primary burn in Regime 1 would result in the more rapid release of gases. If provided with enough secondary air, more gases mean hotter flames and thus higher spikes in temperature; since there is a fixed mass of pine needles per trial, the consequence of having a higher temperature spike is a shorter burner cycle (i.e. bandwidth).
Figure 20: Temperatures measured by thermocouple 4 in each configuration, as averaged across 3 trials, versus time. Units are in degrees Celsius.
4.3.3 Escaped Ashes
Additionally, there is an issue of ashes escaping upwards from the system. The apparatus has a set geometry with set air inlets. Thus, increasing airflow rate directly increases air velocity. One consequence of having relatively fast primary air is that it causes ashes to fly around; this is undesirable in the context of designing an indoor cook stove, since these ashes constitute emission particles, which are a major health hazard.
Table 2 shows the velocities of the primary and secondary air as it enters the burn chamber. These velocities were derived from the fact that the cross-sectional area of the primary air inlets totaled 6.23 x 10~4 ft2, and the cross sectional area of the secondary air inlets totaled 2.13 x 10~ ft2. A primary airflow rate of 60 scfh was found to be too vigorous and caused too many ashes to fly out of the system; while a primary airflow rate of 40 Sfch was more acceptable. A primary airflow rate of 20 scfh was good in terms of keeping ashes settled; however, as previously explained, there are other performance issues with this low flow rate that make it not viable.
Table 2: Air Velocities
Inlet velocities corresponding to primary and secondary airflow rates.
Primary Airflow Rate (scfh) Secondary Airflow Rate (scfh)
20 40 60 30 60 90
Velocity (m/s) 2.72 5.44 8.15 1.19 2.38 3.58
Secondary Air Flow Rate (scfh)
4.4 Trends Influenced by Secondary Air 4.4.1 Burning Gases: Flames v. Plumes
Configurations A, D, and G, which all had secondary airflow rates of 30 scfh, failed to have successful secondary burns. These 3 configurations burned through Regime 1 and thus released all of the gases from their fuel bed; however, the gases poured out of the system in plumes instead of igniting with the secondary air. This is illustrated in Figure 16.b. In contrast, Configurations C, F, and I, which had secondary airflow rates of 90 scfh, had successful secondary burns. The gases released by the primary burn mixed with the secondary air to create inverted diffusion flames; one could not visibly detect any unburned gases escaping the system. This is illustrated in Figure 16.a. Configurations B, E, and H, which had secondary airflow rates of 60 scfh, yielded mixed results. Sometimes the gases were fully aflame, sometimes they were not at all, and sometimes one could observe intertwined columns of both fire and gas. Thus, these results indicate that a relatively high volume of secondary air is needed to facilitate the secondary burn. 30 scfh was not sufficient, 60 scfh was sometimes sufficient, and 90 scfh was sufficient.
These results also suggest that there exists some sort of boundary between having enough air and not having enough air-or consequently-between having plumes of gases and having columns of flames. For this system and given quantity of fuel, it appears that a secondary airflow rate of 60 scfh was close to that boundary, hence the mixed results and struggle between gases and flames. A secondary airflow rate of 60 scth was successful for the cases in which primary airflow rate was relatively high; Configuration E and H (primary airflow rates of 40 scth and 60 scfh, respectively) produced flames, whereas Configuration B (primary airflow rate of 20 scfh) produced plumes of gases. One can hypothesize that at the higher primary airflow rates, some of the primary air effectively acts as additional secondary air; thus for the fixed secondary airflow rate of 60 scfh-where the system is just at the tipping point of having enough secondary air to facilitate the bum of gases-then primary airflow rate has the power to influence the outcome.
It is important to recognize that from the end user perspective, the secondary burn is approximately binary in nature-either the gases burn successfully and produce large amounts of heat, or the gases do not ignite and pour out toxic plumes. There is some gradation involved, but from the end user perspective, when the gases are present, they are present in large enough quantities that they would likely be deemed an unacceptable health hazard. Thus, it is absolutely critical to ensure a successful secondary burn.
4.4.2 Peak Thermocouple 4 Temperatures
Figure 21 shows the peak temperatures seen by thermocouple 4, as averaged across 3 trials per configuration. As previously mentioned, thermocouple 4 is the thermocouple of greatest interest, because it is positioned closest to where a cook pot would ultimately be placed. This figure shows that for a given primary airflow rate, increasing the secondary airflow rate results in an increase in peak thermocouple 4 temperatures. For example-when primary airflow rate was set to 60 scfh, increasing the secondary airflow rate from 30 scfh to 60 scfh to 90 scfh caused the thermocouple 4 peak temperatures to jump accordingly from 448'C to 660'C to 804'C
(increases of 140-220'C). In contrast, this figure shows that for a given secondary airflow rate, increasing the primary airflow rate has a relatively small affect on peak temperatures. For
example, when secondary air was set to 60 scfh, increasing the primary airflow rate from 20 scfh to 40 scfh to 60 scffi caused peak temperatures to change only marginally, from 572'C to 649C to 660*C (differences of 10-80*C).
Primary Air Primary Air Primary Air
Flow Rate = Flow Rate = Flow Rate =
20 scfh 40 scfh 60 scfh Soo 804 715 649 660 572 421 448 384 E
Secondary Air Flow Rate (scfh)
Figure 21: Peak Thermocouple-4 Temperatures. The peak temperatures measured by thermocouple 4 in each configuration, as averaged across 3 trials. Units are in degrees
Celsius.
This makes sense. Thermocouple 4 is located 3 inches above the secondary air holes, thus if an increase in secondary airflow rate corresponds to an increase in proper secondary burning, thermocouple 4 will be significantly affected since it sits directly in the flames.
4.5 Overall Heat Release
Figure 22 shows the average temperature of thermocouple 4 during the first 10 minutes of testing, as averaged across 3 trials per configuration. An interval of 10 minutes was chosen because for all of the trials, most of the burn activity was completed in the first 10 minutes, and beyond the 10-minute mark, all trials looked approximately the same. This claim is supported by Figure 23, which shows that by the 10-minute mark, all of the tests cooled to approximately the same temperature. These absolute values are not telling of the typical temperatures read by thermocouple 4, since each of the tests saw a wide range of temperatures with periods of spikes and declines. However, the average temperature can be used as a loose indication of overall heat release and combustion efficiency. Figure 22 indicates that for a given primary airflow rate, increasing the secondary airflow rate results in an increase in overall heat release. This Figure also shows that for a given secondary airflow rate, increasing the primary airflow rate results in an increase of overall heat release.
Using average temperature is a very simplified way of evaluating relative combustion efficiency; however, it is important to note that overall efficiency is determined by both combustion efficiency and heat transfer efficiency, where combustion efficiency is a measure of how effectively the fuel is converted into heat, and heat transfer efficiency is a measure of how effectively that heat is transferred to a cook piece. Heat transfer efficiency is not addressed in this report, thus at this point, is unclear what the ideal temperatures are for thermocouple 4. It is
important to note, though, that there is currently a correlation between burn cleanliness (clean meaning no escaped gases) and magnitude of thermocouple 4 temperature readings.
Primary Air Primary Air Primary Air
Flow Rate = Flow Rate = Flow Rate =
20 scfh 40 scfh 60 scfh 429 445 447 449 4_ 388 285 253314 'C. 204 E
Secondary Air Flow Rate (scfh)
Figure 22: Average Thermocouple 4 Temperature from t = 0 to 10 min. The average
temperature measured by thermocouple 4 from t = 0 to 10 minutes, as averaged across 3
trials. Units are in degrees Celsius.
Primary Air Primary Air Primary Air
Flow Rate = Flow Rate = Flow Rate =
20 scfh 40 scfh 60 scfh
215 241 250 254 226 272
W 172 157
CL
E
Secondary Air Flow Rate (scfh)
Figure 23: Thermocouple 4 Temperature at t = 10 min. The average temperature
measured by thermocouple 4 at the 10-minute mark, as averaged across 3 trials. Units are in degrees Celsius.
4.6 Favored Configurations & Future Testing for this System
There was not one perfect configuration that was tested-there were trade offs between the success of the secondary burn, the completion of the burn process, the values of peak temperatures, the duration of high temperatures, and the presence of flying ashes.
Of the nine configurations tested, Configuration C was valued for its high temperatures and clean burn, producing minimal escaped gases. Due to the low flow rate of primary air, the primary burn occurred relatively slowly, thus high temperatures were sustained for longer; additionally, this low primary airflow rate did not cause the ashes to fly out of the system; since the flow rate of secondary air was relatively high, the secondary burn was successful. The downside to Configuration C was that though it performed well in Regime 1, it performed poorly in Regime 2, never successfully converting charcoal to ash. Burn completion was not an issue in
configurations with higher primary flow rates-Configurations D -I. Thus, for Configuration C, one could hypothesize that by increasing the primary air 5 minutes into the test (as it transitions into Regime 2), this could allow it to properly process its charcoal, and may result in an optimal setting.
The next step would be to test this apparatus with multiple airflow rates per trial, to address the needs of Regime 1 and Regime 2 more specifically. For example, running the system with a primary airflow rate of 20 scfh and secondary airflow rate of 90 scfh for the first 4 minutes of testing (Configuration C's settings), then changing the settings to 40 scfh and 30 scfh, respectively (Configuration D settings), for the remainder of the trial. This would be in hopes that the higher primary air setting would facilitate the burning of charcoal, and since secondary burning is over, secondary air can be reduced to limit unnecessary cooling.
Another future step could be to test with different shapes or sizes for the primary and secondary air inlets. Changing the geometry of these air inlets allows one to change the velocity of the incoming air. For example, increasing the size of the primary air inlet holes will slow down the velocity of the incoming air, given a fixed airflow rate. This may change the way ashes circulate around the system, but also may have an impact on how well the air mixes with the fuel.
Another future step would be to perform emissions testing on the top configurations and compare it against existing emissions benchmarks.
6. Conclusion
The motivation behind this report was to develop a stronger understanding of pine needle combustion behavior in a semi-gasifier, in order to ultimately design an effective pine needle cook stove for people in the developing world. The most practical solution may lie in designing a passive, natural convection system, since more complicated systems are not economically viable for the demographic in question. The system tested in this report used forced air, so the numerical results of this report are not directly transferable and applicable to designing the desired passive system. However, the findings of this report can be used as an initial benchmark and resource in understanding the behavior of pine needle combustion. Specifically, the conditions necessary for the success of the two combustion regimes will be taken into consideration when designing the airflow function of a pine needle stove. The stove should allow the user to control primary and secondary air independently, to cater to each regime. In Regime 1, the primary airflow rate should be turned down and the secondary airflow rate should be relatively high. As the user notices that secondary combustion of volatiles has
finished-signaling that the combustion of the pine needles has enter Regime 2-primary air flow rate should be increased and secondary air flow rate should be limited.
Furthermore, another factor that needs to be addressed in stove design is the feeding of fuel. Currently, the combustion "bandwidth" is not long enough to practically cook with. In most trials, the temperature drops significantly by minute 7. The tests used only 100 grams of pine needles, but in order to keep the stove running for a minimum cooking time requirement of approximately one and a half hours, the chamber would practically be too large to run it in a batch method for the semi-gasifier. Therefore there would need to be a fuel shoot to incrementally add more fuel to the system. This would alter burn conditions and therefore this presents a difficult design challenge.
Pine needles have the potential of being an energy-dense, cheap, and environmentally friendly fuel that, when applied to an efficient stove, can greatly help the fuel-efficient, clean cooking stove challenge in developing countries. However, there is still much work to be done in order to make a pine needle stove a working solution, and the team looks forward to continuing with their progress.
7. Acknowledgments
First, thank you to the rest of the Pine Needle Stove for their work on the stove, both past and present. This team consistsof two other MIT 2011 Mechanical Engineering undergraduates, Alyssa Roque and Danielle Whited, as well as Jic Davis, who originally mentored the project during the Spring 2010 MIT D-Lab class. A special thank you to Jic Davis for his integral part in developing and building the test apparatus, and for lending his home and workshop in Carlisle for this report's extensive testing. A warm thank you to Daniel Lionberg of Colorado State University's Engines and Energy Conversion Lab (EECL), for sharing his expertise regarding combustion and stove design. Thank you also to Christian L'Orange of the EECL, for sharing his expertise on semi-gasifiers. Furthermore, Amy Smith and Victor Grau Serrat should be recognized for initiating the Pine Needle Stove project in their MIT D-Lab class. Thank you to Rajnish Jain, this project's community partner in India, who came up with the challenge and helped with the development of the first prototype. Thank you to Professor Gareth McKinley, Associate Head of the Mechanical Engineering Department, and the Helen William Mazer Foundation for providing funding for research and materials. Lastly, much gratitude is extended to Professor Wai Cheng for his advice and guidance during the development of the pine needle burner thesis.
8. References
'V. Michael, Heating with Wood: Principles of Combustion, MontGuide, Montana State University Extension, October 2005
2M.J. Safi, I.M Mishra, and B. Prasad, Global degradation kinetics ofpine needles in air,
Department of Chemical Engineering, Indian Institute of Technology, Roorke, 2003
3M. Bryden, et al., Design Principlesfor Wood Burning Cookstoves, Aprovecho Research
Center, Partnership for Clean Indoor Air, Shell Foundation, June 2005
4Aprovecho Research Center, Rocket Stove, In the Wake, www.inthewake.org
5T.B Reed and R.Larson, A Wood-gas Stovefor Developing Countries, in Biomass Energy
Foundation, Golden CO., May 1996.
6D. Hegarty, Satisfying a Burning Need, Philips Research Password, The World Energy
9. Appendix
The following section provides summaries for each of the nine test configurations. Each summary is based on observations taken from three trials.
9.1 Configuration A
Primary Airflow Rate: 20 scfh Secondary Airflow Rate: 30 scfh Consistency across trials: Consistent
Behavioral Trends: Trials began with primary and secondary burning with orange inverted diffusion flames, but secondary burning ceased by the 1-2 minute mark. This burn out was followed immediately by 2-3 minutes of heavy gassing, then 3-5 minutes of gradually reduced gassing, with a light glow to the fuel bed. By the 10-minute mark, minimal activity was observed-the fuel bed had only minimal smoldering. See Figure 24 for graphs.
Final Composition: Charcoal with minimal ash and some raw pine needles
Primary Air Flow Rate = 20 scfh Secondary Air Flow Rate = 30 scfh
Trial 1 Trial 2 Trial 3
-Thermocouple 1-Thermocouple 2 -Thermocouple 3--Thermocouple 4
- Thermocouple 5 - Thermocouple 6 -- Thermocouple 7 - Thermocouple 8
Figure 24: Configuration A Results. Temperature v. time data for Configuration A. 9.2 Configuration B
Primary Airflow Rate: 20 scfh Secondary Airflow Rate: 60 scfh
Consistency across trials: Inconsistent; trial 3 behaved very differently from Trials 1 and 2 Behavioral Trends: Trials 1 and 2 behaved very similarly to Configuration A-they began with primary and secondary burning, secondary burning was halted by the 2-minute mark, the fuel proceeded to heavily gas, then after a few minutes the gassing decreased. By the 9-minute mark, only minimal smoldering remained. Trial 3 behaved very differently from Trials 1 and 2-the secondary burn was sustained for longer, with the inverted diffusion flames having purple color at the roots, with no visibly escaped unburned gases. The strength of the inverted diffusion flames was strong for a few minutes then slowly dwindled over the next few minutes, and at the 7-minute mark, secondary burning stopped. The system began releasing very thin wisps of gas. The fuel bed glowed orange, but by the 10-minute mark, it had cooled and there was only very
minimal smoldering. In all three trials, the fuel turned into black charcoal, but none of them converted fully to ash. See Figure 25 for graphs.
Final Composition: Charcoal with minimal ash
Trial 1
Primary Air Flow Rate = 20 scfh Secondary Air Flow Rate = 60 scfh
Trial 2 Trial 3
-Thermcouple 1-Thermocouple 2 -Thermocouple 3 -Thermocouple 4
-- Thermocouple 5 -Thermocouple 6 -- Thermocouple 7 -- Thermocouple 8
Figure 25: Configuration B Results. Temperature v. time data for Configuration B. 9.3 Configuration C
Primary Airflow Rate: Secondary Airflow Rate: Consistency across trials:
20 scfh 90 scfh Consistent
Behavioral Trends: Trials began with primary and secondary burning with several minutes of inverted diffusion flames-blue at the roots and orange as they arose, travelling quickly. Secondary burning ceased around the 6-minute mark, at which point very faint wisps of gases were released for about a minute. The fuel bed glowed orange, but by the 10-minute mark, minimal activity was observed-the fuel bed had only minimal smoldering. See Figure 26 for graphs.
Final Composition: Charcoal with minimal ash
Primary Air Flow Rate = 20 scfh Secondary Air Flow Rate = 90 scfh
Trial 1 Trial 2 Trial 3
S- 11
-D
-Thermocouple 1--Thermocouple 2 -Thermocouple 3 -Thermocouple 4 -Thermocouple 5 -Thermocouple 6 - Thermocouple 7 -Thermocouple 8
9.4 Configuration D
Primary Airflow Rate: 40 scfh Secondary Airflow Rate: 30 scfh Consistency across trials: Consistent
Behavioral Trends: The start had mixed behaviors- there was some secondary burning with purple inverted diffusion flames, but not all the gases were consumed. By the 1-minute mark, gases dominated and the secondary flames burned out. For the next 2-3 minutes, the system released heavy plumes of gases. Around the 4-minute mark, gases spontaneously lit and spent 1 minute oscillating between lit and unlit, with approximately 10-second intervals. At the
5-minute mark, the system settled into only primary burning, such that the fuel bed glowed orange with small jets of purple from the primary air streams, but no more flames. By the 9-minute mark, the fuel bed glowed orange as charcoal burned, and ashes went flying from the primary air, but no more visible hot streams were present. By the 12-minute mark, most of the fuel had been converted to ash. See Figure 27 for graphs.
Final Composition: Ash
Primary Air Flow Rate = 40 scfh Secondary Air Flow Rate = 30 scfh
Trial 1 Trial 2 Trial 3
-Thermocouple I -Thermocouple 2--Thermocouple 3--Thermocouple 4
- Thermocouple 5 - Thermocouple 6 -- Thermocouple 7 -- Thermocouple 8
Figure 27: Configuration D Results. Temperature v. time data for Configuration D
9.5 Configuration E
Primary Airflow Rate: 40 scfh Secondary Airflow Rate: 60 scfh
Consistency across trials: Inconsistent; Trial 1 behaved very differently from Trials 2 and 3 Behavioral Trends: For Trials 2 and 3, the first five minutes consisted of primary and secondary burning, producing purple-blue inverted diffusion flames with no visible gases escaping unburned. The 5 to 6-minute mark saw faint wisps of gases as the strength of the secondary gradually diminished into nothing, then the fuel bed settled into being an orange-red glowing mass of charcoal. Ashes were blown around from the flow of primary air. By the 10-minute mark, the fuel bed appeared to be still strongly glowing hot with some charcoal but mostly ash. Trial 1 behaved differently-it began the same as the other trials, but the secondary burning came to a halt after 3 minutes and moderate plumes of gases poured out of the system,
diminishing over the course of another 3 minutes. The fuel bed continued to glow through the remainder of the test, diminishing over time. See Figure 28 for graphs.
Final Composition: Ash; for Trial 1, some charcoal remained
Primary Air Flow Rate = 40 scfh Secondary Air Flow Rate = 60 scfh
Trial 1 Trial 2 Trial 3
-
u h l
r 3
o
-Thermocouple 1 -Thermocouple 2 -- Thermocouple 3 -- Thermocouple 4
--Thermocoupe 5--Thermocouple 6 -Thermocouple 7 -- Thermocouples8
Figure 28: Configuration E Results. Temperature v. time data for Configuration E. 9.6 Configuration F
Primary Airflow Rate: 40 scfh Secondary Airflow Rate: 90 scfh Consistency across trials: Consistent
Behavioral Trends: Trials began with primary and secondary burning with several minutes of roaring inverted diffusion flames-blue at the roots and orange as they arose, travelling quickly. The secondary burn was vigorous and produced tall flames, with no escape of unburned gases. Secondary burning died down between the 3 to 4-minute mark, settling into charcoal burning only. The charcoal bed glowed strongly-bright orange with wisps of purple coming off. Ashes flew around. By the 10-minute mark, it appeared to be mostly ash, and by the 12-minute mark, it was all turned to ash. See Figure 29 for graphs.
Final Composition: Ash
Trial 1
Primary Air Flow Rate = 40 scfh Secondary Air Flow Rate = 90 scfh
Trial 2 Trial 3
-Thermocouple 1 -Thermocouple 2 -Thermocouple 3 -Thermocouple 4 -Thermocouple 5 -Thermocouple 6 - Thermocouple 7 -- Thermocouple 8