HAL Id: hal-00299012
https://hal.archives-ouvertes.fr/hal-00299012
Submitted on 1 Jan 2003
HAL is a multi-disciplinary open access
archive for the deposit and dissemination of
sci-entific research documents, whether they are
pub-lished or not. The documents may come from
teaching and research institutions in France or
abroad, or from public or private research centers.
L’archive ouverte pluridisciplinaire HAL, est
destinée au dépôt et à la diffusion de documents
scientifiques de niveau recherche, publiés ou non,
émanant des établissements d’enseignement et de
recherche français ou étrangers, des laboratoires
publics ou privés.
Relatively small earthquakes of Javakheti Highland as
the precursors of large earthquakes occuring in the
Caucasus
M. Kachakhidze, N. Kachakhidze, R. Kiladze, V. Kukhianidze, G. Ramishvili
To cite this version:
M. Kachakhidze, N. Kachakhidze, R. Kiladze, V. Kukhianidze, G. Ramishvili. Relatively small
earth-quakes of Javakheti Highland as the precursors of large earthearth-quakes occuring in the Caucasus. Natural
Hazards and Earth System Science, Copernicus Publications on behalf of the European Geosciences
Union, 2003, 3 (3/4), pp.165-170. �hal-00299012�
Natural Hazards and Earth System Sciences (2003) 3: 165–170 c
European Geosciences Union 2003
Natural Hazards
and Earth
System Sciences
Relatively small earthquakes of Javakheti Highland as the
precursors of large earthquakes occuring in the Caucasus
M. Kachakhidze1, N. Kachakhidze1, R. Kiladze2, V. Kukhianidze2, and G. Ramishvili21Tbilisi State University, Chavchavadze st. 2, Tbilisi 380028, Georgia
2Abastumani Astrophysical Observatory, Kazbegi av. 2a, Tbilisi 380060, Georgia
Received: 21 June 2002 – Revised: 16 August 2002 – Accepted: 19 August 2002
Abstract. Javakheti Highland is one of the most seismic
ac-tive regions of the Caucasus. The majority of earthquakes observed throughout the region occur within this small area
(φ = 40.8◦−41.8◦; λ =43.3◦−44.3◦). One can expect
that exclusive seismic activity of Javakheti Highland testifies to global geophysical processes which take place through-out the Caucasus region. Based on the above-mentioned, of interest was to study variation with time of the number of earthquakes occurring in Javakheti region. We analysed some 695 relatively small earthquakes (2.5 ≤ M < 6.0) observed in Javalkheti Highland within the period of 1961– 1992 with regard to large earthquakes M ≥ 6.0 of the region which occurred in the same period. It was found that each large earthquake of the Caucasus is anticipated by clear pre-cursor in a form of an anomalous change in the number of relatively small earthquakes in Javakheti Highland.
1 Introduction
From geological and geomorphologic viewpoints Javakheti Highland is one of the complex regions of the southern
Georgia. It lies in the northern peripheral zone of the
Transcaucasus-Asia Minor volcanic area, and to certain ex-tent comprises territories of Armenia and Turkey as well.
Javakheti Highland is of special interest due to its highest seismic activity throughout the Caucasus: 55% of all Cau-casian earthquakes occur there (Duff et al., 1980; Keilis-Borok et al., 1980; Gotsadze et al., 1987; Kumaz et al., 1987; Chadwick et al., 1988, Kuloshvili et al., 1989; Handbook, 1990; Dea et al., 1991; Shebalin et al., 1999; Papadopoulos et al., 2000; Rundle et al., 2000; Sorrells et al., 2002; Westaway, 2002). Consequently, seismic activity of Javakheti Highland is the most obvious and it may reflect general changes in tectonic stress of the Caucasus region (Borisov et al., 1989; Park et al., 1993; Hayakawa et al., 2000; Tzanis et al, 2000).
Correspondence to: M. Kachakhidze
(manana k@hotmail.com or manana k@mail.ge)
Therefore Javakheti Highland may be “sensitive” to the large earthquakes.
The goal of our research was to study time-variation of the number of relatively small earthquakes occurring in Javakheti region with regard to large earthquakes of the Cau-casus.
2 Data
Taking into consideration general pattern of earthquake dis-tribution throughout the southern Caucasus, we decided to use comparatively broadened approach to Javakheti High-land, namely the territory defined by the coordinates was se-lected.
We have used an Earthquake Catalogue of the Caucasus region compiled by the Department of the Regional Seismol-ogy at the Institute of Geophysics, Georgian Academy of Sci-ences. The catalogue comprises all earthquakes with magni-tude M ≥ 2.5 observed in 1900–1992. After preliminary studies we had to restrict our analysis to the events occurred since 1961 – data on 1900–1960 earthquakes of Javakheti Highland seemed incomplete, as only 123 events were ob-served.
695 earthquakes of magnitude (2.5 ≤ M < 6.0) occurred in Javakheti Highland within the time interval between 1961– 1992. There were 16 large earthquakes in the whole Cau-casus region with M ≥ 6.0 including Spitak earthquake oc-curred on 7 December 1988 (epicentre of this earthquake was located in Javakheti Highland).
Data on the above large earthquakes are given in the
Ta-ble 1. Figure 1 illustrates a map where the territory of
Javakheti Highland under consideration is framed by quad-rangle.
3 Discussion
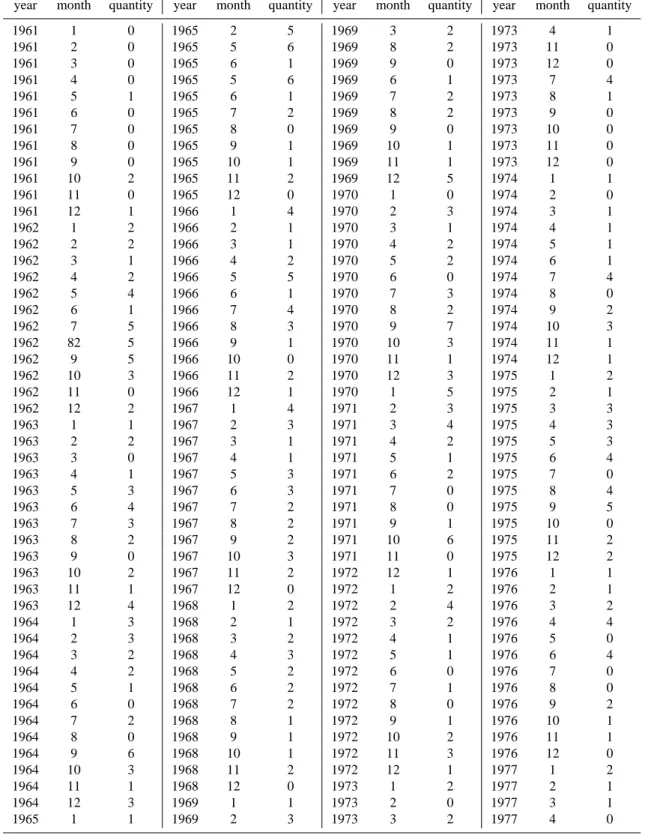
Table 2, which shows monthly number of earthquakes ob-served during 1961–1992, was compiled to establish the rule of variation of the number of relatively small earthquakes of
166 M. Kachakhidze et al.: Relatively small earthquakes of Javakheti Highland
6
Fig.B1 Distribution of large earthquakes of the Caucasus
Black Sea Caspian Sea
. .
. . .
....
.
.
...
..
Fig. 1. Distribution of large earthquakes of the Caucasus.
Table 1. The data of large earthquakes of the Caucasus
date ϕ λ M 18 Sept. 1961 41.066N 50.233E 6.6 27 Jan. 1963 41.080N 49.840E 6.2 16 July 1963 43.180N 41.650E 6.4 19 Aug. 1966 39.166N 41.550E 6.8 14 May 1970 43.000N 47.083E 6.6 22 May 1971 38.850N 40.516E 6.8 28 July 1976 43.170N 45.600E 6.2 24 Nov. 1976 39.100N 44.000E 7.0 4 Nov. 1978 37.610N 49.040E 6.0 4 May 1980 37.800N 49.100E 6.2 30 Oct. 1983 39.983N 41.600E 6.8 6 March 1986 40.060N 51.630E 6.1 7 Dec. 1988 40.900N 44.200E 6.9 16 Sept. 1989 40.340N 51.600E 6.3 29 April 1991 42.390N 43.680E 6.9 23 Oct. 1992 42.490N 44.990E 6.3
Javakheti Highland. The corresponding graph (Fig. 2) was drawn on the base of the data given in Table 2 (here and else-where dark triangles stand for the occurrence of large earth-quakes throughout the Caucasus within the same period).
Variation of the number of relatively small earthquakes of Javakheti Highland with time is shown in Fig. 2. We used the method of the Creeping Mean for better separation of the anomalies. Namely, we smoothed data series, from 2 to 20 months in length, with a lag of one month until the sharp picture was observed. The 9-month series were found the most appropriate for smoothing, since they proved to be ac-ceptable for further processing and analysing (Comparatively worse graphs were obtained in case of smoothing time series
7
Fig.B2 Variation of the number of relatively small earthquakes with time
0 2 4 6 8 10 1960 1962 1963 1965 1966 1968 1970 1971 1973 1974 1976 1977 1979 1981 1982 1984 1985 1987 1989 1990 1992
Fig. 2. Variation of the number of relatively small earthquakes with
time.
8
Fig.B3 A result of smoothing of the 9-month series of earthquakes distribution.
0 5 10 15 20 25 30 35 40 1960 1962 1963 1965 1966 1968 1970 1971 1973 1974 1976 1977 1979 1981 1982 1984 1985 1987 1989 1990 1992
Fig. 3. A result of smoothing of the 9-month series of earthquakes
distribution.
from 7 to 12 months in length. The series shorter or longer than that give distributions which are vague for interpreting) 9-month series choice has not any physical reason. It was chosen empirically because of being the best sygnal/noise
M. Kachakhidze et al.: Relatively small earthquakes of Javakheti Highland 167
Table 2. List of relatively small earthquakes of Javakheti highland
year month quantity year month quantity year month quantity year month quantity
1961 1 0 1965 2 5 1969 3 2 1973 4 1 1961 2 0 1965 5 6 1969 8 2 1973 11 0 1961 3 0 1965 6 1 1969 9 0 1973 12 0 1961 4 0 1965 5 6 1969 6 1 1973 7 4 1961 5 1 1965 6 1 1969 7 2 1973 8 1 1961 6 0 1965 7 2 1969 8 2 1973 9 0 1961 7 0 1965 8 0 1969 9 0 1973 10 0 1961 8 0 1965 9 1 1969 10 1 1973 11 0 1961 9 0 1965 10 1 1969 11 1 1973 12 0 1961 10 2 1965 11 2 1969 12 5 1974 1 1 1961 11 0 1965 12 0 1970 1 0 1974 2 0 1961 12 1 1966 1 4 1970 2 3 1974 3 1 1962 1 2 1966 2 1 1970 3 1 1974 4 1 1962 2 2 1966 3 1 1970 4 2 1974 5 1 1962 3 1 1966 4 2 1970 5 2 1974 6 1 1962 4 2 1966 5 5 1970 6 0 1974 7 4 1962 5 4 1966 6 1 1970 7 3 1974 8 0 1962 6 1 1966 7 4 1970 8 2 1974 9 2 1962 7 5 1966 8 3 1970 9 7 1974 10 3 1962 82 5 1966 9 1 1970 10 3 1974 11 1 1962 9 5 1966 10 0 1970 11 1 1974 12 1 1962 10 3 1966 11 2 1970 12 3 1975 1 2 1962 11 0 1966 12 1 1970 1 5 1975 2 1 1962 12 2 1967 1 4 1971 2 3 1975 3 3 1963 1 1 1967 2 3 1971 3 4 1975 4 3 1963 2 2 1967 3 1 1971 4 2 1975 5 3 1963 3 0 1967 4 1 1971 5 1 1975 6 4 1963 4 1 1967 5 3 1971 6 2 1975 7 0 1963 5 3 1967 6 3 1971 7 0 1975 8 4 1963 6 4 1967 7 2 1971 8 0 1975 9 5 1963 7 3 1967 8 2 1971 9 1 1975 10 0 1963 8 2 1967 9 2 1971 10 6 1975 11 2 1963 9 0 1967 10 3 1971 11 0 1975 12 2 1963 10 2 1967 11 2 1972 12 1 1976 1 1 1963 11 1 1967 12 0 1972 1 2 1976 2 1 1963 12 4 1968 1 2 1972 2 4 1976 3 2 1964 1 3 1968 2 1 1972 3 2 1976 4 4 1964 2 3 1968 3 2 1972 4 1 1976 5 0 1964 3 2 1968 4 3 1972 5 1 1976 6 4 1964 4 2 1968 5 2 1972 6 0 1976 7 0 1964 5 1 1968 6 2 1972 7 1 1976 8 0 1964 6 0 1968 7 2 1972 8 0 1976 9 2 1964 7 2 1968 8 1 1972 9 1 1976 10 1 1964 8 0 1968 9 1 1972 10 2 1976 11 1 1964 9 6 1968 10 1 1972 11 3 1976 12 0 1964 10 3 1968 11 2 1972 12 1 1977 1 2 1964 11 1 1968 12 0 1973 1 2 1977 2 1 1964 12 3 1969 1 1 1973 2 0 1977 3 1 1965 1 1 1969 2 3 1973 3 2 1977 4 0
ratio among other variants. Figure 3 shows graph obtained as a result of smoothing of the 9-month series of earthquakes distribution. Some character of variation with time of rela-tively small earthquakes number of Javakheti Highland was revealed as a result of the analysis, and the necessity for fur-ther study was obvious.
We have applied the qualitative method for anomaly sepa-ration, namely the method for summation with variable sign (Handbook, 1990) widely used in Geophysics, to separate “useful” anomalies from disturbances. The method is quite convenient even in case when the amplitude of disturbances equals or exceeds the amplitude of “useful” anomalies.
168 M. Kachakhidze et al.: Relatively small earthquakes of Javakheti Highland
Table 2. continued
year month quantity year month quantity year month quantity year month quantity
1977 5 1 1981 7 0 1985 9 2 1989 11 1 1977 6 2 1981 8 0 1985 10 2 1989 12 3 1977 7 1 1981 9 3 1985 11 1 1990 1 1 1977 8 0 1981 10 1 1985 12 1 1990 2 0 1977 9 3 1981 11 2 1986 1 1 1990 3 1 1977 10 2 1981 12 0 1986 2 2 1990 4 1 1977 11 0 1982 1 1 1986 3 3 1990 5 1 1977 12 2 1982 2 3 1986 4 0 1990 6 1 1978 1 9 1982 3 3 1986 5 7 1990 7 1 1978 2 2 1982 4 1 1986 6 3 1990 8 1 1978 1 9 1982 3 3 1986 5 7 1990 7 1 1978 3 4 1982 5 7 1986 7 1 1990 9 0 1978 4 2 1982 6 0 1986 8 2 1990 10 0 1978 5 4 1982 7 2 1986 9 2 1990 11 0 1978 6 6 1982 8 3 1986 10 0 1990 12 5 1978 7 1 1982 9 2 1986 11 0 1991 1 0 1978 8 4 1982 10 2 1986 12 2 1991 2 1 1978 9 1 1982 11 2 1987 1 1 1991 3 1 1978 10 2 1982 12 2 1987 2 1 1991 4 2 1978 11 2 1983 1 2 1987 3 1 1991 5 2 1978 12 0 1983 2 4 1987 4 3 1991 6 2 1979 1 2 1983 3 0 1987 5 3 1991 7 2 1979 2 2 1983 4 3 1987 6 0 1991 8 5 1979 3 0 1983 5 1 1987 7 3 1991 9 0 1979 4 0 1983 6 2 1987 8 2 1991 10 3 1979 5 1 1983 7 2 1987 9 2 1991 11 0 1979 6 0 1983 8 0 1987 10 1 1991 12 4 1979 7 0 1983 9 3 1987 11 2 1992 1 2 1979 8 1 1983 10 2 1987 12 1 1992 2 2 1979 9 0 1983 11 2 1988 1 1 1992 3 1 1979 10 4 1983 12 3 1988 2 1 1992 4 0 1979 11 5 1984 1 3 1988 3 3 1992 5 2 1979 12 4 1984 2 1 1988 4 3 1992 6 0 1980 1 1 1984 3 2 1988 5 1 1992 7 1 1980 2 1 1984 4 0 1988 6 3 1992 8 2 1980 3 2 1984 5 0 1988 7 0 1992 9 3 1980 4 0 1984 6 2 1988 8 2 1992 10 3 1980 5 5 1984 7 0 1988 9 1 1992 11 2 1980 6 1 1984 4 2 1988 10 0 1992 12 0 1980 7 0 1984 9 1 1988 11 1 1993 1 2 1980 8 1 1984 10 0 1988 12 6 1993 2 1 1980 9 0 1984 11 1 1989 1 4 1993 3 2 1980 10 1 1984 12 2 1989 2 3 1993 4 2 1980 11 4 1985 1 3 1989 3 2 1993 5 4 1980 12 4 1985 2 2 1989 4 2 1993 6 1 1981 1 2 1985 3 1 1989 5 2 1993 7 0 1981 2 0 1985 4 1 1989 6 7 1993 8 0 1981 3 0 1985 5 1 1989 7 2 1993 9 1 1981 4 2 1985 6 0 1989 8 1 1993 10 2 1981 5 1 1985 7 3 1989 9 1 1993 11 0 1981 6 0 1985 8 1 1989 10 3 1993 12 0
Condition for application of the method is availability of an anomalous curve, which cuts off approximately equal ar-eas from the axis of abscissas. We computed average value of those data, according to which Fig. 3 was drawn. This value
equals 15.72. Drawing of the “zero line” across the average value made possible to apply the above-mentioned method for summation with variable sign (Naturally, the number of earthquakes was subdivided into “positive” and “negative”
M. Kachakhidze et al.: Relatively small earthquakes of Javakheti Highland 169 -30 0 30 60 90 120 150 180 210 240 270 300 330 360 390 a x 0 y xk+1 xk xk-1 -3 0 0 3 0 6 0 9 0 1 2 0 1 5 0 1 8 0 2 1 0 2 4 0 2 7 0 30 0 3 30 3 60 3 90 x b y 0 xk + 2 xk -2 xk + 1 xk xk -1
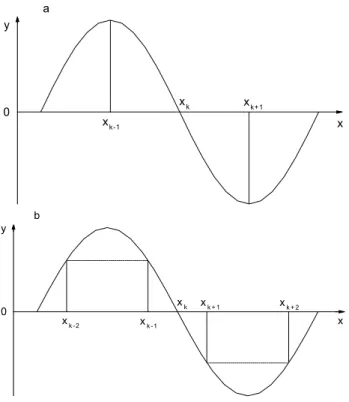
Fig. 4. Ilustration of the method of summation with variable sign.
values as a result of drawing the “zero line”. The “negative” values imply decrease in the number of earthquakes).
The method of summation with variable sign is based on the amplitude doubling of the maximum anomalous signal in case of dissecting minimum value (with own sign) from the maximum one.
Difference between the ordinates of xk−1and xk+1points
(Fig. 4a) is denoted by y0(xk), and attributed to xkpoint:
y0(xk) = y(xk−1) − y(xk+1). (1)
If while transforming the anomaly we use four (or more) ordinates of the anomalous curve instead of two, as shown in Fig. 4b, we will have:
y(xk) = y(xk−2) + y(xk−1) − y(xk+1) − y(xk+2). (2) Consequently, the above method transforms each idealized anomaly with the “variable sign” into the anomaly with cor-responding sign and with twofold, fourfold (multifold) am-plitude.
Ratio of the amplitude of the desired signal y0to the square
root of the amplitude’s dispersion of the disturbance σ0
sig-nificantly increases in case of the above transformation, and the applied operator “works” as a filter which amplifies the desired signal.
Figure 5 shows complicated anomalous pattern obtained from Fig. 3 by means of the method of summation with vari-able sign (with 16 ordinates). Analysis of the obtained curve, based on the gradual approximation, makes possible to delin-eate the certain zone with margins from +53.1 to −51.8. The “useful” anomalies observed beyond the zone, give evidence
10
Fig.B5. Result of summation with variable sign of relatively small earthquakes
-160 -120 -80 -40 0 40 80 120 160 1961 1962 1963 1963 1964 1965 1966 1967 1968 1969 1970 1971 1972 1973 1974 1974 1975 1976 1977 1978 1979 1980 1981 1982 1983 1984 1985 1985 1986 1987 1988 1989 1990 1991 1992
Fig. 5. Result of summation with variable sign of relatively small
earthquakes.
11
Fig.B6. “Reduced” graph of anomalous
-100 -80 -60 -40 -20 0 20 40 60 80 100 1961 1962 1964 1965 1967 1969 1970 1972 1973 1975 1977 1978 1980 1981 1983 1984 1986 1988 1989 1991
Fig. 6. “Reduced” graphs of anomalous.
of their attribution to large earthquakes. Figure 6 represents the so called “reduced” graph which was obtained after tak-ing into consideration margins of the zone. The pattern re-flects anomalous increase in the number of relatively small earthquakes occurred in Javakheti Highland as a precursor of each large earthquake.
As we did not take into consideration earthquakes of Javakheti Highland occurred before 1961 due to inferior re-sults of computations that can be attributed to peculiarities of the method (lack of the read off points is implied), we have neglected large earthquakes only of 1961 and 1992 (just 2 events). For all the other 14 large earthquakes of the Cauca-sus the regularity is observed.
Figure 6 illustrates good quantitative coincidence of anomalous picks with the number of earthquakes with one exception: the large earthquake occurred in 1978 was pre-ceded by two anomalous picks.
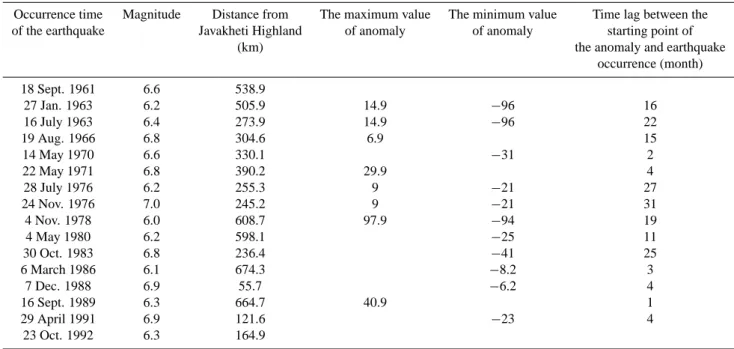
Table 3 was compiled as a result of the critical analysis of Fig. 6. The table helped us to establish the minimal size of the anomaly the numeral value increase of which shows us the possibilities of an occurrence of large earthquake. The minimal size of the anomaly was found to equal |6.2|. Max-imum and minMax-imum time lags from the starting point of the anomaly till earthquake occurrence are 31 months and 1 month, respectively.
4 Conclusion
We should state that all the large earthquakes (M ≥ 6.0) which occurred in the Caucasus within the period from 1961 till 1992 were preceded by anomalous change in the number of relatively small earthquakes (2.5 ≤ M < 6.0) of Javakheti
170 M. Kachakhidze et al.: Relatively small earthquakes of Javakheti Highland
Table 3. Estimate of anomalous
Occurrence time Magnitude Distance from The maximum value The minimum value Time lag between the of the earthquake Javakheti Highland of anomaly of anomaly starting point of
(km) the anomaly and earthquake
occurrence (month) 18 Sept. 1961 6.6 538.9 27 Jan. 1963 6.2 505.9 14.9 −96 16 16 July 1963 6.4 273.9 14.9 −96 22 19 Aug. 1966 6.8 304.6 6.9 15 14 May 1970 6.6 330.1 −31 2 22 May 1971 6.8 390.2 29.9 4 28 July 1976 6.2 255.3 9 −21 27 24 Nov. 1976 7.0 245.2 9 −21 31 4 Nov. 1978 6.0 608.7 97.9 −94 19 4 May 1980 6.2 598.1 −25 11 30 Oct. 1983 6.8 236.4 −41 25 6 March 1986 6.1 674.3 −8.2 3 7 Dec. 1988 6.9 55.7 −6.2 4 16 Sept. 1989 6.3 664.7 40.9 1 29 April 1991 6.9 121.6 −23 4 23 Oct. 1992 6.3 164.9
Highland. We consider this peculiarity as the marked precur-sor.
Getting results show that special seismoactivity of Javakheti Highland reflects the global process of preparing of large earthquakes throughout the whole Caucasus region.
References
Borisov, N., Chmyrev, V., and Rybachek, S.: A new ionospheric mechanism of electromagnetic ELF precursors to earthquakes, J. Atmos. Solar-Terr. Phys., 63, 1, 3–10, 1989.
Chadwick, W. W. Jr., Archuleta, R. J., and Swanson, D. A.: The mechanics of ground deformation precursory to dome-building extrusions at Mount St. Helens 1981–1982, J. Geophys. Res., 93, 4351–4366, 1988.
Dea, J. Y., Richman, C. I., and Boerner, W.-M.: Observations of seismo-electromagnetic earthquake precursor radiation signa-tures along Southern California fault zones – Evidence of long-distance precursor ultra-low frequency signals observed before a moderate Southern California earthquake episode, Canadian J. Phys., 69, 1138–1145, 1991.
Duff, R. E. and Peterson, F. I.: Shock precursor observations, Pre-cursor transition in dynamical systems undergoing period dou-bling, J. App. Phys., 51, 7, 3957–3959, 1980.
Gotsadze, O. and Pilishvili, T.: Regime of realization of seismic en-ergy on Caucasus and in the epicenter zones of some large earth-quakes. Identification of geophysical precursors of earthquakes in the Caucasus, Publishing House “Metsniereba”, Tbilisi, 54, 15–27, 1987.
Handbook of Geophysicist, Moscow, “Nedra”, 6, 469, 1990. Hayakawa, M., Kopytenko, Y., Smirnova, N., Troyan, V., and
Peter-son, T. H.: Monitoring ULF magnetic disturbances, and schemes for recognizing earthquake precursors, Phys. Chem. Earth A, 25, 3, 263–269, 2000.
Keilis-Borok, V. I., Knopoff, L., Rotvain, I. M., and Sidorenko, T. M.: Bursts of seismicity as long-term precursors of strong earth-quakes, J. Geophys. Res., 85, B2, 803–812, 1980.
Kuloshvili, S., Maisuradze, G., and Tsagareli, A.: Geological and geomorphologic studying and seismotectonics of the prognos-tic polygons, Earthquake Prognosis, Publishing House “Donish”, Dushanbe-Tbilisi, 335, 1989.
Kumar, K., Agarwal, A. K., Bhattacharjee, J. K., and Banerjee, K.: Precursor transition in dynamical systems undergoing period doubling, Physical Review, 35, 5, 2334–2336, 1987.
Papadopoulos, G. A., Drakatos, G., and Plessa, A.: Foreshock activ-ity as a precursor of strong earthquakes in Corinthos Gulf, Cen-tral Greece, Phys. Chem. Earth A, 25, 3, 239–245, 2000. Park, S. K., Johnston, M. J. S., Madden, T. R., Morgan, F. D., and
Morrison, H. F.: Electromagnetic precursors to earthquakes in the ulf band, Rev. Geophys., 31, 2, 117–132, 1993.
Rundle, J. B., Klein, W., Turcotte, D. L., and Malamud, B. D.: Pre-cursory Seismic Activation and Critical-point Phenomena, Pure and Applied Geophysics, 157, 2165–2182, 2000.
Shebalin, P., Girardin, N., Rotwain, I., Keilis-Borok, V., and Dubois, J.: Local overturn of active and non-active seismic zones as a precursor of large earthquakes in the Lesser Antillean Arc, Phys. Earth and Planet. Int., 97, 163–175, 1999.
Sorrells, G., Bonner, J., and Herrin, E. T.: Seismic Precursors to Space Shuttle Shock Fronts, Pure and Applied Geophysics, 159, 5, 1153–1181, 2002.
Tzanis, A., Valliantos, F., and Makropoulos, K.: Seismic and elec-trical precursors to the 17 January 1983, Phys. Chem. Earth A, 25, 3, 281–287, 2000.
Westaway, R.: Seasonal Seismicity of Northern California Before the Great 1906 Earthquake, Pure and Applied Geophysics, 159, 1–3, 7–62, 2002.