Publisher’s version / Version de l'éditeur:
NFPA Journal, 102, Jul/Aug. 4, pp. 62-64, 66-67, 2008-07-01
READ THESE TERMS AND CONDITIONS CAREFULLY BEFORE USING THIS WEBSITE.
https://nrc-publications.canada.ca/eng/copyright
Vous avez des questions? Nous pouvons vous aider. Pour communiquer directement avec un auteur, consultez la
première page de la revue dans laquelle son article a été publié afin de trouver ses coordonnées. Si vous n’arrivez pas à les repérer, communiquez avec nous à [email protected].
Questions? Contact the NRC Publications Archive team at
[email protected]. If you wish to email the authors directly, please see the first page of the publication for their contact information.
NRC Publications Archive
Archives des publications du CNRC
This publication could be one of several versions: author’s original, accepted manuscript or the publisher’s version. / La version de cette publication peut être l’une des suivantes : la version prépublication de l’auteur, la version acceptée du manuscrit ou la version de l’éditeur.
Access and use of this website and the material on it are subject to the Terms and Conditions set forth at Face off - tunnel fire detection systems
Liu, Z. G.; Kashef, A.; Crampton, G. P.; Lougheed, G. D.; Gottuk, D. T.; Almand, K. H.
https://publications-cnrc.canada.ca/fra/droits
L’accès à ce site Web et l’utilisation de son contenu sont assujettis aux conditions présentées dans le site LISEZ CES CONDITIONS ATTENTIVEMENT AVANT D’UTILISER CE SITE WEB.
NRC Publications Record / Notice d'Archives des publications de CNRC:
https://nrc-publications.canada.ca/eng/view/object/?id=9b6cbbd6-a145-48f4-9736-7acc9a465c6f https://publications-cnrc.canada.ca/fra/voir/objet/?id=9b6cbbd6-a145-48f4-9736-7acc9a465c6f
http://irc.nrc-cnrc.gc.ca
F a c e o f f – t u n n e l f i r e d e t e c t i o n s y s t e m s
N R C C - 5 0 5 5 8
L i u , Z . G . ; K a s h e f , A . ; C r a m p t o n , G . ; L o u g h e e d ,
G . ; G o t t u k , D . T . ; A l m a n d , K . H .
A version of this document is published in / Une version de ce document se trouve dans: NFPA Journal, v. 102, no. 4, July/August 2008, pp. 62-64, 66-67
The material in this document is covered by the provisions of the Copyright Act, by Canadian laws, policies, regulations and international agreements. Such provisions serve to identify the information source and, in specific instances, to prohibit reproduction of materials without written permission. For more information visit http://laws.justice.gc.ca/en/showtdm/cs/C-42
Les renseignements dans ce document sont protégés par la Loi sur le droit d'auteur, par les lois, les politiques et les règlements du Canada et des accords internationaux. Ces dispositions permettent d'identifier la source de l'information et, dans certains cas, d'interdire la copie de documents sans permission écrite. Pour obtenir de plus amples renseignements : http://lois.justice.gc.ca/fr/showtdm/cs/C-42
Fire Detection System Face-off in Tunnels
By Z. G. Liu, A. Kashef, G. Crampton and G. Lougheed, with Daniel T. Gottuk and Kathleen H. Almand
Fire detection systems play a crucial role in ensuring safe evacuation and firefighting operations in road tunnels, but information on the performance of these systems in tunnels has been limited. Recently, the Fire Protection Research Foundation completed a two-year international research project, with the support of private- and public sector organizations, to determine some of the strengths and weaknesses of the various types of detection systems and the factors that can affect their performance in tunnel environments. The study also evaluated false alarm rates and maintenance requirements in tunnel environments. Although this research was conducted on road tunnels, the findings should apply to other tunnels, such as those used in subway systems.
As part of the project, the National Research Council of Canada (NRC) conducted two series of tests in the Carleton University-NRC tunnel facility to investigate the performance of detection systems under minimal and longitudinal airflow conditions. In addition, NRC conducted tests in the Carré-Viger Tunnel in Montréal, as well as a computer modeling study. Hughes Associates conducted environmental and demonstration fire tests in the Lincoln Tunnel in New York City.
The project studied nine fire detection systems that covered five types of currently available technologies (see Table 1). The system suppliers installed all the fire detection systems in the laboratory tunnel facility, as well as the Carré-Viger and Lincoln Tunnels. The performance of the detection systems, including response times and ability to locate and monitor a fire in the tunnel and the effect of the tunnel environment, were evaluated under the same conditions.
Fire tests in the laboratory tunnel facility
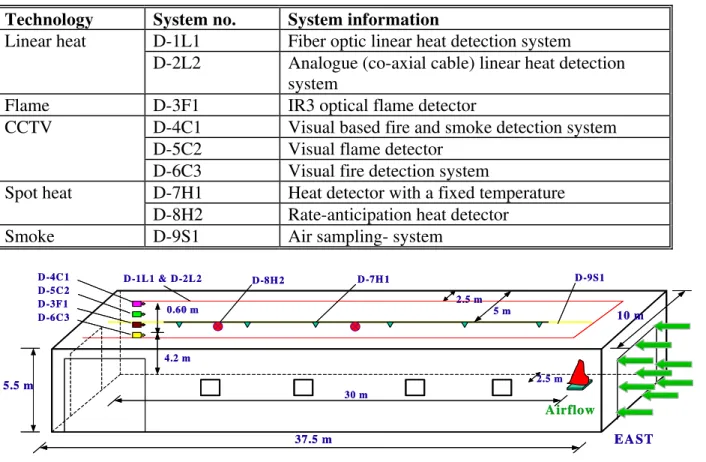
Two series of full-scale fire tests were conducted in the laboratory tunnel facility, which was 10 meters wide, 5.5 meters high, and 37 meters long. The first series of tests was conducted under no-ventilation conditions; airflow speed was kept as close as possible to zero. The second series was conducted under longitudinal airflow conditions by operating the facility fan system in exhaust mode to draw air through the tunnel in the east-west direction (see Figure 1). The airflow speeds in the test series were 0, 1.5, and 3 meters per second.
Three types of fire scenarios, involving various fire sizes, types, locations, and growth rates, were used in the laboratory tunnel: flammable pool fires, stationary passenger vehicle fires, and moving vehicle fires. The fire scenarios involved fire sizes from 125 to 3,500 kilowatts; fire growth rates from 1 to 12 minutes to maximum heat release rates; locations that included an open fire, fires beneath a vehicle, and fires behind a large vehicle; and various types of fuel, including gasoline, propane, wood crib, and foam. For the moving vehicle fire, different directions and speeds were considered. These fire scenarios were considered representative of the majority of tunnel fires that present a challenge to fire detection systems.
The fire conditions and smoke spread in the laboratory tunnel were monitored using 55 thermocouples at the tunnel ceiling, two thermocouple trees, three smoke meters, five heat flux meters, one velocity meter, and two video cameras.
the fire’s location, and the fire’s growth rate, as well as the detection method. Pool fires underneath the vehicle were challenging because the vehicle’s body contained the flames and heat the fire produced (see Figure 4). The vehicle’s body also limited the size of the fire when airflow in the tunnel was limited. In addition, the view of the flames from the front of the vehicle was partially obstructed by a simulated vehicle placed between the detectors and the fire source. Most of the detection systems found detecting a small fire underneath a vehicle difficult. With an increase in the size of the fire, however, more detectors responded and their detection times decreased.
The pool fire located behind a large vehicle was a challenge for the detectors that detected fires based on flame characteristics, because the vehicle obstructed the view of the flames. However, the large vehicle in front of the fire did not affect the burning process, the temperature development, or smoke spread in the tunnel. More detection systems were able to detect fires behind a vehicle with shorter response times than fires located under a vehicle (see Figure 5).
The response of fire detection systems to the stationary vehicle fires in the engine and passenger compartments was slow because these fires developed very slowly, and the flame, heat, and smoke they produced were limited during the initial few minutes after ignition. The fire detection systems also found detecting a small moving fire difficult, since there was no change in the temperature or smoke density in the tunnel. The optical flame detector detected the moving fire at 17 miles (27 kilometers) per hour, but not at the speed of 31 miles (50 kilometers) per hour. No other fire detector or detection system responded to the moving fires.
The results of tests under longitudinal airflow conditions showed that the fire detection systems’ response times could be increased or decreased, depending on the fire scenario, airflow speeds, and detection method (see Figure 6). The response times of heat and smoke detection systems were generally shorter than those under low airflow conditions, as the airflow increased the burning rate of the pool fire. For the optical flame and video image detection (VID) detectors, there was no systematic change in response time.
The response times of heat detection systems to pool fires behind a large vehicle generally increased as the temperatures in the tunnel were affected by the airflow. Figure 7 shows a slight decrease in the response time of the smoke detection system. The response time for the optical flame detector and VID fire detectors generally increased with an increase in airflow speed. In Figure 6 and Figure 7, the “no response” phrase indicates that the test was terminated before the detection systems detected the fire.
The Carré-Viger Tunnel tests
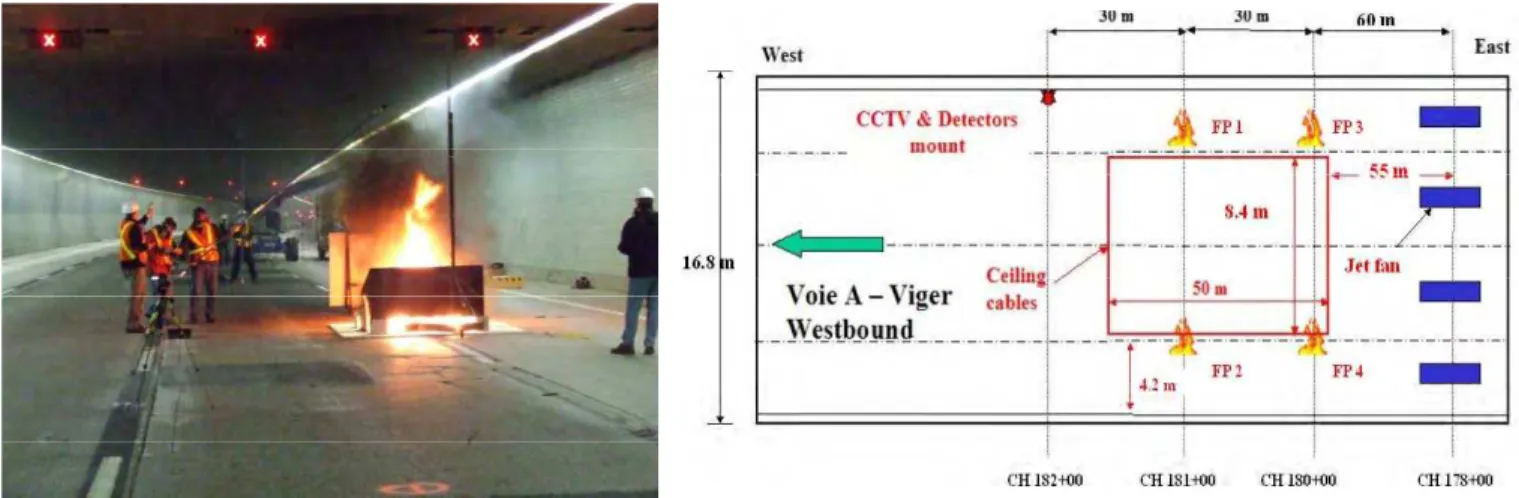
This series of full-scale fire tests was conducted in the Carré-Viger Tunnel in collaboration with the Ministry of Transportation of Quebec (see Figure 8) to investigate the performance of fire detection systems in a real tunnel environment and at their maximum detection distance. The four-lane test section was 1,968.5 feet (600 meters) long, 16 feet (5 meters) high, and 56 feet (17 meters) wide, and the tunnel was equipped with four jet fans.
Six detection systems that were used in the laboratory tunnel tests were also installed in the Carré-Viger Tunnel, including two linear heat detection systems, one optical flame detector, and three VID systems (see Figure 9). The fire scenarios, selected from those used in the laboratory tunnel tests, included small open pool fires of approximately 125 kilowatts, a pool fire of approximately 625 kilowatts underneath a simulated vehicle, and a pool fire behind a simulated vehicle. The fire source was placed at different locations in the tunnel. Four longitudinal airflow speeds were used: 0, 4, 7, and
8 feet per second (0, 1.3, 2, and 2.4 meters per second). Instrumentation included thermocouples, smoke meters, velocity meters, and video cameras.
General observations on the performance of the fire detection systems in the Carré-Viger Tunnel tests indicated that the systems worked well in an operating tunnel. Their performances were consistent with those determined in the laboratory tunnel tests under the same test conditions.
The response times for the detection systems are shown in Figure 10. One of the linear heat detection systems responded to small fires, based on the rate of rise of temperature, while the other detected only fires located at two positions. The optical flame detector detected small fires in its detection range of approximately 98 feet (30 meters). The three VID detectors detected the small fires at their maximum detection range of 197 feet (60 meters).
Comparing laboratory and field experiment test data
NRC researchers performed computational fluid dynamics (CFD) simulations, using the fire dynamic simulator (FDS) CFD model, to compare numerical predictions against selected experimental data from the laboratory and field experiments. The initial and boundary conditions of each simulation were set to mimic the conditions of the corresponding test. Researchers compared temperature and smoke optical densities measurements, then conducted further CFD simulations to determine the impact of various fire scenarios, ventilation modes, and tunnel lengths on fire behavior and detection system performance. Information from the model can be used to develop appropriate test protocols and to understand and optimize the performance of fire detection systems for road tunnel protection.
Figure 11 shows the comparisons of ceiling temperatures for the simulation of a 3- by 6.5-foot (1- by 2-meter) pool fire under a vehicle for a test in the laboratory tunnel without longitudinal airflow. The comparisons of ceiling temperatures were, in general, favorable. Although the numerical predictions fluctuated with rather large amplitudes, especially at locations close to the fire, the experimental results did not exhibit the same fluctuations. This can be attributed to the fact that the frequency of data collection was coarser than that used for the numerical predictions and the plume shape was not perfectly replicated by the numerical procedure.
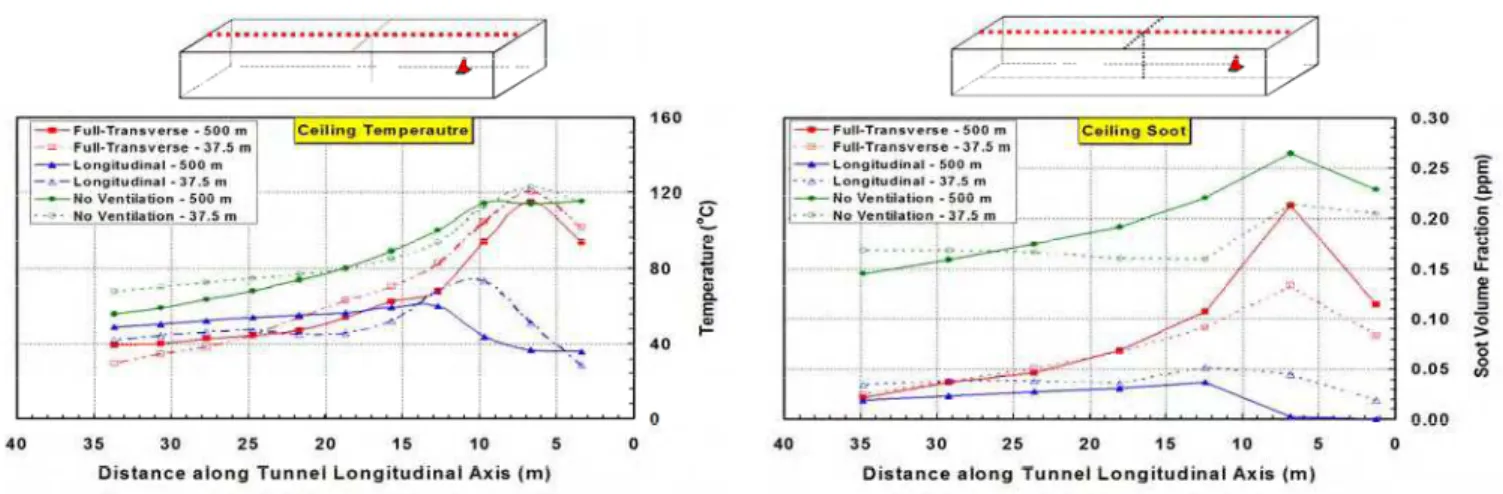
Researchers also conducted CFD simulations to determine the impact of various parameters, such as fire scenario, ventilation mode, and tunnel length, on fire behavior and detection system performance. Four ventilation conditions were studied: no ventilation, longitudinal ventilation, fully transverse ventilation, and semi-transverse ventilation. Tunnels 123 feet (37.5 meters) long, which is similar to the length of the laboratory facility, and 1,640 feet (500 meters) long were simulated. The two tunnels were 18 feet (5.5 meters) high and 33 feet (10 meters) and 39 feet (12 meters) wide, respectively.
Both temperature and soot profiles were similar for the two lengths (see Figure 12). Thus, the CFD simulations predict that the length of the tunnel has no significant effect on the ceiling temperature or smoke accumulation over the modeled length.
Environmental and demonstration fire tests in the Lincoln Tunnel
With support from the Port Authority of New York and New Jersey, four detection systems representing three fire detection technologies were installed in the south tube of the Lincoln Tunnel. These systems were monitored over the course of 10 months to evaluate their performance, particularly as it concerned maintenance and nuisance alarms. In addition to long-term monitoring, researchers conducted fire demonstrations in the tunnel to document the response of the detection systems when exposed to a set of controlled test fires.
The three types of fire detection technologies evaluated were VID for flame and smoke, optical flame detection (OFD), and air sampling detection (ASD) for smoke, represented by four specific detection systems (see Table 2). All the systems were monitored by the Lincoln Tunnel Supervisory Control and Data Acquisition (SCADA) system.
To evaluate the fire detection capabilities of the installed systems, the Port Authority conducted a set of fires that were typically used for annual mutual-aid drills with local fire departments in New Jersey and New York. The simulated vehicle fire consisted of burning diesel fuel inside a gutted van from which all the windows had been removed. The fuel was ignited with gasoline and burned in two vertical halves of a 55-gallon (208 liter) drum that were laid in the back of the van. The fire, whose size was estimated at 1 to 2 megawatts, produced large quantities of black smoke, but flames were visible at the detector locations through the broken windows. The back of the van was facing the detectors, and the back window measured 5 square feet (0.44 square meters). As the fire grew, flames spread out of the open side windows. All the fires were extinguished 5 minutes after they were ignited.
Researchers conducted five fire tests. Because of the limited field of view outside the burning vehicle and the concealed nature of the fire, this fire scenario presented a challenge to all the detection systems. The ASD systems performed best.
The four detection systems in the Lincoln Tunnel were monitored for false alarm propensity over 10 months. During this time, the tunnel was exposed to outside temperatures ranging from 10°F (-12°C) to 92°F (33°C). There was 1 inch (2.5 cm) of snow and 8 inches (19 centimeters) of rain. Besides the weather, the detectors were also exposed to high soot and dirt levels from the traffic and to overspray when the tunnel walls and ceiling were periodically washed with a water and soap solution.
The severe environments in the Lincoln Tunnel were a challenge for many of the systems. However, the flame VID system experienced no nuisance alarms, and the ASD system had only two alarms. Keeping optical windows clean was a substantial problem that caused faults with both the flame detectors and the smoke and flame VID system. For the smoke and flame VID system, false alarms were primarily due to flashing lights on service vehicles or weather conditions that fouled the camera window or caused fog and headlights to trip the system. The reflection of sunlight into the tunnel entrance was also a significant cause of nuisance alarms, as was the general dirt and grime in the tunnel.
Summary Results
In general, roadway tunnels are challenging environments for fire detection systems, both in terms of the detection challenge and the environmental conditions under which these systems must operate. All six types of detection technologies investigated in the study are viable for the tunnel application. As described above, each has strengths and weaknesses for specific fire scenarios.
The research program has provided valuable information to detection system manufacturers which will lead to further improvements in technology. In the meantime, tunnel specialists can use the information from this study in determining the most appropriate technology for their application. The NFPA Technical Committee responsible for Standard 502 NAME of STANDARD, will be considering this information in the further development of the standard.
Z. G. Liu, A. Kashef, G. Crampton and G. Lougheed, are with the National Research Council of Canada. Daniel T. Gottuk is with Hughes Associates, Inc. Kathleen H. Almand is the executive director of the NFPA's Fire Protection Research Foundation.
Table 1. Fire Detectors/Detection Systems in the Project
Technology System no. System information
D-1L1 Fiber optic linear heat detection system Linear heat
D-2L2 Analogue (co-axial cable) linear heat detection system
Flame D-3F1 IR3 optical flame detector
D-4C1 Visual based fire and smoke detection system D-5C2 Visual flame detector
CCTV
D-6C3 Visual fire detection system
D-7H1 Heat detector with a fixed temperature Spot heat
D-8H2 Rate-anticipation heat detector Smoke D-9S1 Air sampling- system
D-1L1 & D-2L2 D-9S1 D-4C1 D-5C2 D-6C3 D-3F1 4.2 m 5 m 2.5 m 10 m 5.5 m 37.5 m 30 m EAST D-7H 1 D-8H 2 2.5 m 0.60 m Airflow D-1L1 & D-2L2 D-9S1 D-4C1 D-5C2 D-6C3 D-3F1 4.2 m 5 m 2.5 m 10 m 5.5 m 37.5 m 30 m EAST D-7H 1 D-8H 2 2.5 m 0.60 m Airflow
Figure 1. Schematic of the laboratory tunnel and detection system set-up
Figure 2. Photograph of a pool fire located underneath the vehicle
Figure 3. Photograph of a simulated passenger compartment fire
Pool Pan Size (m2) 0.0 0.5 1.0 1.5 2.0 2.5 D e tec ti n g Ti me ( s ) 0 50 100 150 200 250 Linear system D-1L1 Linear system D-2L2 Flame detector D-3F1 CCTV detector D-4C1 CCTV detector D-6C3 Spot detector D-7H1 Spot detector D-8H2 Smoke system D-9S1 Detection systems
Pool Pan Size (m2)
0.0 0.5 1.0 1.5 2.0 2.5 Detec ting Time (s ) 0 20 40 60 80 100 120 140 Linear system D-1L1 Linear system D-2L2 Flame detector D-3F1 CCTV detector D-4F1 Spot detector D-7H1 Spot detector D-8H2 Smoke system D-9S1
Figure 4. Response times – pool fires underneath vehicle
Figure 5. Response times – pool fires behind vehicle
Figure 6. Detecting times – 2 m2 gasoline pool
fire underneath vehicle le
Figure 7. Detecting times – 2 m2 gasoline pool fire behind vehic
Figure 8. Photograph of fire test in Carré-Viger tunnel
Figure 9. Field fire tests in Viger Tunnel
Det ecti ng T im e (s ) 0 5 0 1 0 0 1 5 0 2 0 0 2 5 0 0 m /s * (d a ta fro m T a s k 2 ) 1 .5 m /s 3 m /s D -1 L 1 D - 2 L 2 D -3 F 1 D - 4 C 1 D -6 C 3 D -7 H 1 D -8 H 2 D - 9 S 1 D e te c to rs /D e te c tio n S y s te m s D - 5 C 2 n o re s p o n s e D e tec ti n g Ti m e ( s ) 0 5 0 1 0 0 1 5 0 2 0 0 0 m /s (d a ta fro m T a s k 2 ) 1 .5 m /s 3 m /s D -1 L 1 D -2 L 2 D -3 F 1 D -4 C 1 D -6 C 3 D -7 H 1 D -8 H 2 D -9 S 1 D e te c to rs /D e te c tio n S y s te m s D -5 C 2 n o re s p o n s e
Det e ct ing T im e (s ) 0 5 0 1 0 0 1 5 0 2 0 0 F P 1 F P 2 F P 3 F P 4 D -1 L 1 D -2 L 2 D -3 F 1 D -4 C 1 D -6 C 3 D ete cto rs/D e te ction S yste m s
D -5 C 2 n o re sp o n se
F ire p o sitio n
Figure 10. Response times – 0.02 m2 open fire
Figure 11. Temperature comparisons – 1.0x2.0 gasoline pool fire under vehicle