Publisher’s version / Version de l'éditeur:
Vous avez des questions? Nous pouvons vous aider. Pour communiquer directement avec un auteur, consultez la première page de la revue dans laquelle son article a été publié afin de trouver ses coordonnées. Si vous n’arrivez pas à les repérer, communiquez avec nous à [email protected].
Questions? Contact the NRC Publications Archive team at
[email protected]. If you wish to email the authors directly, please see the first page of the publication for their contact information.
https://publications-cnrc.canada.ca/fra/droits
L’accès à ce site Web et l’utilisation de son contenu sont assujettis aux conditions présentées dans le site LISEZ CES CONDITIONS ATTENTIVEMENT AVANT D’UTILISER CE SITE WEB.
Proceedings of the 2007 IEEE International Joint Conference on Neural Networks
(IJCNN 2007), 2007
READ THESE TERMS AND CONDITIONS CAREFULLY BEFORE USING THIS WEBSITE. https://nrc-publications.canada.ca/eng/copyright
NRC Publications Archive Record / Notice des Archives des publications du CNRC :
https://nrc-publications.canada.ca/eng/view/object/?id=2e465af5-6805-43bc-b9c5-20e4f32a17be
https://publications-cnrc.canada.ca/fra/voir/objet/?id=2e465af5-6805-43bc-b9c5-20e4f32a17be
NRC Publications Archive
Archives des publications du CNRC
This publication could be one of several versions: author’s original, accepted manuscript or the publisher’s version. / La version de cette publication peut être l’une des suivantes : la version prépublication de l’auteur, la version acceptée du manuscrit ou la version de l’éditeur.
Access and use of this website and the material on it are subject to the Terms and Conditions set forth at
Data and knowledge visualization with virtual reality spaces, neural
networks and rough sets: application to geophysical prospecting
Data and Knowledge Visualization with
Virtual Reality Spaces, Neural Networks and
Rough Sets: Application to Geophysical
Prospecting *
Valdés, J., Romero, E., and Gonzalez, R.
August 12-17, 2007
* Proceedings: 2007 IEEE International Joint Conference on Neural Networks. Orlando, Florida, USA. August 12-17, 2007. NRC 49297.
Copyright 2007 by
National Research Council of Canada
Permission is granted to quote short excerpts and to reproduce figures and tables from this report, provided that the source of such material is fully acknowledged.
Data and Knowledge Visualization with Virtual Reality Spaces,
Neural Networks and Rough Sets: Application to Geophysical
Prospecting
Julio J. Vald´es, Enrique Romero and Ruben Gonz´alez
Abstract— Visual data mining with virtual reality spaces are used for the representation of data and symbolic knowledge. The approach is illustrated with data from a geophysical prospecting case in which partially defined fuzzy classes are present. In order to understand the structure of both the data and knowledge extracted in the form of production rules, structure-preserving and maximally discriminative vir-tual spaces are constructed. High quality visual representations can be obtained using Samman and Nonlinear Discriminant neural networks. Rough set techniques are used for demonstrat-ing the irreducibility of the set of original attributes and for learning the symbolic knowledge. Grid computing techniques are used for constructing sets of virtual reality spaces and for assessing the behavior of some of the neural network parameters controlling the quality of the virtual worlds. The general properties of the symbolic knowledge can be found with greater ease in the virtual reality space whereas both the prediction of unknown objects to the target class, as well as a derivation of a fuzzy membership function from the virtual reality space and the neural network results are obtained.
I. INTRODUCTION
Knowledge discovery is the non-trivial process of iden-tifying valid, novel, potentially useful, and ultimately
un-derstandable patterns in data [4], and the role of visual-ization techniques in the knowledge discovery process is well known. There are different kinds of data (relational, graphical, symbolic, etc.), and there are also patterns of different kinds (geometrical, logical, behavioral, etc.). The increasing rates of data generation require the development of procedures facilitating the understanding of the internal structure of data more rapidly and intuitively. The increasing complexity of the data analysis procedures makes it more difficult for the user, to extract useful information out of the results from the various techniques applied. However, the human brain still outperforms the computer in understand-ing complex geometric patterns, thus makunderstand-ing the graphical representation of complex and abstract information directly appealing. A virtual reality (VR) technique for visual data mining on heterogeneous, imprecise and incomplete infor-mation systems was introduced in [14], [16]. Several reasons
Julio J. Vald´es is with the National Research Council Canada, Institute for Information Technology. M50 1200 Montreal Rd, Ottawa, ON K1A 0R6, Canada (email: [email protected])
Enrique Romero is with the Department of Languages and Information Systems, Polytechnic University of Catalonia, c/ Jordi Girona, 1-3, 08034 Barcelona, Spain (email: [email protected])
Ruben Gonz´alez is with the Faculty of Computer Science, Polytechnic University of Catalonia, c/ Jordi Girona, 1-3, 08034 Barcelona, Spain (email: [email protected])
make VR a suitable paradigm for visual data mining: dif-ferent representation models according to human perception preferences can be chosen, it allows immersion, it creates a living experience, and the user may see the world as a whole or concentrate on specific details. For using VR the user needs no mathematical knowledge and no special skills. The purpose of this paper is to explore the construction of high quality VR spaces for visual data mining using a combination of neural networks and rough sets techniques with the purpose of representing both data and symbolic knowledge. In particular, the Samman and Nonlinear Dis-criminant (NDA) networks are used for unsupervised and su-pervised mapping to low-dimensional feature spaces. Rough sets methods are applied for evaluating the information content of the original descriptor variables and for the extraction of symbolic rules from the data. Both the data and the symbolic knowledge are transformed into corresponding virtual reality spaces where their structure and properties can be visually inspected and quickly understood. This approach is illustrated with a case of geophysical prospecting for underground caves involving partially defined fuzzy classes. Since the classes are partially defined, a combination of unsupervised and supervised approaches is required.
II. VIRTUALREALITYSPACES FORVISUALDATA
MINING
Information systems were introduced in [10]. They have the form S = hU, Ai where U is the universe and A the set of attributes, such that each a ∈ A has a domain Va and
an evaluation functionfa. In general theVa are not required
to be finite. More generally, heterogeneous and incomplete information systems should be considered [15].
A virtual reality space for the visual representation of information systems [14], [16], is defined as Υ = hO, G, B, ℜm, g
o, l, gr, b, ri. O is a relational structure
com-posed by objects and relations (O = hO, Γvi , Γv =
hγv
1, . . . , γqvi, q ∈ N+ and the o ∈ O are objects), G is
a non-empty set of geometries representing the different objects and relations. B is a non-empty set of behaviors (i.e. ways in which the objects from the virtual world will express themselves: movement, response to stimulus, etc. ). ℜm ⊂ Rm is a metric space of dimension m (the actual
virtual reality geometric space). The other elements are mappings: go : O → G, l : O → ℜm, gr : Γv → G,
b : O → B, r is a collection of characteristic functions for selecting which of the original relations will be represented
in the virtual world. The representation of an information system ˆS in a virtual world requires the specification of several sets and a collection of extra mappings: ˆSv =
hO, Av, Γvi, O in Υ, which can be done in many ways. A
desideratum for ˆSv is to keep as many properties from ˆS
as possible. Thus, a requirement is that U and O are in one-to-one correspondence (with a mapping ξ : U → O). The structural link is given by a mapping f : ˆHn → ℜm.
If u = hfa1(u), . . . , fan(u)i and ξ(u) = o, then l(o) =
f (ξ(hfa1(u), . . . , fan(u)i)) = hfa1v(o), . . . , favm(o)i (favi are
the evaluation functions ofAv).
III. NEURALNETWORKS IN THECONSTRUCTION OF THEVIRTUALREALITYSPACE
The typical desiderata for the visual representation of data and knowledge can be formulated in terms of mini-mizing information loss, maximini-mizing structure preservation, maximizing class separability, or their combination, which leads to single or multi-objective optimization problems. In many cases, these concepts can be expressed deterministi-cally using continuous functions with well defined partial derivatives. This is the realm of classical optimization where there is a plethora of methods with well known properties. In the case of heterogeneous information the situation is more complex and other techniques are required. Hybrid approaches combining evolutionary computation methods, simulated annealing, neural networks and classical optimiza-tion techniques like Powell, Fletcher-Reeves and others, are described elsewhere [17] [18].
In the unsupervised case it is natural to require that Γv ⊆ Γ, thus having a virtual world portraying selected
relations from the information system. The functionf can be constructed as to maximize some metric/non-metric structure preservation criteria as is typical in multidimensional scaling [3], or minimize some error measure of information loss [12], [9]. A typical error measure is:
Sammonerror = P 1 i<jδij P i<j (δij−ζij)2 δij (1)
whereδijis a dissimilarity measure between any two objects
i, j in the original space, and ζivjv is another dissimilarity
measure defined on objectsiv, jv of the virtual reality space
(the images of i, j under f ). In principle, the f mappings obtained using approaches of this kind are implicit because the images of the objects in the new space are computed directly. However, a functional representation can be obtained with a neural network (e.g. the Samman network). This is a feedforward network and its architecture consists of an input layer with as many neurons as descriptor attributes, an output layer with as many neurons as the dimension of the target space and one or more hidden layers. In the supervised case, a natural choice for representing thef mapping is an NDA neural network [19], [8], [9], [7]. The NDA network is also feedforward with the same input layer, but with an output layer with as many neurons as classes contain the decision attribute, a last hidden layer (there might be several) with
a number of neurons equal to the dimension of the target space and optionally other hidden layers. The classical way of training these networks is described in [9], [8], [7].
IV. SYMBOLICKNOWLEDGE VIAROUGHSETS
The Rough Set Theory [10] bears on the assumption that in order to define a set, some knowledge about the elements of the data set is needed, in contrast to the classical approach where a set is uniquely defined by its elements. In the Rough Set Theory, some elements may be indiscernible from the point of view of the available information and knowledge is understood to be the ability of characterizing all classes of the classification.
A decision table is any information system of the form S= hU, Ai where A = A′∪ {d}, A′ are the condition attributes
andd is the decision attribute. The lower approximation of a concept consists of all objects, which surely belong to the concept, whereas the upper approximation consists of all objects, which possibly belong to the concept. For anyB ⊆ A an equivalence relation IN D(B) defined as IN D(B) = {(x, x′) ∈ U2|∀a ∈ B, f
a(x) = fa(x
′
)}, is associated. A reduct is a minimal set of attributes B ⊆ A such that IN D(B) = IN D(A) (i.e. a minimal attribute subset that preserves the partitioning of the universe). The set of all reducts of an information system S is denoted RED(A) (reduct computation is NP-hard, and several heuristics have been proposed [20]). Reduction of knowledge consists of removing superfluous partitions such that the set of ele-mentary categories in the information system is preserved, in particular, w.r.t. those categories induced by the decision attribute. In particular, minimum reducts (those with a small number of attributes), are extremely important, as decision rules can be constructed from them [2]. The algorithms for computing reducts and rules used in this paper are those of the Rosetta system [11].
V. GRID ANDDISTRIBUTEDCOMPUTING
Distributed and Grid computing (DGC) involves coor-dinating and sharing computing, application, data, storage, or network resources across dynamic and geographically dispersed organizations. The use of grid technologies is an obvious choice for many data mining tasks within the knowledge discovery process. In this paper DGC was used for exploring the behavior of the samman and nda neural networks with respect to variations in some of the controlling parameters, thus enabling the discovery of best-behaving models.
Condor (http://www.cs.wisc.edu/condor/) is a specialized workload management system for compute-intensive jobs in a distributed computing environment, de-veloped at the University of Wisconsin-Madison (UW-Madison). It provides a job queuing mechanism, scheduling policy, priority scheme, resource monitoring, and resource management. All of the experiments in this paper were conducted on two Condor pools located at the Institute for Information Technology, National Research Council Canada and the Polytechnic University of Catalonia, respectively.
VI. A CASE INGEOPHYSICALPROSPECTING
Cave detection is a very important problem in civil and geological engineering. Sometimes the caves are opened to the surface, but typically they are buried and geophysical methods are required for detecting them. The task is usually complex. The studied area contained an accessible cave and geophysical methods complemented with a topographic survey were used with the purpose of finding their relation with subsurface phenomena [13]. This is a problem with
partially defined classes: the existence of a cave beneath a measurement station is either known for sure or unknown (i.e. only one class membership is really defined).
The set of geophysical methods included 1) the sponta-neous electric potential (SPdry) at the earth’s surface in the
dry season, 2) the vertical component of the electro- magnetic field in the VLF region of the spectrum, 3) the spontaneous electric potential in the rainy season (SPdry), 4) the gamma
ray intensity (Rad) and 5) the local topography (Alt). The raw data consist of these5 fields (the attributes) on a spatial grid containing1225 measurement stations (the data objects). In order to eliminate the data distortion introduced by the different units of measure and to reduce the influence of noise and regional geological structures, a data preprocessing pro-cess was performed consisting of: i) conversion of each phys-ical field to standard scores. ii) model each physphys-ical fieldf as composed of a trend, a signal and additive noise: f (x, y) = t(x, y) + s(x, y) + n(x, y) where t is the trend, s is the signal, and n is the noise component. iii) fit a least squares 2-D linear trend ˆt(x, y) = c0+ c1x + c2y and obtain the
residual:ˆr(x, y) = f (x, y)−ˆt(x, y). iv) convolve the residual with a low pass 2-D filter to attenuate the noise component: ˆ
s(x, y) = PNk
1=−N
PN
k2=−Nh(k1, k2)ˆr(x − k1, y − k2),
where ˆs(x, y) is the signal approximation, and h(k1, k2) is
the low-pass zero-phase shift digital filter. v) recompute the standard scores and add a class attribute indicating whether there is a known cave below the corresponding measurement station or if its presence is unknown. The pre-processed data set will be called prp-data. This is not the typical two-classes presence/absence problem because only one class is known with certainty. Since the classes are partially defined, a combination of unsupervised and supervised approaches is required.
VII. RESULTS
The prp-data set was discretized using the boolean rea-soning algorithm and the reducts were found by Johnson’s algorithm [11]. A single reduct was found, consisting of all of the 5 original variables, proving that no proper subset of these variables exactly preserves the discernibility relation of the original data. That is, no lower dimensional space based on the power set of the original variables is discernibility-preserving. Thus, lower dimensional spaces based on non-linear combinations are to be sought. A collection of exper-iments was conducted on a Condor distributed computing environment in order to asses the effect of some of the neural network controlling parameters and to select adequate
models for the visualization. The activation functions used were sinusoidal for the first hidden layer and hyperbolic tangent for the rest. The error measures that the network learning targeted were mean squared error and classification rate for the NDA network and Sammon error for the Samman network. A collection of models was obtained by varying some of the network controlling parameters (Table I), for a total of1260 for the NDA and 324 for the Samman networks respectively.
A. Spaces maximizing structure preservation
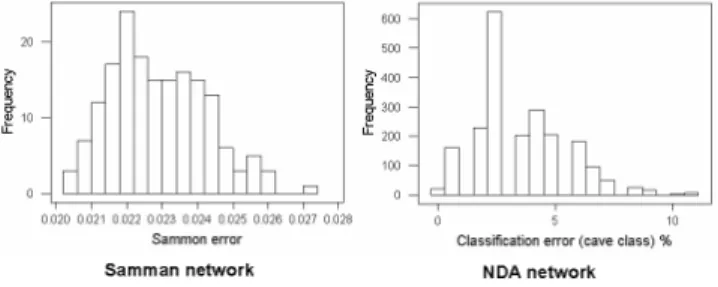
From an unsupervised perspective, a Samman network was used mapping the original prp-data 5-dimensional space to a 3-D VR-space. The distribution of the Sammon error is shown in Figure1. It is skewed towards the smaller errors
Fig. 1. Left: Distribution of the Samman stress (324 experiments) using Samman networks. Right: Distribution of the classification error of the cave class (1260 experiments) using NDA networks.
end (good behavior), with a mean of0.0229 and a standard deviation of 0.00133 indicating that error values fluctuate within a narrow range.
Clearly, it is impossible to represent a virtual reality space on printed media (navigation, interaction, and world changes are all lost). Therefore, only snapshots can be presented. For simplicity, in all of the VR-spaces presented G = {dark spheres, light spheres}, B = {static} and the l function is based on the representation of f given by a Samman network. r is a single characteristic function for the relationC with the equivalent classes {cave, unknown} such that objects of the cave class will be represented as dark spheres and those of the unknown class by light ones.
As an illustration, the VR-space corresponding to experi-ment135 is shown in Figure 2. The low value of the Sammon error indicates that the space preserved most of the distance structure of the data, therefore, giving a good idea about the distribution in the original space. The space is clearly polarized with two distribution modes: one at the left hand side composed exclusively of cave objects, and another at the right hand side composed only of unknown objects. Since the distance between any two objects is an indication of their dissimilarity, objects of the unknown class closer to objects of the cave class are more likely to correspond to measurement stations having underground cavities than objects further away. In particular, those objects of the unknown class contained within the convex hull defined by the objects of the cave class are very interesting. It is also
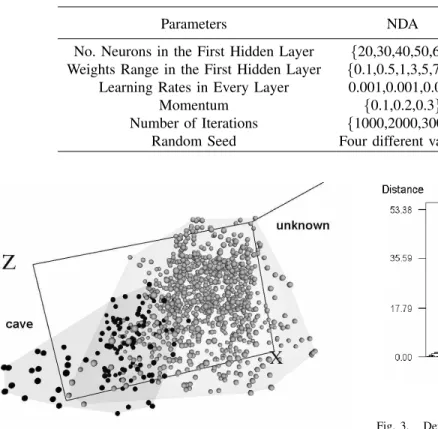
TABLE I
PARAMETERS USED FOR THENDAANDSAMMAN NETWORKS.
Parameters NDA Samman
No. Neurons in the First Hidden Layer {20,30,40,50,60} {20,30,40} Weights Range in the First Hidden Layer {0.1,0.5,1,3,5,7,9} {15,10,5}
Learning Rates in Every Layer 0.001,0.001,0.001 {(3.0,1.5),(2.0,1.0),(1.0,0.5)} Momentum {0.1,0.2,0.3} {0.0,0.1,0.2} Number of Iterations {1000,2000,3000} 200
Random Seed Four different values Four different values
Fig. 2. VR-space of the prp-data set corresponding to experiment135 (Sammon error =0.0208). Objects of the cave class are dark. Objects of the unknown class are light (this is for comparison purposes only, since the mapping generating the space is unsupervised). Transparent membranes wrap the corresponding classes.
evident that only a smaller proportion of the objects of the unknown class are either contained, or close to the convex hull of the cave class, as expected from the typical lognormal-like distribution of many geological features.
A hierarchical clustering using Euclidean distance and Ward’s method [1] (Figure 3) clearly reveal the existence of two well defined clusters. Their nature is explained by the 2x2 contingency table defined by the membership with respect to the cave/unknown classes vs. those corresponding to the two clusters emerging from the dendrogram. The table has a highly significantχ2 value (165.872), indicating
the high degree of association between the existing classes (specially the cave class) and the formed clusters. Cluster 2 corresponds to the cave class containing120 of the 121 cave objects and419 unknown objects (likely candidates to belong to the cave class). Clearly, those in cluster 1 correspond to locations less likely to have underground cavities beneath.
Cluster 1 Cluster 2 T otal unknown 685 419 1104
cave 1 120 121
1) Visualization of Symbolic Knowledge : As explained in section IV, symbolic knowledge in the form of production rules was extracted from the prp-data set using rough set
Fig. 3. Dendrogram of the objects in the VR-space of Figure 2 (Ward’s method using Euclidean distance).
techniques. Structure preserving VR-spaces representing an information system with rules as objects can be constructed by minimizing Sammon’s error (1). In this case the dissim-ilarity measure used for the original attributes was δij =
(1 − ˆsij)/ˆsij, where ˆsij is Gower’s similarity coefficient
[5]. The Euclidean distance was the measure used for ζij
in the VR space. A set of 345 rules were generated and two representative examples including the number of objects covered are:
SPdry([−0.16981, ∗)) & V LF ([−0.75462, ∗)) &
SPrain([0.48744, ∗)) & Rad([−0.21015, ∗)) &
Alt([0.00346, ∗)) =⇒ class = unknown (123 objects) SPdry([∗, −1.50209)) & V LF ([∗, −1.14882)) &
SPrain([∗, −0.46789)) & Rad([∗, −1.54413)) &
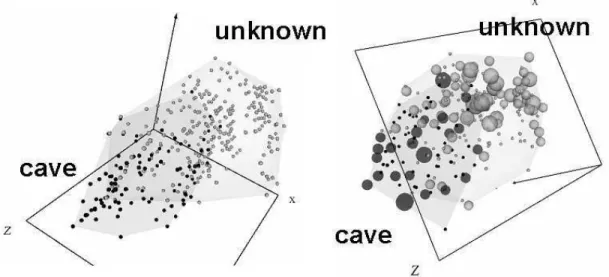
Alt([∗, −1.22398)) =⇒ class = cave (6 objects) The approach described in [14] [16] for the construction of VR-spaces representing symbolic knowledge in the form of production rules was applied and the corresponding space is shown in Figure 4 (Left). When compared with Figure 2 it is clear that the structures of the knowledge base and the data are very similar. An even clearer distribution is obtained if the rule base is pre-processed with the Leader clustering algorithm [6] in order to select representatives for subsets of similar rules and work with a smaller information system.
Such a space is shown in Figure 4 (Right) where the relative size of an object at a particular location in the
Fig. 4. Left: VR-space with a representation of the345 rules. Right: VR-space with the 231 most representative rules (sizes are proportional to the amount of similar rules at a given location). Dark objects: rules concluding about the cave class. Light objects: rules concluding about the unknown class.
VR-space is proportional to the number of similar rules within its neigborhood (therefore, of data concentration in the original feature space). This allows an easy identification of the most general rules from the more specific ones and also of knowledge granules. From the point of view of the distribution of the most important objects, the space is strongly polarized, allowing the identification of the rules describing the properties of the physical fields more accu-rately identifying the presence of underground caves and also the properties of the fields characterizing the areas most likely composed of solid rock. At the same time it allows the identification of the knowledge related with those objects of undetermined nature (i.e. from the undefined class).
B. Spaces maximizing class discrimination
In a supervised situation, the information available from the decision attribute is used for constructing a space where objects belonging to different classes are maximally differentiated. NDA networks are used for that purpose. However, a structure preserving space is not necessarily class-discriminating and conversely. The distribution of the classification error for the cave class is shown in Figure 1 (Right) (the only determined class in the problem). The distribution exhibits a skewed-multimodal characteristic with the important modes shifted towards smaller error values (a good feature). Several networks have 0% classification error for the cave class and a representative of them is the one found in experiment 174. A VR-space was built from a composition of the mapping function (ϕ) represented by that network, with a principal components transformation (P) given byf = (ϕ ◦ P) (Figure 5).
The intrinsic dimensionality of this space is very close to one, and its shape indicates an almost linear continuum within and between the two classes. Conceptually, the objects at the two extremes represent the maximum expression of a
cavehoodproperty, and its opposite, the maximum expression of being solid rock, in geological terms. In between there is a
gradation of the cavehood property, which is actually a fuzzy concept. Letom∈ O be the object of the VR-space satisfying
the property ((ϕ ◦ P)(om))pc1 ≤ ((ϕ ◦ P)(o))pc1 for all
o ∈ O and let oM be the object such that d(om, oM) >=
d(om, o) for all o ∈ O, o 6= om whered is the Euclidean
distance andpc1is the first principal component. Then, a two
dimensional membership function µc ∈ [0, 1] for caveness
can be constructed asµc(o) = (1 − (d(om, o)/d(om, oM))).
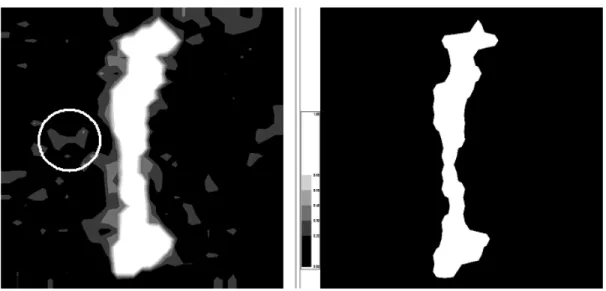
Note that although a supervised approach was used, this formulation is based only on the information about the known class. This approach can be extended to multiclass problems with partially defined classes. The distribution of µ within the investigated area is shown in Figure 6
The behavior of µ depicts a very consistent and realistic geological pattern, where not only the known cave is cor-rectly flagged with maximal membership values, but also defines a collection of hallos around the known cave with progressively decreasing values. In addition, other smaller areas with medium to high values are indicated, suggest-ing locations where other underground cavities could be expected. In particular, a borehole drilled at a location within the white circle of Figure 6 (Left) actually hit a cavity.
VIII. CONCLUSIONS
A combination of neural networks and rough set tech-niques was used for constructing virtual reality spaces for vi-sual data mining suitable for representing data and symbolic knowledge. Good neural network models were found with the use of distributed computing techniques, which when used as space mapping functions produce high quality VR-spaces where the properties of data and symbolic knowledge can be revealed. Problems with partially defined classes can be approached successfully by combining unsupervised and supervised techniques. A method for constructing member-ship functions in problems with partially defined classes is proposed which can be used as a forecasting tool, as illustrated with an example from geophysical prospecting.
Fig. 5. VR-space maximizing class separability for the1225 objects according to the (ϕ ◦ P) function. The classification error of the cave class is 0.
Fig. 6. Left: Fuzzy membership function µcof the cave class computed from the VR-space obtained from the NDA network (Extreme values: white=1,
black=0). Right: Map of the known cave. The white circle indicates the area where a borehole hit a cavity, not opened to the surface.
ACKNOWLEDGMENTS
The authors would like to thank Robert Orchard from the National Research Council of Canada (Institute for In-formation Technology, Integrated Reasoning Group) for his constructive comments. This work was partially supported by the Consejo Interministerial de Ciencia y Tecnolog´ıa (CICYT), under project TIN2006-08114.
REFERENCES
[1] M. Anderberg, Cluster Analysis for Applications, Academic Press, 1973. [2] J. G. Bazan, A. Skowron and P. Synak, “Dynamic Reducts as a Tool for Extracting Laws from Decision Tables”, Symp. on Methodologies
for Intelligent Systems. Charlotte, NC, Oct. 16-19, 1994. Lecture Notes in Artificial Intelligence 869, 346–355, Springer-Verlag, 1994. [3] I. Borg and J. Lingoes, Multidimensional Similarity Structure Analysis,
Springer-Verlag, 1987.
[4] U. Fayyad, G. Piatesky-Shapiro and P. Smyth, From Data Mining to Knowledge Discovery. In U.M. Fayyad et al. (eds.) Advances in
Knowledge Discovery and Data Mining, 1–34. AAAI Press, 1996. [5] J. C. Gower, A General Coefficient of Similarity and Some of its
Properties. Biometrics 1 (27), 857–871, 1973.
[6] J. Hartigan, Clustering Algorithms, John Wiley & Sons, 1975. [7] A. K. Jain and J. Mao, “Artificial Neural Networks for Nonlinear
Projection of Multivariate Data”, IEEE Joint Conf. on Neural Networks, 335–340, Baltimore, MD, 1992.
[8] J. Mao and A. K. Jain, “Discriminant Analysis Neural Networks”,
Proc. IEEE Int. Conf. on Neural Networks, 300–305, San Francisco, California, 1993.
[9] J. Mao and A. K. Jain, “Artificial Neural Networks for Feature Ex-traction and Multivariate Data Projection”, IEEE Trans. on Neural
Networks, vol. 6, 296–317, 1995.
[10] Z. Pawlak, Rough Sets: Theoretical Aspects of Reasoning About Data, Kluwer Academic Publishers, Dordrecht, Netherlands, 1991.
[11] A. Øhrn and J. Komorowski, “Rosetta- A Rough Set Toolkit for the Analysis of Data”, Proc. Int. Joint Conf. on Information Sciences (JCIS97), Durham, NC, USA, 403–407, 1997.
[12] J. W. Sammon, “A Non-linear Mapping for Data Structure Analysis”,
IEEE Trans. Computers, C-18, 401–408, 1969.
[13] J. J. Vald´es and J. L. Gil, “Application of Geophysical and Geomath-ematical Methods in the Study of the Insunza Karstic Area (La Salud, La Habana)”. Proc. of the First International Colloquium of
Physical-Chemistry and Karst Hydrogeology in the Caribbean Region, UNESCO, La Habana, 376–384, 1982.
[14] J. J. Vald´es, “Virtual Reality Representation of Relational Systems and Decision Rules: An exploratory Tool for Understanding Data Structure”,
In Theory and Application of Relational Structures as Knowledge Instruments. Meeting of the COST Action 274 (P. Hajek. Ed). Prague, 2002.
[15] J. J. Vald´es, “Similarity-based Heterogeneous Neurons in the Context of General Observational Models”, Neural Network World, vol 12, no. 5, 499–508, 2002.
[16] J. J. Vald´es, “Virtual Reality Representation of Information Systems and Decision Rules: An Exploratory Tool for Understanding Data and Knowledge”, Proc. Int. Conf. on Rough Sets, Fuzzy Sets, Data Mining
and Granular Computing(Wang, Liu, Yao, Skowron, eds.). Chongqing, China, 2003. Lecture Notes in Artificial Intelligence LNAI 2639, 615– 618. Springer-Verlag, 2003.
[17] J. J. Vald´es, “Building Virtual Reality Spaces for Visual Data Min-ing with Hybrid Evolutionary-classical Optimization: Application to Microarray Gene Expression Data”, Proc. IASTED Int. Joint Conf.
on Artificial Intelligence and Soft Computing, ASC’2004, 161–166, Marbella, Spain. ACTA Press, Anaheim, USA, 2004.
[18] J. J. Vald´es and A. J. Barton, “Virtual Reality Visual Data Mining with Nonlinear Discriminant Neural Networks: Application to Leukemia and Alzheimer Gene Expression Data”, Proc. Int. Joint Conf. on Neural
Networks, Montreal, 2005.
[19] A. R. Webb and D. Lowe, “The Optimized Internal Representation of a Multilayer Classifier”, Neural Networks, vol. 3, 367–375, 1990. [20] J. Wr´oblewski, “Ensembles of Classifiers Based on Approximate